
AGENDA Introduction Industry Overview Risk Analysis Company Analysis Valero Energy Corporation Provident Inter Pipeline Conclusion Recommendations INDUSTRY OVERVIEW Main Sector in Oil and Gas Industry ID: 383858
Download Presentation The PPT/PDF document "PETROLEUM REFINING" is the property of its rightful owner. Permission is granted to download and print the materials on this web site for personal, non-commercial use only, and to display it on your personal computer provided you do not modify the materials and that you retain all copyright notices contained in the materials. By downloading content from our website, you accept the terms of this agreement.


Slide1
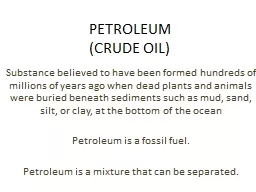
PETROLEUM REFINING
Slide2
AGENDA
Introduction
Industry Overview
Risk
Analysis
Company AnalysisValero Energy CorporationProvidentInter PipelineConclusionRecommendations Slide3
INDUSTRY OVERVIEWSlide4
Main Sector in Oil and Gas IndustrySlide5
Petroleum Refining
A
refinery takes a raw material (crude oil) and transforms it into petrol and hundreds of other useful products.What refining does:Adjusts and reshapes molecules
Standardizes product
Removes
contaminants to meet requirements for: end-user performance environmental regulations Slide6
Major ProductsSlide7
Main Processes
All refineries perform three basic steps:Separation: fractional
distillation)Conversion: cracking and rearranging the moleculesTreatment: blending
, purifying, fine-tuning and
improving
products to meet specific requirements Slide8Slide9
R
efinery SystemSlide10
World’s Top Refineries Companies in 2011Slide11
Geographic distribution in U.S.Slide12
U.S. Top Refineries Companies in 2011Slide13
Refineries in Canada
Thousand of Cube Meters per day in 2007Slide14
Canada Top Refineries Companies 2010Slide15
Refining Capacity Changes for Integrated MajorsSlide16
Refining Capacity Changes for Integrated Majors
IMPLICATIONS:DOWNSTREAM DIVESTMENTS
Integrated majors continuing to exit refining business – some through divestment of refining assets and some through spinning off of Downstream business as a separate corporate entity.
Result
is that refinery ownership is moving away from integrated majors towards non-integrated companies.
To remain viable, refining businesses will need to be able to generate sufficient cash to provide an adequate return to their ownersSlide17
Evaluation of Refinery Capacity Slide18
Future Capacity ForecastSlide19
Factors Determining Gas PriceSlide20
Refinery Margin and Major Costs
Refining margin
= total value of petroleum products - the price of the raw material-other costsMajor CostsFixed
operating
costs:
labour, maintenance, taxes and overhead costsVariable operating costs: feed-dependent costs for power, water, chemicals, additives, catalyst and refinery fuels beyond own productionTransport costsMarginal crude freight Insurance and ocean loss Applicable fees and dutiesSlide21
Regional Refining
Margins
$/barrelSlide22
REGULATION ENVIRONMENTSlide23
Green House Gas Regulation
EPA has started to propose regulation of GHG’s under existing CAA programs such as Vehicle Emissions standards rule, Prevention of Significant Deterioration, and New Source Performance Standards
Under these regulations, permits will be required for projects that emit threshold levels of CO2 (regardless of emissions of other criteria pollutants such as SOx, NOx
, etc. Slide24
Implications
Significantly more permits will be required for refinery modifications Require
installation of BACT (Best Available Control Technology) for managing CO2 emissions. BACT to be determined on case-by-case basis. EPA is currently working on approach for refinery GHG measures: Energy managementCommand and control (source specific emission limits) Benchmarking
In any case, greater focus on energy reduction projects will likely
be
required.Slide25
Reformulated Fuel Standard (RFS2)
RFS program was created under the Energy Policy Act of 2005. Established first renewable fuel mandate – 7.5 billion gallons by 2012
Established new categories of renewable fuel and mandates for each, and increased volumes of renewable fuel (9 billion gallons in 2008 to 36 billion gallons by 2022) Slide26
Reformulated Fuel Standard (RFS2) Slide27
Implications
Growth in biofuels exceeds overall growth in transportation fuels – increased pressure on refining
Significant expansion in facilities required to manufacture, store, transport, and blend biofuels Impact of increasing biofuels volumes will result in changes to mix of fuel blending components – refinery configuration and/or new technologies Slide28
Other Regulations
Clean Air Act
Dominant regulatory effect on refinery operations Reformulated gasoline (RFG) standards
A
ffects
operations indirectly through restrictions on product mixClean Water ActRCRAState regulationsCorporate Average Fuel Economy (CAFE) standardsIndirect effect through performance requirements on productsSlide29
Risk AnalysisSlide30
Typical Risks in the Oil and Gas Industry Slide31
Key drivers and Challenges in RefinerySlide32
Risk Exposure
Operational Risk
Environmental ConsiderationEconomic and Political Risk
Commodity Risk
Financial Risk
Regulatory LimitationsLimitation on CapacitySlide33
Environmental Impacts and Risks
Air
Refinery emissions contain several major ozone precursors. The associated impacts would be most significant near and downwind of a given facility.
Water
and
soilPotential for contamination from leaks and spillsCarcinogens Benzene is a significant component of refinery air emissionsGlobal warmingSlide34
Market Environment Characterized by Rising Regulatory Costs and Excess Capacity Abroad
Rising costs of production from recently enacted environmental and regulatory requirements.
Rising competition from foreign competitors – 7.6 – 8.8 million barrels per day (mb/d) of new refining capacity is expected to come online by 2015 – 80% of which will be built outside of the OECD. Flat or declining demand for transportation fuels in the U.S. market
.
Rising
taxes, and biofuel mandates will further shrink margins and place 2.5 mb/d of the current 17.5 mb/d of domestic operable capacity at high risk of permanent closure early in the 2015-2030 forecast period.Future Regulation: Waxman-Markey LegislationSlide35
Future Regulation: Waxman-Markey LegislationSlide36
Future Regulation: Waxman-Markey LegislationSlide37
Implications
Gasoline
Prices
In the 2015
-2030 gasoline
prices could rise by an average of $0.20 to $0.40 per gallon under the carbon costs calculated by the U.S. Environmental Protection Agency (EPA). Gasoline, and all other petroleum based transportation fuels, could rise by over $1/gallon under some CO2 allowance cost forecasts by the U.S. Energy Information Administration (EIA).Slide38
Risk Measurement
Sensitivity analysis
Simulation AnalysisProbability Estimation
Value at Risk (
VaR
)Slide39
Risk Management
Diversification and Insurance
OTC Forward ContractsExchange-Traded Energy Futures
Foreign Exchange Futures
Hedging through OptionsSlide40
Valero Energy CorporationSlide41
VLO - NYSESlide42
Overview
Fortune 500 company based in San Antonio, Texas
Incorporated in 1981 – Valero Refining & Marketing Company
Changed name in 1997 to Valero Energy Corporation
22,000 employeesSlide43
Executives
Bill
Klesse
Chairman of the Board, CEO and President
Started out as chemical engineer
BSci Chem
Eng
MBA in Finance
Mike
Ciskowski
Executive Vice President and Chief Financial Officer
Responsible for Treasury, Finance, Accounting, Internal Audit, Trading Controls and Insurance
BBA & MBA in Finance
Jay Browning
Senior Vice President-Corporate Law and Secretary
R
esponsible
for Corporate Governance, Finance, Securities and Exchange Commission, and Information Systems Support.
BBA & MBA in Finance
Donna
Titzman
Vice President and Treasurer
Responsible for the company’s banking, cash management, customer credit and investment management areas.
BBA Accounting, CPASlide44
Segments
Refining
Refining operations, wholesale marketing, product supply and distribution, and transportation operations
Ethanol
Sales of internally produced ethanol and distillers grains
Our ethanol operations are geographically located in the central plains region of the U.S.
Retail
Company-operated convenience stores, Canadian dealers/jobbers, truckstop facilities, cardlock facilities, and home heating oil operations.
Segregated into Retail-US and Retail-CanadaSlide45Slide46
Competitors
2010 Refining Capacity in USASlide47
Financial StatementsSlide48
Segment RevenuesSlide49Slide50
Gross margin: 9.2%
Operating margin: 3%Slide51Slide52Slide53
Operations - Petroleum
16 petroleum refineries are located in the United States (U.S.), Canada, the United Kingdom (U.K.), and Aruba
Conventional gasolines
Distillates
Jet fuel
Asphalt
Petrochemicals
Lubricants
Premium products including CBOB and RBOB1
Gasoline meeting the specifications of the California Air Resources Board (CARB)
CARB diesel fuel
Low−sulfur and ultra−low−sulfur diesel fuelSlide54
Refining CapacitySlide55
Refining YieldsSlide56
Feedstock Supply
Approximately
63 percent of our current crude oil feedstock requirements
are purchased through
term contracts
while the remaining requirements are generally purchased on the
spot market
.
The majority of the crude oil purchased under our term contracts is purchased at the producer’s official stated price (
i.e
., the “market” price established by the seller for all purchasers) and not at a negotiated price specific to us.Slide57
Feedstock Supply
Approximately
63 percent of our current crude oil feedstock requirements
are purchased through
term contracts
while the remaining requirements are generally purchased on the
spot market
.
The majority of the crude oil purchased under our term contracts is purchased at the producer’s official stated price (
i.e
., the “market” price established by the seller for all purchasers) and not at a negotiated price specific to us.Slide58
Marketing
We market our refined products through an extensive bulk and rack marketing network and we sell refined products through a network of approximately 6,800 retail and wholesale branded outlets in the United States (U.S.), Canada, the United Kingdom (U.K.), Aruba, and Ireland under various brand names including Valero®, Diamond Shamrock®, Shamrock®, Ultramar®, Beacon®, and Texaco®Slide59
Operations - Ethanol
10 ethanol plants in the Midwest Slide60
Operations - Retail
Retail – U.S.
Sales of transportation fuels
Average 119,780 BPD
Fuels sold under Valero brand
Convenience store merchandise and services
998 company-operated sites under Corner Store brand name
Retail – Canada
Sales of transportation fuels
Average 76,100 BPD
Fuels sold under Ultramar brand
791 outlets
381 owned
410 independent dealers and jobbers
Sales of home heating oil to residential customersSlide61
Growth Strategy
“leads in shareholder value growth through innovative, efficient upgrading of low cost
feedstocks
into high value, high quality products.”
Aggressive “growth through acquisitions” strategy
Since 1997
1,000 to 22,000 employees
1 to 16 refineries
0.2 to 3 million BPD capacitySlide62
Risk Oversight
The Board considers oversight of Valero’s risk management efforts to be a responsibility of the full board
Risk management is an integral part of Valero’s annual strategic planning process, which addresses, among other things, the risks and opportunities facing Valero Slide63
Risk Management Policies
“The Board had a Finance Committee in 2010. The Finance Committee reviewed and monitored the investment policies and performance of our Thrift Plan and pension plans, insurance and
risk management policies and programs
, and finance matters and policies as needed. During 2010, the members of the Finance Committee were
Irl F. Engelhardt (Chairman), Ruben M. Escobedo, Bob Marbut, Susan Kaufman Purcell, and Stephen M. Waters
. The Finance Committee met
three times
in 2010. The Board has determined that it
will not
have a separately appointed Finance Committee in 2011.”Slide64
Risk Factors
1. Volatility of refining margins & global economic activity
Primarily affected by the relationship, or margin, between refined product prices and the prices for crude oil and other
feedstocks
Affected by regional/global supply & demand for crude oil and refined products, US & global economies, US relationships with foreign governments, governmental regulationSlide65
Risk Factors
2. Uncertainty and illiquidity in credit and capital markets
Can impair our ability to obtain credit and financing on acceptable terms, and can adversely affect the financial strength of our business partnersSlide66
Risk Factors
3. Compliance with and changes in environmental laws
Emissions into the air and releases into the soil, surface water, or groundwater
Level of expenditures required for environmental matters could increase in the future due to more stringent and new environment laws and regulationsSlide67
Risk Factors
4. Disruption of our ability to obtain crude oil could adversely affect our operations
Supplies originating in Middle East, Africa, Asia, North America & South America
Political, geographic and economic risks
Possibility for unavailability of alternative sources or volumes at unfavourable pricesSlide68
Risk Factors
5. Reliance on third-party transportation of crude oil and refined products
Subject to interruptions in supply and increased costs
Weather events, accidents, governmental regulations, or third-party actionsSlide69
Risk Factors
6. Competitors that produce their own supply of
feedstocks
, have more extensive retail outlets, or have greater financial resources may have a competitive advantage
Do not produce any of our crude oil
feedstocks
Many competitors obtain significant portion of
feedstocks
from company-owned productionSlide70
Risk Factors
7. A significant interruption in one or more of our refineries could adversely affect our business
Refineries are principal operating assets
Interruption: lost production and repair costsSlide71
Risk Factors
8. Insurance may not cover all potential losses from operating hazards
We maintain insurance against many, but not all, potential losses arising from operating hazards
For example, coverage for hurricane damage is very limited, and coverage for terrorism risks includes very broad exclusions
Failure by one or more insurers to honor its coverage commitments for an insured eventSlide72
Risk Factors
9. Compliance with and changes in tax laws could adversely affect our performance
Extensive tax liabilities imposed by multiple jurisdictions, including
income taxes,
transactional taxes (excise/duty, sales/use, and value-added taxes),
payroll taxes,
franchise taxes,
withholdingtaxes
, and
ad valorem taxes.Slide73
Risk Factors
10. Losses as a result of our forward-contract activities and derivative transactions
Currently use derivative instruments
Expect to continue their use in the future
If these instruments we use to hedge are not effective, we may incur lossesSlide74
Item 7A
Commodity Price Risk
Interest Rate Risk
Foreign Currency Risk
Compliance Program Price RiskSlide75
Commodity Price Risk
Future markets for liquidity
Swaps for price exposure
Certain commodity derivative instruments for trading purposes to take advantage of existing market conditions related to future results of operations and cash flowsSlide76
Commodity Price Risk
“Our positions in commodity derivative instruments are monitored and managed on a daily basis by a risk control group to ensure compliance with our stated risk management policy that has been approved by our board of directors.”Slide77
Commodity Price Risk
Sensitivity AnalysisSlide78
Commodity Price Risk
For risk management, we use:
Fair Value Hedges
Cash Flow Hedges
Economic Hedges
Trading DerivativesSlide79
Commodity
Price Risk
Fair Value Hedges
Hedge price volatility in certain refining inventories and firm commitments to purchase inventories
Level of activity for our fair value hedges is based on the level of our operating inventories, and generally represents the amount by which our inventories differ from our previous year-end LIFO inventory levelsSlide80
Commodity Price Risk
Cash Flow Hedges
Price volatility in certain forecasted feedstock, refined product purchases, refined product sales & natural gas purchasesSlide81
Commodity Price Risk
Economic Hedges
Manage price volatility in certain (
i
) refinery feedstock, refined product, and corn inventories, (ii) forecasted refinery feedstock, refined product, and corn purchases, and refined product sales, and (iii) fixed-price corn purchase contractsSlide82
Commodity Price Risk
Trading Derivatives
Take advantage of existing market conditions related to future results of operations and cash flowsSlide83
Interest Rate Risk
No outstanding interest rate derivatives as of Dec 31, 2011 & 2010Slide84
Foreign Currency Risk
As of December 31, 2011, we had commitments to purchase $751 million of U.S. dollars
Our market risk was minimal on the contracts, as they matured on or before January 26, 2012, resulting in a $3 million lossSlide85
Compliance Program Price Risk
Exposed to volatility in the price of financial instruments associated with various governmental and regulatory compliance programs that we must purchase in the open market to comply with these programs.
As of December 31, 2011, we had purchased futures contracts – long for 68,000 metric tons of EU emission allowances that were entered into as economic hedges.Slide86
Fair Value MeasurementsSlide87
Fair Values of Derivative InstrumentsSlide88Slide89
Corporate Overview
Calgary based corporation that owns and operates NGL midstream services
Provides natural gas liquids midstream processing and marketing in western and central Canada and the United States
4th largest integrated oil and gas company in Canada
Energy products include: ethane, butane, propane, condensate
Non energy products: storage, processing,
terminalling
and transportationSlide90
Corporate Overview
The Midstream business unit extracts, processes, stores, transports and markets natural gas liquids (NGLs) for Provident and offers these services to third party customers
Three operations:
Empress East
Redwater
West
Commercial ServicesSlide91
Map of OperationsSlide92
Empress East
Extracts NGLs from natural gas at the Empress straddle plants and sells finished products into markets in central Canada and the eastern United States.
The margin in this business is determined primarily by the “
frac
spread ratio”, which is the ratio between crude oil prices and natural gas prices
Demand for propane is seasonal and results in inventory that generally builds over the second and third quarters of the year and is sold in the fourth quarter and the first quarter of the following year
.Slide93
Redwater
West
Purchases an NGL mix from various producers and fractionates it into finished products at the
Redwater
fractionation facility, the feedstock for this business line is primarily NGL mix rather than natural gas, the
frac spread ratio has a smaller impact on margin than in the Empress East business lineCaptures supply from northeast British Columbia and northwest Alberta and generates revenues through extraction, gathering, transportation, storage and fractionation of NGL into finished products
Has several significant competitive advantages including the ability to process sour NGL and is one of only two fractionation facilities in the Fort Saskatchewan area capable of processing ethane-plus
Located at the
Redwater
facility is rail-based condensate terminal, which serves the heavy oil industry and its need for diluent Slide94
Commercial services
Commercial Services - generates income from relatively stable fee-for-service contracts to provide fractionation, storage, loading, and marketing services to upstream producers. Income from pipeline tariffs from
Provident's
ownership in NGL pipelines is also included in this business line
Redwater
facility has a rail unloading capacity of 110 rail cars per day or 75,000 bpd
Storage facilities at both Empress East and
Redwater
West facilities
seven million gross barrels at Empress East
50% ownership of 2.5 mm-
bbl
storage cavern and 100% ownership of 1000 acre 12 million barrel storage cavern at
Redwater
WestSlide95
Stock DetailsSlide96
Financial StatementsSlide97Slide98Slide99Slide100
Provident Midstream business performance
Slide101
Risk Factors
1.
Frac
Spread and Commodity Price
Exposed to possible price declines between the time Provident purchases NGL feedstock and sells NGL products, and to narrowing
frac spreadsAlso a differential between NGL product prices and crude oil prices which can change prices received and margins realized for midstream products separate from frac spread ratio changesSlide102
Risk Factors
2.
Facilities Throughput and Product Demand
Volumes of natural gas processed through
Provident's
natural gas liquids midstream processing and marketing business and of NGLs and other products transported in the pipelines depend on production of natural gas in the areas serviced by the business and pipelinesWithout reserve additions, production will decline over time as reserves are depleted and production costs may rise
Producers may shut in production at lower product prices or higher production costs
Producers in the areas serviced by the business may not be successful in exploring for and developing additional reserves, and the gas plants and the pipelines may not be able to maintain existing volumes of throughputSlide103
Risk Factors
3.
Operating and Capital Costs
Operating and Capital Costs may vary considerably from current and forecast values and rates and represent significant components of the cost of providing serviceSlide104
Risk Factors
4.
Reliance on Principal Customers and Operators
Rely on several significant customers to purchase product from the Midstream Business
If for any reason these parties were unable to perform their obligations under the various agreements with Provident, the revenue and dividends of Provident, and the operations of the Midstream Business could be negatively impactedSlide105
Risk Factors
5.
Operational Matters and Hazards
Subject to common hazards of the natural gas processing and pipeline transportation business
The operation of
Provident's natural gas liquids midstream processing and marketing business could be disrupted by natural disasters or other events beyond the control of ProvidentSlide106
Risk Factors
6.
Competition
Subject to competition from other gas processing plants which are either in the general vicinity of the gas plants or have gathering systems that are or could potentially extend into areas served by the gas plants
Producers in Western Canada compete with producers in other regions to supply natural gas and gas products to customers in North America and the natural gas and gas products industry also competes with other industries to supply the fuel, feedstock and other needs of consumers
Slide107
Risk Factors
7.
Regulatory Intervention
Pipelines and facilities can be subject to common carrier and common processor applications and to rate setting by regulatory authorities in the event agreement on fees or tariffs cannot be reached with producersSlide108
Risk Factors
8.
Environmental Considerations
Major equipment failure, release of toxic substances or pipeline rupture could result in damage to the environment and
Provident's
natural gas liquids midstream processing and marketing business, death or injury and substantial costs and liabilities to third partiesThe gas processing and gathering industry is regulated by federal and provincial environmental legislationSlide109
Risk Factors
9.
Variations in Interest Rates and Foreign Exchange Rates
Variations in interest rates could result in a significant change in the amount Provident pays to service debt, potentially impacting dividends to Shareholders.
Variations in the exchange rate for the Canadian dollar versus the U.S. dollar could affect future dividendsSlide110
Risk Management Philosophy
Provident has an
Enterprise Risk Management program
that is designed to identify and manage risks that could negatively impact the business, operations, or results
Utilizes a hedging program that protects a portion of the company's cash flow and supports continued
unitholder distributions, capital programs, and bank financing
Has an insurance program in place to mitigate the economic costs associated with risks to the business, its assets, and its people
Manages counterparty exposure with a credit policy that establishes limits by counterparty based on an analysis of financial information and other business factorsSlide111
Risk Management overview
Enterprise Risk Management program that is designed to identify and manage risks that could negatively affect its business, operations or results. The program’s activities include risk identification, assessment, response, control, monitoring and communication of derivative instruments
Provident uses include put and call options, costless collars, participating swaps, and fixed price products that settle against indexed referenced pricing
Provident’s
commodity price risk management program utilizes derivative instruments to provide for protection against lower commodity prices and product margins, as well as fluctuating interest and foreign exchange rates.
Provident may also use derivative instruments to protect acquisition economics. The program is designed to stabilize cash flows in order to support cash distributions, capital programs and bank financingSlide112
Fair Values
Fair value measurement of assets and liabilities recognized on the consolidated statement of financial position are categorized into levels within a fair value hierarchy based on the nature of valuation inputs
Level 1 – Unadjusted quoted prices in active markets for identical assets or liabilities;
Level 2 – Inputs other than quoted prices that are observable for the asset or liability either directly or indirectly; and
Level 3 – Inputs that are not based on observable market data
Provident’s
financial derivative instruments have been classified as Level 2 instrumentsSlide113
Financial Derivative Sensitivity AnalysisSlide114
Market EnvironmentSlide115
Market Risk
Market risk is the risk that the fair value of a financial instrument will fluctuate because of changes in market prices
Price risk
Currency risk
Interest riskSlide116
Market Risk Management Program
Utilizes financial derivative instruments to provide protection against commodity price volatility and protect a base level of operating cash flow
Protect the relationship between the purchase cost of natural gas and the sales price of propane, butane and condensate and to protect the relationship between NGLs and crude oil in physical sales contracts
Reduces foreign exchange risk due to the exposure arising from the conversion of U.S. dollars into Canadian dollars, interest rate risk and fixes a portion of
Provident’s
input costsSlide117
Risk Management ContractsSlide118
Settlement of ContractsSlide119
Liquidity RiskSlide120
Credit RiskSlide121
Net Financial Derivative InstrumentsSlide122
Commodity Price Risk Program
Provident's
commodity price risk management program utilizes commodity hedges to protect against adverse price movements
Provident's
intention is to routinely hedge approximately 50 percent of its natural gas and NGL volumes on a rolling 12 month basis. Subject to market conditions, Provident may add additional hedges as appropriate for up to 24 monthsSlide123
Frac
Spread VolumesSlide124
Contracts In Place Slide125
Contracts In PlaceSlide126Slide127
Historical Stock PriceSlide128
Corporate Profile – IPL
Petroleum transportation, storage and natural gas liquids extraction business
Operating approximately 6,100 kilometres of petroleum pipelines and 4.8 million barrels of storage in western Canada
Made the 100 Venture’s listSlide129
Executives
CEO: David W.
Fesyk
President since 1997
Senior executive
and general partner
at Koch from 1991 to 2002
Director of
South Saskatchewan Pipeline CompanySlide130
Operation Overview
Conventional Pipelines
Oil Sands Transportation
NGL Extraction
Bulk Liquid StorageSlide131
Operation OverviewSlide132
Conventional Pipelines
Through a total of approximately 3,700
kilometres
(almost 2,300 miles) of pipeline and over 975,000 barrels of storage, the conventional gathering business transported approximately 170,000 b/d of crude in 2011
Crude for the conventional systems is gathered from approximately 160 producer owned batteries and 20 truck terminals throughout southern Alberta and southwest Saskatchewan for delivery to key market hubs in Alberta and Saskatchewan
.Slide133
Conventional PipelinesSlide134
Oil Sands Transportation
The Oil Sands Transportation business is the largest oil sands gathering business in Canada - transporting in 2011 roughly 786,000 b/d of bitumen blend or approximately 35% of Canada’s oil sands production
Consisting of the Cold Lake, Corridor and Polaris pipeline systems, this business segment has nearly 2,500 km of pipeline and 3.8 million barrels of storageSlide135
Oil Sands TransportationSlide136
NGL Extraction
Facilities process pipeline quality natural gas to remove natural gas liquids (NGL) comprised of ethane, propane, butanes and pentanes-plus
The NGL stream is then partially fractionated to produce a specification ethane product and a mix of propane, butane, and pentanes-plusSlide137
NGL ExtractionSlide138
Bulk Liquid Storage
Inter Pipeline's bulk liquid storage business segment is the fourth largest independent storage business in Europe
Operating under two wholly owned entities, the bulk liquid storage business operates 12 deep-water terminals and approximately 19 million barrels of storageSlide139
Bulk Liquid StorageSlide140
Financial StatementsSlide141Slide142Slide143Slide144
Performance Overview
Fourth quarter FFO* increased to $90 million, 12% higher than fourth quarter 2010 levels
Payout ratio before sustaining capital* of 72% for the quarter
Cash distributions to
unitholders
were $65 million or $0.2475 per unit
Inter Pipeline’s oil sands and conventional oil pipelines systems transported 945,100 b/dSlide145
Performance OverviewSlide146
Performance Overview
Cont
’Slide147
Risk Factors
1.
Demand risk
Inter Pipeline’s business will depend, in part, on the level of demand for petroleum in the geographic areas in which deliveries are made by the pipelines and the ability and willingness of shippers having access or rights to utilize the pipelines to supply such demandSlide148
Risk Factors
2.
Supply Risk
Future throughput on the pipelines and replacement of petroleum reserves in the pipelines’ service areas is dependent upon the success of producers operating in those areas in exploiting their existing reserve bases and exploring for and developing additional reserves
Reserve bases necessary to maintain long term supply cannot be assured, and petroleum price declines, without corresponding reductions in costs of production, may reduce or eliminate the profitability of production and therefore the supply of petroleum for the pipelinesSlide149
Risk Factors
3.
Competition and Contracts
While Inter Pipeline attempts to renew contracts on the same or similar terms and conditions, there can be no assurance that such contracts will continue to be renewed or, if renewed, will be renewed upon favourable terms to Inter Pipeline
Inter Pipeline's supply contracts with producers in the areas serviced by the conventional oil pipelines business are based on market-based toll structures negotiated from time to time with individual producers
The pipelines are subject to competition for volumes transported by trucking or by other pipelines near the areas serviced by the pipelinesSlide150
Risk Factors
4.
Operational Factors
The pipelines are connected to various third party mainline systems such as the Enbridge system, Express pipeline, the Trans Mountain pipeline, and the Plains Milk River system, as well as refineries in the Edmonton area
Operational disruptions or apportionment on third party systems or refineries may prevent the full utilization of the pipelines
Slide151
Risk Factors
5.
Multi-Jurisdictional Regulation
The pipelines are subject to intra-provincial and multi-jurisdictional regulation, including regulation by the Energy Resources Conservation Board in Alberta, and the Ministry of Energy and Resources in SaskatchewanSlide152
Risk Factors
6.
Natural Gas Availability and Composition
The volumes of natural gas processed by the NGL extraction business depend on the throughput of the Foothills and TransCanada Alberta systems from which the NGL extraction facilities source their natural gas supply
The production of NGL from the NGL extraction facilities is largely dependent on the quantity and composition of the NGL within the natural gas streams that supply the NGL extraction businessSlide153
Risk Factors
7.
Competition
The NGL extraction facilities are subject to natural gas markets and, as such, are subject to competition for gas supply from all natural gas markets served by the TransCanada Alberta System or the Foothills System
The NGL extraction facilities are subject to competition from other extraction plants that are in the general vicinity of the NGL extraction facilities or that may be constructed upstream of or in parallel to the NGL extraction facilitiesSlide154
Risk Factors
8.
Execution Risk and Reputational Risk
Inter Pipeline’s ability to successfully execute the development of its growth projects may be influenced by capital constraints, third party opposition, changes in customer support over time, delays in or changes to government and regulatory approvals, cost escalations, construction delays, shortages and in-service delays
Reputational risk is the potential for negative impacts that could result from the deterioration of Inter Pipeline’s reputation with key stakeholders. The potential for harming Inter Pipeline’s reputation exists in every business decision and all risks can have an impact on reputationSlide155
Hedging Philosophy
Inter Pipeline utilizes derivative financial instruments to manage liquidity and market risk exposure to changes in commodity prices, foreign currencies and interest rates
Risk management policies are intended to minimize the volatility of Inter Pipeline’s exposure to commodity price, foreign exchange and interest rate risk to assist with stabilizing FFO*
Derivative financial instruments:
commodity price swap agreements
foreign currency exchange contracts
power price hedges
heat rate and interest rate swap agreementsSlide156
Frac
-Spread Risk Management
Frac-spread risk : The difference between the weighted average propane-plus price and the Monthly index price of AECO natural gasSlide157
Frac
-Spread Risk ManagementSlide158
Power Price Risk Management
Inter Pipeline uses derivative financial instruments to manage power price risk in its NGL extraction and conventional oil pipelines business segments
Inter Pipeline enters into financial heat rate swap and power price swap contracts to manage power price risk exposure in these businesses.Slide159
Foreign Exchange Risk Management
Inter Pipeline uses derivative financial instruments to manage power price risk in its NGL extraction and conventional oil pipelines business segments. Inter Pipeline enters into financial heat rate swap and power price swap contracts to manage power price risk exposure in these businesses.Slide160
Interest Rate Risk Management
Based on the variable rate obligations outstanding at December 31, 2011, a 1% change in interest rates at this date could affect interest expense on credit facilities by approximately $14.7 million, assuming all other variables remain constant
The entire $14.7 million relates to the $1.55 billion Corridor credit facility and is recoverable through the terms of the Corridor FSA, therefore there would be no after-tax income impactSlide161
Fair Value Through Profit or LossSlide162
Fair Value Through Profit or LossSlide163
Credit Risk
Inter Pipeline’s credit risk exposure relates primarily to customers and financial counter-parties holding cash and derivative financial instruments, with a maximum exposure equal to the carrying amount of these instruments
Credit risk is managed through credit approval and monitoring procedures