
Assessment of ordered and complementary pore volumes in polymertemplated mesoporous silicas and organosilicas Mietek Jaronieca and Leonid A Solovyovb aDepartment of Chemistry Kent State Uni ID: 192173
Download Pdf The PPT/PDF document "Supplementary Material (ESI) for Chemica..." is the property of its rightful owner. Permission is granted to download and print the materials on this web site for personal, non-commercial use only, and to display it on your personal computer provided you do not modify the materials and that you retain all copyright notices contained in the materials. By downloading content from our website, you accept the terms of this agreement.

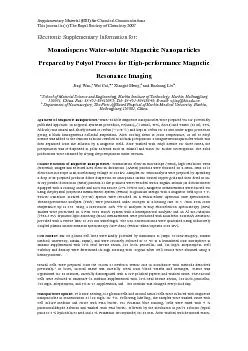
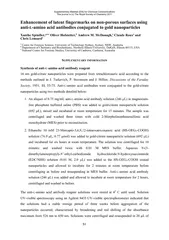
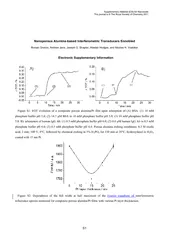


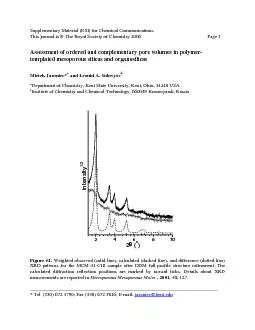
Supplementary Material (ESI) for Chemical Communications This journal is © The Royal Society of Chemistry 2006 Page 1 Assessment of ordered and complementary pore volumes in polymer-templated mesoporous silicas and organosilicas Mietek Jaroniec*a and Leonid A. Solovyovb aDepartment of Chemistry, Kent State University, Kent, Ohio, 44240 USA bInstitute of Chemistry and Chemical Technology, 660049 Krasnoyarsk, Russia 24681 0 Intensity1/22 (o) Figure S1. Weighted observed (solid line), calculated (dashed line), and difference (dotted line) XRD patterns for the MCM-41-C18 sample after DDM full-profile structure refinement. The calculated diffraction reflection positions are marked by inward ticks. Details about XRD measurements are reported in Microporous Mesoporous Mater., 2001, 48, 127. ___________________________________________________________________________ * Tel. (330) 672 3790; Fax (330) 672 3816; E-mail: jaroniec@kent.edu Supplementary Material (ESI) for Chemical Communications This journal is © The Royal Society of Chemistry 2006 Page 2 0.51.01.52.02.5 Intensity1/2 x q (a. u.)q (nm-1)1.52.02.5 x 7 Figure S2. Weighted and Lorentz-corrected observed (solid line), calculated (dashed line), and difference (dotted line) SAXS patterns for the SBA15 silica containing ethane bridging groups (SBA-15-E) after DDM full-profile structure refinement. The calculated diffraction reflection positions are marked by ticks. Details about SAXS measurements are reported in J. Phys. Chem. B, 2006, 110, 2972. Supplementary Material (ESI) for Chemical Communications This journal is © The Royal Society of Chemistry 2006 Page 3 0.51.01.52.0 Intensity1/2 x q (a. u.)q (nm-1) 0.51.01.52.0 Intensity1/2 x q (a. u.)q (nm-1) Figure S3. Weighted and Lorentz-corrected observed (solid line), calculated (dashed line), and difference (dotted line) SAXS patterns for SBA16-ICS sample after DDM structure refinement (left) and DDM pattern decomposition (right). The calculated diffraction reflection positions are marked by ticks. Details about SAXS measurements are reported in Chem. Mater., 2006, 18, in press. Supplementary Material (ESI) for Chemical Communications Chemistry 2006 Page 4 Structural parameters for the SBA-15 samples obtained by DDM. Sample , nm , nm t, nm Hex, % B, nm2 SBA-15/06 11.66 8.63 3.02 27.1 29.1 SBA-15/24 12.12 9.39 2.74 26.9 40.4 SBA-15/72 12.43 10.02 2.41 28.4 43.3 SBA-15/96 12.45 10.10 2.35 20.0 41.1 SBA-15/12* 12.29 9.72 2.56 28.0 42.7 SBA-15/48* 11.98 9.87 2.11 9.0 47.2 SBA-15/72* 12.44 10.37 2.07 11.1 46.3 SBA-15-E 12.97 9.00 3.96 19.6 29.1 , the lattice parameter; , the wall thickness (, the isotropic displacement parameter in the Debye-Waller factor. Supplementary Material (ESI) for Chemical Communications This journal is © The Royal Society of Chemistry 2006 Page 5 Relative Pressure 0.00.20.40.60.81.0 Volume Adsorbed (cm3 STP/g) 0200400600800 A Vco = 1.11 cm3/g Standard Adsorption s 0.00.51.01.52.02.5 Volume Adsorbed (cm3 STP/g) 0200400600800 Vco = 1.04 cm3/gB Relative Pressure 0.00.20.40.60.81.0 Volume Adsorbed (cm3 STP/g) 0200400600800 A Vco = 1.11 cm3/g Standard Adsorption s 0.00.51.01.52.02.5 Volume Adsorbed (cm3 STP/g) 0200400600800 Vco = 1.04 cm3/gB Pore Width (nm) 05101520 PSD (cm3g-1nm-1) 0.00.10.20.30.40.50.6 Vco = 1.11 cm3/gC Figure S4. Illustration of three methods for estimating the pore volume Vco, which includes the volume of ordered mesopores as well as the volume of complementary pores (i.e., micropores present in the mesopore walls and in the case of cage-like materials, interconnecting ordered apertures between neighboring ordered cages) from nitrogen adsorption data for SBA-15/06. Panel A shows the estimation of Vco directly from nitrogen adsorption isotherm by converting the amount adsorbed at the isotherm plateau, which appears after steep step reflecting capillary condensation in ordered mesopores, to the volume of liquid adsorbate; Panel B shows the evaluation of this pore volume by converting the intercept of the linear segment of the s-plot that appears after capillary condensation step, to the volume of liquid adsorbate, and Panel C illustrates the estimation of this volume by integration of the differential pore size distribution (in this case PSD was obtained by the KJS method) over the pore range including complementary small pores and ordered mesopores. Supplementary Material (ESI) for Chemical Communications This journal is © The Royal Society of Chemistry 2006 Page 6 Pore width (nm) 05101520 PSD (cc g-1nm-1) 0.00.10.20.30.40.50.6 0.20 cc/g0.34 cc/g Figure S5. Differential pore size distribution (PSD) calculated by the KJS method for SBA-15/06; integration of PSD up to 3nm gives the pore volume of 0.20 cc/g, whereas integration up to 6.5 nm gives the value of 0.36 cc/g.