
Pathway activity levels with ratio Abstract Metabolic pathway activity estimation from RNA Seq data Yvette TemateTiagueu Qiong Cheng Meril Mathew I gor Mandric Olga ID: 655421
Download Presentation The PPT/PDF document "Vertex labels swapping Edges swapping" is the property of its rightful owner. Permission is granted to download and print the materials on this web site for personal, non-commercial use only, and to display it on your personal computer provided you do not modify the materials and that you retain all copyright notices contained in the materials. By downloading content from our website, you accept the terms of this agreement.


Slide1
Vertex labels swappingEdges swapping Pathway activity levels with ratio
Abstract
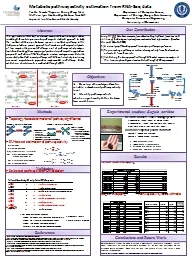
Metabolic pathway activity estimation from RNA-Seq data
Yvette Temate-Tiagueu, Qiong Cheng, Meril Mathew, Igor Mandric, Olga Glebova, Nicole Beth Lopanik, Ion Mandoiu and Alex Zelikovsky
Department of Computer Science, Department of Biology, Georgia State UniversityComputer Science and Engineering, University of Connecticut
Our Contribution
Using Kegg: database resource for understanding high-level functions and utilities of the biological system from molecular-level information. [Kanehisa M., and Goto S., 2000]A novel graph-based approach to analyze pathways significance Representing a pathway as a set an inferring activity from the information extracted from those setsValidating the two approaches through differential expression analysis at the transcripts and genes level and also through qPCR experiment
Objectives
Methods
Results
1
. Moran NA:
Symbiosis. Curr Biol 2006, 16:R866–R871. 2. McFall-Ngai M, Hadfield MG, Bosch TCG, Carey HV, Domazet-Loso T, Douglas AE, Dubilier N, Eberl G, Fukami T, Gilbert SF et al: Animals in a bacterial world, a new imperative for the life sciences. Proc Natl Acad Sci USA 2013, 110(9):3229-3236. 3. Haine ER: Symbiont-mediated protection. Proc R Soc B-Biol Sci 2008, 275(1633):353-361. 4. Lopanik NB: Chemical defensive symbioses in the marine environment. Funct Ecol 2013, 28:328-340. 5. Cragg GM, Newman DJ: Natural products: A continuing source of novel drug leads. Biochimica Et Biophysica Acta-General Subjects 2013, 1830(6):3670-3695. 6. Piel J: Metabolites from symbiotic bacteria. Natural Product Reports 2009, 26(3):338-362. 7. Gerwick WH, Moore BS: Lessons from the past and charting the future of marine natural products drug discovery and chemical biology. Chem Biol 2012, 19(1):85-98.
Our experimental studies on Bugula neritina RNA-seq data (mutualistic symbiosis data vs none) show that, by analyzing metabolic pathways using our tool XPathway, we can effectively locate pathways which activities level significantly differ. This result is been validated through qPCR.This project is supported in part by the Molecular Basis of Disease fellowship of GSU
Conclusions and Future Work
The application of RNA-Seq has allowed various differential analysis studies including differential expression for pathways. A standard approach to study the metabolic differences between species is metabolic pathway. In this study, we introduce a novel approach to characterize pathways activity levels of two samples. We present XPathway, a set of pathways activity analysis tools based on Kegg-Kaas mapping of proteins to pathways. We applied our proposed methods on RNA-Seq Bugula neritina metagenomics data. We successfully identified several pathways with differential activity levels using our novel computational approaches implemented in XPathway. Further validation of initial results is conducted through qPCR.
Develop efficient algorithms for reliable estimation of pathway activity level Identify pathways which activities significantly differ between two conditions
Validation
Experimental studies
: Bugula neritina
In United States - Three sibling species:
Deep-water (West coast of United States) Shallow-water (West and Southern East coasts) Northern Atlantic (Northern East coast)Illumina sequence paired-end reads:Sample 1: Bugula with symbiont Sample 2: Bugula without symbiont
50bp paired-end reads
200bp mean fragment lengthAssembly into contigs by Trinity BLAST with Swissprot database
Sample 1
Sample 2
Topology-based estimation of pathway
significance
EM-based
estimation of pathway activity
Selected
pathways for
qPCR
validationqPCR
Model 1: permutation of labels
a
e
b
c
c
a
d
e
b
d
Model 2: permutation of edges
a
c
b
c
d
a
b
d
RNA-
seq
reads
2 Samples
Trinity
Binary EM
Contigs
IsoDE
Contigs
validation
KEGG,
SEED
Ortholog
groups
K00161
K00162
K00163
KEGG,
SEED
Ortholog
groups
K00161
K00162
K00163
Graph-based
Pathway significance
Pathway activity
Differentially expressed
pathways
Experimental validation
Proteins
MAFSAED
VLK EYD
RRMEAL
BLAST
b
inary activity status of w
activity level of pathway w
Bootstrapping:
Repeat
1000
times
Randomly switch edges
Compute density of the largest component
Sort
wrt
to density
Find the rank of the observed induced subgraph
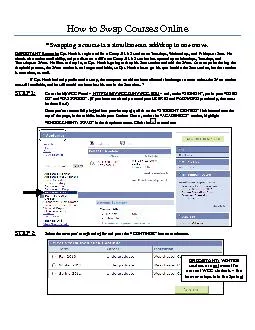
For
gene expression analyses:
Select pathways with significantly different activity
Select DE transcripts from these pathways
Select the genes from these transcripts
Primers are created to test genes per condition
Preliminary results
More primers ordered
References
In induced
graph:
#
nodes N
#
edges M
#
green connected components
#
0 in- & out-degrees
Density
of the induced graph:
M/(N-1)