
Dr Chris Murray Department of Interdisciplinary Studies Outline What motivated this project Runoff and pollution Turfgrass as a water quality management tool Experiments and studies of the effect of fertilization ID: 560524
Download Presentation The PPT/PDF document "What is the Risk to Runoff Water Quality..." is the property of its rightful owner. Permission is granted to download and print the materials on this web site for personal, non-commercial use only, and to display it on your personal computer provided you do not modify the materials and that you retain all copyright notices contained in the materials. By downloading content from our website, you accept the terms of this agreement.


Slide1
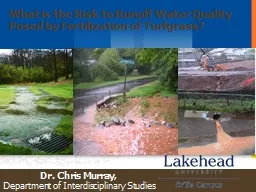
What is the Risk to Runoff Water Quality Posed by Fertilization of Turfgrass?
Dr. Chris Murray,
Department of Interdisciplinary StudiesSlide2
Outline
What motivated this project?
Runoff and pollution
Turfgrass as a water quality management tool
Experiments and studies of the effect of fertilization
ConclusionsSlide3
Project motivationA collaboration between Landscape Ontario’s Lawn Care Commodity Group and Lakehead UniversityTwo factors initiated this project:Source water protection agencies and similar organizations are considering fertilizer bans as a means of protecting water qualitySeveral studies had reported results contradicting this approach: where fertilizer is stopped, N,P in runoff
increasesSlide4
General research questionsWhat is the true state of scientific information regarding this issue?Is there consensus within the scientific community?If so, does it support a ban on fertilization of turfgrass?A primary focus of this study is the effect, both positive and detrimental, fertilization of turfgrass may have on the nutrient
pollution through
runoff.Slide5
Stormwater / runoffMost critical to understand: what dominates water pollutionWhy is runoff a problem?Runoff is “natural”, and would exist without human interventionHuman activity dramatically increases runoff and the pollution it carries.As runoff increases, pollution increasesSlide6Slide7
Algal Blooms, EutrophicationSlide8
TerminologySurface water/stormwater/runoffInfiltration/leachateIn general, we aim to increase infiltration and decrease runoff to decrease pollutionWhy?Sediment and associated chemical pollutantsSlide9
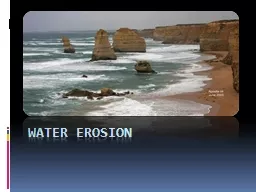
Erosion
Wherever development occurs, risk of increased runoff velocity and erosion
More sediment is carried into waterSlide10
Dissolved/particulate pollutionNutrients such as phosphorous are soluble in water, but will bind with minerals in sedimentA very small concentration of sediment may be responsible for most of the nutrient loadingFor a given mass, fine particles carry more pollution than large particles, and carry it furtherSlide11
How can adding fertilizer help?Turfgrass is, in general, a non-native groundcover that requires maintenance to thriveWithout human intervention, it will not outcompete indigenous plants (weeds) which are better-suited to harsh conditions (especially drought) but not suited to human-scale runoffIn general, healthier turfgrass increasingly reduces runoff and increases infiltration/evapotranspiration
Runoff can be completely eliminated by turfgrass, and a lawn is often the only barrier between impervious surfaces and waterwaysSlide12
Runoff, Infiltration and Erosion Control How might reducing fertilizer increase the concentration of N, P in water?
Small effect: increased decay of plants
Large effect: less healthy turfgrass cannot hold water as effectively, so runoff increases
Filtering is not enough: the amount of water must be reduced Slide13Slide14
Competing FactorsThe contamination of runoff by nutrients (both dissolved and particulate) found in fertilizer contributes to eutrophication of lakes causing negative impacts on the aquatic flora and fauna.
Healthier turfgrass
systems improve surface water quality through natural
filtration
and absorption of water, which
reduces
runoff intensity. Slide15
Reports worth examiningGarn, 2002: No runoff other than that due to rain on lawnsIncrease P in runoff for fertilized lawnsThe site with the best turf stand had the least runoff, though quantitative measurements not made.
No effect of fertilization on nitrogen in runoff
Kussow, 2002, 2004, 2008:
Fertilization with P leads to more P in runoff
Accounted for runoff volume
Most (runoff, nutrients) recorded when soil frozen
Without fertilization for two years, runoff, nitrogen and phosphorous increased
Whether soil is frozen is dominating factorSlide16
Easton and Petrovic, 2004Examined both synthetic and organic fertilizerP losses higher from P-containing fertilizer, highest for organic types (P applied very high)Fertilization increased infiltration, decreased runoffFrozen soil runoff accounted for majorityFertilization during establishment created most pollutionIn many cases, equal or higher N,P losses from unfertilized control due to overall increased runoffSlide17
Beirman et al., 2010Examined no fertilization, P-free, P and triple-P fertilizationRunoff highest for non-fertilized plotsP in runoff from non-fertilized site highest in year 1, the same as from site receiving P in fertilizer in subsequent four yearsFrozen soil runoff dominates P loading, and recommended that no P used in Fall where runoff potential is highSlide18
OverviewNo studies perfectly controlled, perfectly realistic, but…Usually, nutrient concentrations in runoff higher where fertilization is appliedUsually, amount of runoff is lower where fertilization is applied
Most often, the
total
nutrient loss in runoff is decreased by fertilizing
Where applicable, nutrient loss when ground is frozen dominates annual pollutionSlide19
ConclusionsThe majority of studies examining the effect of fertilization on turfgrass show reduced runoff (and reduced nutrient loading) when lawns are fertilizedTurfgrass is more effective than most alternative groundcoversFrozen soil, like any impervious surface, increases runoff potential and can be responsible for most of the pollutionSlide20
For more information contact:
Dr. Christopher Murray
Department of Interdisciplinary Studies
Lakehead University
cmurray1@lakeheadu.caSlide21
In
many
of
societies,
turf (grass) has received an
undeserved
black eye with respect to H
2
OSlide22
Finding BalanceLawns and Water Conservation
1 acre of trees produces enough oxygen for 18 people
1 acre of grass produces enough oxygen for 64 people
1 acre of rocks produces enough oxygen for 0 peopleSlide23
Benefits of TurfgrassFunctional
Recreational
Aesthetic
Soil erosion control
Dust prevention
Rain water entrapment
Heat dissipation
Glare reduction
Pollutant entrapment
Pest reduction
Fire prevention
Security
Environmental protection
Carbon Sequestering
Low cost surfaces
Physical health
Mental health
Safety cushion
Spectator environment
Beauty
Quality of life
Mental health
Social harmony
Community pride
Increased property values
Complements trees and shrubs in landscape
Water conservation is a serious
issueSlide24
The Scope of Water ProblemsWater shortages and water-quality issues are globalThere is a need to both conserve and clean the world’s water suppliesSolutions need to be based on long-term, site-specific considerationSlide25
The Scope of Water ProblemsWater shortages don’t only happen in low-rainfall or developing countriesWeather plays a roleRegulation Plays a role
30% water loss due to aging
Mechanical and structural
issues
Environmental allocations
Pollution Slide26
The Earth is 71 % Water and 29% Land
“Water, water everywhere,
And all the boards did shrink;
Water, water everywhere,
Nor any drop to drink.”
--Samuel Taylor Coleridge (1772-1834),
“The Rime of the Ancient Mariner” Slide27
The Hydrologic CycleAmount of water has remained relatively stable for eonsWe cannot increase water supply – we can only recycle itSlide28
Who Directly Consumes Highest % of Water?Cooling for thermoelectric generation & production agricultureDomestic uses target publicly supplied water
Greatest savings should come from greatest usersSlide29
Different ideas of landscape and landscape maintenance which uses more water…Slide30
*after 27 days with no water
applied Albany, OR 2008
10,000 GALLON WATER TANK
Mallard*
Solar Green*
How much water does your lawn use?
Mallard required 8,800 gallons of water to maintain a 5,000 square foot lawn over the entire summer (90 days).
Solar Green required 19,700 gallons of water to maintain the same area; using nearly two of these tanks over the same time period!Slide31
Mallard – 38% Green Cover
Geronimo – 2% Green Cover
Kentucky Bluegrass
50 Days With No Water
Created bySlide32
TWCA® Turfgrass Water Conservation Alliance
®
is an avenue to test and qualify turfgrass cultivars for improved drought tolerance.Slide33
Non-profit organizationBased on an accepted protocol (PST, NTEP, AR)
Utilized since 2002
Includes four grass seed companies – each participant develops their own brand
Has access to 8 rain out structures (OR (3), AR, VA, IN, NC, & newest addition Univ. of Guelph fall 2013)
Field testing in arid environments possible (OR, UC Riverside, CA, So NJ & possibly Olds College, Alberta, Canada)
TWCASlide34
Minimum testing = 2 location/yearsFinish in the top statistical group with Digital Imagery Analysis (DIA) data collections
Acceptable measure of turf quality
Comprise a minimum of 60% in blends or mixtures
3
rd
party peer review of cultivars
More information available at
www.tgwca.org
PROTOCOLSlide35
Drought Evaluation
Rain Out Shelters –
Oregon / Arkansas / Virginia / Indiana / North Carolina / Ontario, Canada (fall ‘13)
Field Studies –
Univ CA Riverside
Olds College – in cooperation with Guelph
Utah State – future location
Rain Out Shelter at NexGen
Field vs. Greenhouse Comparison
Created bySlide36
RAIN OUT
SHELTER
(
ROS
)
Created bySlide37
A new planting establishedSlide38
Digital Image Analysis (DIA
)
Types of Analysis
Color
Cover
Turf Quality
Application
Drought
Disease
Wear
ColorSlide39
5.0
7.0
Quality Ratings - Subjective
Relatively poor correlations exist among researchers
(r < 0.68)
(Skogley and Sawyer, 1992)
(Horst et al., 1984)
6.0
Created by
U of ASlide40
5.0
7.0
Quality Ratings - Subjective
Relatively poor correlations exist among researchers
(r < 0.68)
(Skogley and Sawyer, 1992)
(Horst et al., 1984)
6.0
Created by
U of ASlide41
Light box and digital camera ease of useSlide42
Evaluations
Visual quality ratings (bi-weekly)
(1-9 with 9 = optimal turfgrass quality, 6 = acceptable turf)
Cover analysis using digital images (weekly)
(Richardson et al. 2001)
99.2% green turf cover
28.6% green turf coverSlide43
(Karcher et al., unpublished)Density Analysis
Shadow count
Shadow count
Created by
U of ASlide44
Digital Image Analysis(DIA)
Objective vs. Subjective
Utilizes 1 to 9 scale
4 Parameters with 1 Evaluation
Repeatable
Calculate overall turf quality
Requires minimal expertise
Permanent record on file
Created by
U of ASlide45
Kentucky Bluegrass DataSlide46
Water Usage Comparison by
Species
Average
08/09Slide47
Assuming a 5,000 square foot lawn, this chart shows the amount of water required to maintain 40% green cover at 90 days in Albany, Oregon. (08/09)Slide48
Mission StatementAn avenue to research and qualify turfgrasses that exhibit superior drought responses and provide education regarding water conservation.
Role of TWCASlide49
Complexity of Drought ResearchEvaporation -
Water movement from the liquid to the gaseous state. In reference to turf, it normally refers from the soil to the atmosphere.
Transpiration -
Water lost as it moves from the liquid to the gaseous state through the plant into the atmosphere.
Evapotranspiration -
The total movement of water from liquid to the gaseous state, which includes the totality of the plant and the soil
.Slide50
EarthwormsNematodesMycorrhizae fungi – phosphorous uptake
Azospirillum bacteria – brasilense amplifies effect of Arbuscular Mycorrhizae
Agrobacterium radiobacter – phosphorus solubilizing bacteria
Help from FriendsSlide51
How can you help?Saving up to 50% water to keep the green
Possible to use less fertilizer to keep the green
Possible to use less chemicals to keep the greenSlide52
Finding BalanceLawns and Water ConservationSlide53
The TWCA is committed to Water ConservationSlide54
Questions?Russ Nicholson, CPAg, CCAruss@penningtonseed.com
russ@tgwca.org
www.tgwca.orgSlide55
Natural Knit® Spreading Perennial Ryegrass vs. “Regenerating Perennial Ryegrass” trial data. Planting Date: 9/4/2010. Seeding Rate: Natural Knit: 3lbs/1000 ft.2,vs “Regenerating” ryegrass: 7lbs/1000 ft.² (advertised recommended seeding rate).
Mowing
height throughout trial: 2.5 cm.
Nitrogen application: 4 lbs/ year.
On
8/6/2012, three replications of four inch diameter turf samples were removed from each test plot using a golf cup cutter.
Live
tillers for each sample were then counted, averaged and extrapolated to live tillers per square foot of turf area. Slide56
Product
Replication 1
Replication 2
Replication 3
Average
Natural Knit®
9,631
9,699
9,527
9,619
“Regenerating” ryegrass
3,153
3,199
3,222
3,191
LIVE TILLERS PER SQ FT OF TURF AREASlide57
Planting Date: 9/4/2010. Seeding Rate: Natural Knit: 3lbs/1000 ft.2, other “regenerating” ryegrass: 7lbs/1000 ft.² (advertised recommended seeding rate). Mowing height throughout trial: 2.5 cm.
Nitrogen
application: 4 lbs/ year.
On 3/30/2011, four plugs of turf were removed from one plot each of product tested.
Each
plug was then planted into the fallow border area next to demonstration plots to allow for standardized mowing and fertilizing throughout the year.
On 8/6/2012, the diameter of each plug was measured in two directions after being trimmed around the outside edge to remove any vegetative material that was not rooted.
The diameter measurements (widest and narrowest points) from each trimmed plot were averaged and used to calculate total area in cm². Slide58
Product
Rep. #
Transfer Date
Beginning Diameter
Beginning Area cm
2
Mowing Height
N rate
Trial Measure Date
16 –month Average Diameter
Area cm²
16-month Percent Increase in Unit Area
Natural Knit®
1
3/30/2011
4.5 cm
15.9 cm
2
2.5 cm
4 lb
8/06/2012
31 cm
733 cm²
4,610%
2
3/30/2011
4.5 cm
15.9 cm
2
2.5 cm
4 lb
8/06/2012
30 cm
707 cm²
4,450%
3
3/30/2011
4.5 cm
15.9 cm
2
2.5 cm
4 lb
8/06/2012
35 cm
962 cm²
6,050%
4
3/30/2011
4.5 cm
15.9 cm
2
2.5 cm
4 lb
8/06/2012
30 cm
707 cm²
4,450%
Avg.
15.9 cm
2
31.5 cm
777 cm²
4,890%
“Regenerating”
1
3/30/2011
4.5 cm
15.9 cm
2
2.5 cm
4 lb
8/06/2012
21 cm
336 cm²
2,110%
2
3/30/2011
4.5 cm
15.9 cm
2
2.5 cm
4 lb
8/06/2012
24 cm
460 cm²
2,890%
3
3/30/2011
4.5 cm
15.9 cm
2
2.5 cm
4 lb
8/06/2012
25 cm
472 cm²
2,970%
4
3/30/2011
4.5 cm
15.9 cm
2
2.5 cm
4 lb
8/06/2012
25 cm
472 cm²
2,970%
Avg.
15.9 cm
2
23.75 cm
435 cm²
2,740%Slide59
RTF SODDED OCT. 2011 U OF TORONTO, SCARBOROUGH CAMPUS
SEPT 2012Slide60
AUGUST 2012Slide61
SerendipitySlide62
Grub assessmentSlide63Slide64Slide65
Anecdotal informationSlide66
Literature review in 2012, Bauer et al.Slide67
FindingsSlide68
My own findings: school trials:On newer soils, compacted, the newer technology(Poly coated products) outperformed the MU’s, IBDU, and organicsHave seen some great results with late fall fertilizer…on struggling turf.LCO’s: seeing more of a shift to: higher end products,
cut back on the number of apps
Load up on spring with a 70-90% SRN
Experimenting with reducing N by ½ to ¾ lb/1000
Improve turf density ahead of weedsSlide69
AcknowledgementsDr. Michael Brownbridge, Vineland Research StationPam Charbonneau, OMAFRARuss Nicholson, TWCADol Turf RestorationSports Turf InternationalDr. Chris Murray, Lakehead UniversityHagen Ledeboer, Ledeboer SeedSlide70
Ken Pavely kpavely.lawnlife@xplornet.cawww.lawnlifenaturalturfproducts.com519 939 6063THANK YOU!!!!!!!