
Bram Edens PhD Senior statistician United Nations Statistics Division Outline Overview of the SEEA Experimental Ecosystem Accounting Examples Accounting for ecosystem extent Accounting for ecosystem condition ID: 1021863
Download Presentation The PPT/PDF document "Overview of the SEEA Experimental Ecosy..." is the property of its rightful owner. Permission is granted to download and print the materials on this web site for personal, non-commercial use only, and to display it on your personal computer provided you do not modify the materials and that you retain all copyright notices contained in the materials. By downloading content from our website, you accept the terms of this agreement.


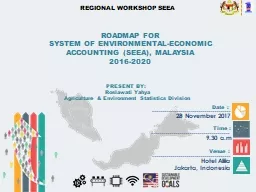


1. Overview of the SEEA Experimental Ecosystem AccountingBram Edens, PhDSenior statisticianUnited Nations Statistics Division
2. OutlineOverview of the SEEA Experimental Ecosystem AccountingExamples Accounting for ecosystem extentAccounting for ecosystem conditionAccounting for ecosystem servicesThematic accountsValuationLessons learned
3. Overview of the SEEA Experimental Ecosystem Accounting
4. System of Environmental-Economic Accounting (SEEA)The SEEA Central Framework was adopted as an international statistical standard by the UN Statistical Commission in 2012The SEEA Experimental Ecosystem Accounting complements the Central Framework and represents international efforts toward coherent ecosystem accounting
5. Natural Capital AccountingIndividual environmental assets & resources: TimberWaterSoilFishEcosystems: Biotic and abiotic elements functioning together:ForestsLakesCroplandWetlandsSEEA Central Framework (SEEA_CF) starts with economy and links to physical information on natural assets, flows and residualsSEEA Experimental Ecosystem Accounting (SEEA-EEA) starts with ecosystems and links their services to economic and other human activityTogether, they provide the foundation for measuring the relationship between the environment, and economic and other human activity
6. SEEASEEA-CF (Central Framework)AssetsPhysical flowsMonetary flowsMinerals & Energy, Land, Timber, Soil, Water, Aquatic, Other BiologicalMaterials, Energy, Water, Emissions, Effluents, WastesProtection expenditures, taxes & subsidiesSEEA Water;SEEA Energy;SEEA Agriculture, Forestry and FisheriesAdd sector detailAs above for WaterEnergyAgricultural, Forestry and FisheriesSEEA-EEA (Experimental Ecosystem Accounting)Adds spatial detail and ecosystem perspectiveExtent, Condition, Ecosystem Services, Thematic: Carbon, Water, Biodiversity
7. Ecosystem Accounting model
8. Broad steps in ecosystem accountingEcosystem thematic accounts: Land, Carbon, Water, BiodiversitySupporting information: Socio-economic conditions and activities, ecological production functionsTools: classifications, spatial units, scaling, aggregation, biophysical modellingSource: Official statistics, spatial data, remote sensing dataa. Physical Accountsb. Monetary Accounts Supporting information: SNA accounts, I-O tablesTools: Valuation techniques
9. Spatial areas for ecosystem accountingBasic spatial units (BSU): small spatial area, a geometrical construct.Ecosystem Assets (EA): individual and contiguous ecosystems. Ecosystem Types (ET): aggregation of EAs of the same type. Ecosystem Accounting Area (EAA): aggregation of EAs and ETs relevant for policy at a scale fit for a specific purpose. Overlay of units (UK)
10. Hierarchical (nested-grid) aggregationEcosystem Accounting Area (EAA)Ecosystem Types (ET)Basic Spatial Unit (BSU)CountryStateRegionStatistical AreasParcelGrid cell (e.g. 20m x 20m or 100m x 100m)
11. Examples – Accounting for ecosystem extent
12. Ecosystem extent account
13. Europe12 Ecosystem types, with further disagregationStarting point Corine land cover (CLC) data set for 2006Enhanced with additional data sets (e.g. on forest cover, water bodies and roads.)Combined with EU Nature Information System categorisation of habitat types.Provides insights into the biodiversity per ecosystem type, and allows integration of national and local classifications that varySource: European Commission, Mapping and Assessment of Ecosystems and their Services, 3rd Report – Final, March 2016.
14. EU - Ecosystem extent mapSource: European Commission, Mapping and Assessment of Ecosystems and their Services, 3rd Report – Final, March 2016.
15. Technical DatasheetLand cover and use map according to INEGI Land use and vegetation classification systemSeries III (2002)From Landsat TMScale: 1:250,000Projection: Albers Equal Area (datum ITRF92)State: Aguascalientes.Minimum Mappable Area (BSU): agriculture and induced pasture (25 ha); vegetation communities (50 ha); water bodies, islands, shorelines, etc., considered with other criterion.Extent Account in MexicoTechnical DatasheetLand cover and use map according to INEGI Land use and vegetation classification systemSeries V (2011)From Landsat ETM5Scale: 1:250,000Projection: Albers Equal Area (datum ITRF92)State: Aguascalientes.Minimum Mappable Area (BSU): agriculture and induced pasture (25 ha); vegetation communities (50 ha); water bodies, islands, shorelines, etc., considered with other criterion.Urban and associated areasPasture and natural grasslandSchrubland, bushland, heathlandPermanent crops, agriculture plantationsInland water bodiesForest tree coverMedium to large fields of irrigated croplandMedium to large fields of rain-fed croplandBarren land
16. Netherlands16
17. South African pilot study - Ecosystem extent accounts (by biome) for KZNSource: Driver, A., Nel, J.L., Smith, J., Daniels, F., Poole, C.J., Jewitt, D. & Escott, B.J. 2015. Land and ecosystem accounting in KwaZulu‐Natal, South Africa. Discussion document for Advancing SEEA Experimental Ecosystem Accounting Project, October 2015. South African National Biodiversity Institute, Pretoria.
18. Examples – Accounting for ecosystem condition
19. Ecosystem condition account (End of accounting period)
20. EuropeMAES 3rd report: 2 complementary approaches towards conditionAn indirect approach through pressures exerted on ecosystemsHabitat changeClimate changeOverexploitationInvasive alien speciesPollution and nutrient enrichmentA direct assessment of conditionbiodiversity environmental qualityEtc.Source: European Commission, Mapping and Assessment of Ecosystems and their Services, 3rd Report – Final, March 2016.
21. Europe: aggregated assessment of cropland conditionPage 21Source: European Commission, Mapping and Assessment of Ecosystems and their Services, 3rd Report – Final, March 2016.
22. An Experimental Ecosystem Account for the Great Barrier Reef Region 2015 by ABSSource: Information Paper: An Experimental Ecosystem Account for the Great Barrier Reef Region 2015 http://www.abs.gov.au/AUSSTATS/abs@.nsf/Latestproducts/4680.0.55.001Main%20Features12015?opendocument&tabname=Summary&prodno=4680.0.55.001&issue=2015&num=&view=
23. South African pilot study – National river ecosystem condition accounts
24. Accounting for ecosystem services
25.
26. Ecosystem services supply and use table
27. NetherlandsLimburg province:Biophysical model for 7 ecosystem servicesSpatially explicit!(although resolution differs)Page 27
28. Physical Supply Table (example Netherlands)Physical Supply per Hectare Ecosystem services Ecosystem Units Non-perennial plantsPerennial plantsMeadows (for grazing) HedgerowsDeciduous forestConiferous forestMixed forestHeath landFresh water wetlandsNatural grasslandPublic green spaceRiver flood basin Crops tonnes/ha/yr 26,63 8,02 - - - - - - - - - - Fodder tonnes/ha/yr 2,63 0,58 12,13 - - - - - - - - 4,74 Meat (from game) kg/ha/yr 0,21 0,19 0,22 0,28 0,22 0,24 0,28 0,29 0,22 0,26 0,19 0,17 Ground water (drinking water only) 1000m3/ha/yr 0,17 0,17 0,15 0,17 0,17 0,01 0,05 0,05 - 0,23 0,08 0,09 capture of PM10 tonnes/ha/yr 0,01 0,01 0,01 - 0,03 0,06 0,05 - - - 0,02 0,01 Carbon sequestration tonnesC/ha/yr - 0,30 0,18 0,17 1,45 1,45 1,45 0,19 0,22 0,19 0,25 0,20 Recreation (cycling) 1000s of bike trips/ha/yr 0,03 0,04 0,04 0,03 0,05 0,03 0,04 - - 0,03 0,04 0,04 Nature tourism #tourists/ha/yr 1,75 2,72 5,05 19,66 14,06 13,21 14,17 10,81 12,89 17,87 2,46 6,70 Physical supply, totals 12452122232426272831 Ecosystem servicesEcosystem UnitsNon-perennial plantsPerennial plantsMeadows (for grazing) HedgerowsDeciduous forestConiferous forestMixed forestHeath landFresh water wetlandsNatural grasslandPublic green spaceRiver flood basinTotals extent (ha) 53.600 8.100 27.100 2.900 11.400 7.100 10.400 2.100 900 3.100 4.800 14.100 220.900 Crops tonnes/yr 1.427.300 65.000 - - - - - - - - - - 1.492.400 Fodder tonnes/yr 140.800 4.700 328.700 - - - - - - - - 66.900 541.100 Meat (from game) kg/yr 11.500 1.500 5.900 800 2.500 1.700 2.900 600 200 800 900 2.400 36.800 Ground water (drinking water only) in 1000 m3/yr 9.000 1.400 4.200 500 1.900 100 500 100 - 700 400 1.300 27.000 capture of PM10 tonnes/yr 400 100 200 - 300 400 500 - - - 100 100 2.300 Carbon sequestration tonnes C/yr - 2.400 4.900 500 16.500 10.300 15.100 400 200 600 1.200 2.800 59.000 Recreation (cycling) 1000s of bike trips/yr 1.800 300 1.000 100 600 200 400 - - 100 200 600 9.100 Nature tourism # tourists/yr 94.000 22.000 136.800 57.000 160.300 93.800 147.400 22.700 11.600 55.400 11.800 94.500 974.300
29. Valuation of ES – South Africa10 individual services were modelled and valuedUsing a range of techniques, but always local/national dataPage 29Source: Turpie et al., 2017
30. SA - continuedPage 30Source: Turpie et al., 2017
31. Thematic accounts
32. Thematic accountsStandalone accounts on topics of interest in their own right Direct relevance in the measurement of ecosystems and in assessing policy responses. Thematic accounts include accounts for land, carbon, water and biodiversity.Example: Carbon Accounting in Australia Source:https://coombs-forum.crawford.anu.edu.au/publication/hc-coombs-policy-forum/4708/carbon-accounting-australia
33. Australia: carbon accountPage 33Source: Australian National University, Experimental Ecosystem Accounts for theCentral Highlands of Victoria, 2016.
34. Valuation
35. ValuationValuation is always fit for purpose, different valuation notions existWelfare based (e.g. cost-benefit analysis)Exchange values (national accounts, exclude consumer surplus)Why? Nat accounts is transaction based system, supply = useWelfare based valuation result in far bigger numbers! (e.g. Costanza et al 1997, in the order of GDP) Why?benefit transfer may results in biases (derived from WTP in wealthier countries + for more productive systemsIncludes consumer surplusAssumes there is demand for provided servicesEcosystem accounting does not rule out welfare based valuation, but need to be careful when integrating.Exchange values may be derived from welfare based valuationsPage 35
36. Lessons learned
37. Essential to take a gradual approach (from local/municipal to national) and manage expectations, although some accounts (e.g land) can be done at national level.Important to clarify the role of the national statistics office- > integration existing data sets-> what sets it apart from other approaches: links with economic statisticsCrucial to engage with policy makers right from the startAt national level (e.g. fiscal policy, land use planning and monitoring environmental regulations) and at regional and municipal level (e.g. land use planning/zoning, monitoring of regulations) Imperative to set up win-win institutional partnership with statistics, policy and science interface with joint capacity buildingMultidisciplinary undertaking (statisticians/accountants, academics/economists and ecologists, policy makers)Essential to develop communication strategy with users on mainstreaming natural capital accountingLessons learned from NCA project
38. Links to policyAccounst are not Source: “Better Policy through Natural Capital Accounting: Stocktaking and Ways Forward”
39.