
SedLine and BIS during General Anesthesia Data Collection and Analysis Linda L Vo AB Penelope KimLim BS James H Jones MD Richard L Applegate II MD Neal W Fleming MD PhD Department of Anesthesiology and Pain Medicine ID: 909771
Download Presentation The PPT/PDF document "Comparison of Depth of Sedation Performa..." is the property of its rightful owner. Permission is granted to download and print the materials on this web site for personal, non-commercial use only, and to display it on your personal computer provided you do not modify the materials and that you retain all copyright notices contained in the materials. By downloading content from our website, you accept the terms of this agreement.


Slide1
Comparison of Depth of Sedation Performance between
SedLine and BIS during General Anesthesia: Data Collection and Analysis
Linda L. Vo AB, Penelope Kim-Lim BS, James H. Jones MD, Richard L. Applegate II MD, Neal W. Fleming MD PhD, Department of Anesthesiology and Pain Medicine, University of California, Davis, Sacramento, CA
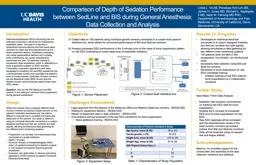
Introduction
Electroencephalogram (EEG) monitoring has the potential to become a robust tool to characterize anesthetic depth. The goal is to develop a streamlined neuromonitoring tool that would allow clinicians to make real-time assessments and to titrate anesthetic delivery. Anesthetic overdosing can cause postoperative delirium and mortality, while underdosing can cause intraoperative awareness and pain. Of particular interest is excessively deep anesthesia, which is reflected by a burst suppression pattern on EEG monitors. Fortunately, proprietary algorithms have been developed to transform the raw EEG waveforms into a dimensionless number that quantifies the patient’s level of consciousness. Examples of these monitors are the Bispectral Index (BIS) monitor and the Sedline monitor which produces patient state index (PSI) values. Question: How do the PSI (SedLine) and BIS perform in the setting of imminent burst suppression during general anesthesia?
While prior studies have compared different brain function monitors by placing multiple sensors on the patients’ foreheads simultaneously, this data is difficult to interpret due to crowded and inaccurate placement of the sensors. Our study is distinct in using an individual electrode connected to a custom designed interface box that can combine and split signals, allowing simultaneous data gathering for two different brain monitoring systems. Prospective, non-blinded, non-randomized study conducted at a single institutionAged ≥ 18 yearsAmerican Society of Anesthesiologists (ASA) class I-III patients presenting for elective surgical or non-surgical procedures requiring general anesthesia Exclusion: Any deformities or devices preventing application of EEG sensors to patient’s forehead; Developmental delay
Design
Objectives
Collect data on 100 patients using individual generic sensors connected to a custom-built passive interface box, which allows for concurrent performance of BIS and SedLine monitorsAnalyze processed EEG performance in the 5 minutes prior to the onset of burst suppression pattern on raw EEG (indicating an overly deep level of anesthetic sedation).
Results (In Progress)
Developed an individual electrode connected to a custom designed interface box that can combine and split signals, allowing simultaneous data gathering for two different brain monitoring systems. 100 patients were enrolled in this prospective, non-blinded, non-randomized studySuccessful data collection using BIS and SedLine monitorsReviewers of burst suppression on raw EEG completed trainingInitiated marking of raw EEG data for burst suppression by 4 independent reviewers
Next Steps: Finish Data AnalysisEstablish inter-reviewer concordance on marking raw EEG data for burst suppressionAnalyze the 5 minutes of processed EEG prior to burst suppression on raw EEGRaw EEG readings will be correlated with the dimensionless values of the brain function monitors (processed indices from BIS and SedLine monitors)Data will be analyzed using chi-square test and kappa statistic
Further Study
Masimo, Inc provided support for the construction and assembly of the data collection hardware and software.
Acknowledgements
Challenges Encountered
Legal approval from the lawyers of the Medtronic (BIS) and Masimo (
SedLine
) monitors - RESOLVED
Waiting for equipment delivery – RESOLVEDRepair of equipment used in data collection – RESOLVEDConcordance among screeners of the raw EEG waveforms for burst suppressionNeed additional training - RESOLVED
Figure 1: Sensor Placement
Figure 2: Custom-built interface box
Figure 3: Equipment Setup
Table 1: Characteristics of Study Population