
Supplemental Digital Content 2 Supplemental Digital Content 3 Supplemental Digital Content 4 Supplemental Digital Content 5 Supplemental Digital Content 6 Supplemental Digital Content 7 Supplemental Digital Content 8 ID: 1048113
Download Presentation The PPT/PDF document "Supplemental Digital Content 1" is the property of its rightful owner. Permission is granted to download and print the materials on this web site for personal, non-commercial use only, and to display it on your personal computer provided you do not modify the materials and that you retain all copyright notices contained in the materials. By downloading content from our website, you accept the terms of this agreement.


1. Supplemental Digital Content 1Supplemental Digital Content 2Supplemental Digital Content 3Supplemental Digital Content 4
2. Supplemental Digital Content 5Supplemental Digital Content 6Supplemental Digital Content 7Supplemental Digital Content 8
3. Supplemental Digital Content 9Supplemental Digital Content 10Supplemental Digital Content 11
4. Supplemental Digital Content 12Supplemental Digital Content 13Supplemental Digital Content 14
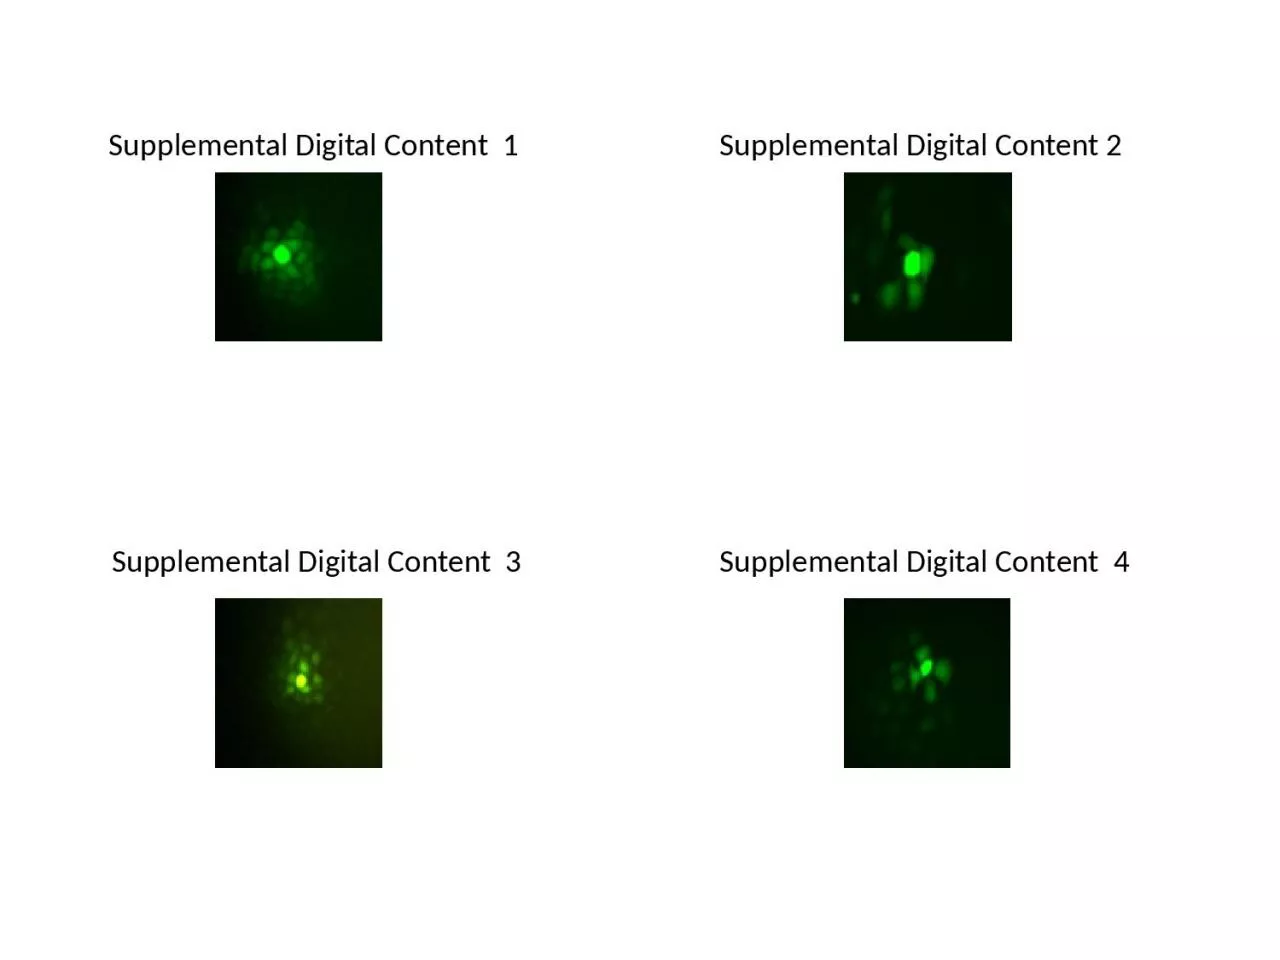
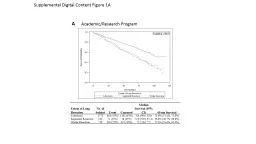
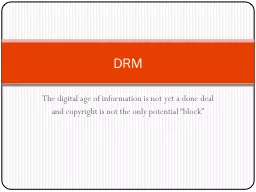
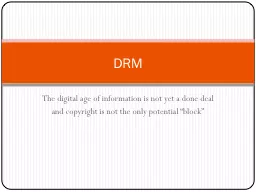
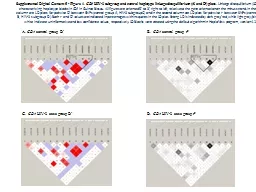
5. SDC 1-10: Illustrates the GJ function altered in response to exposure to various LPS concentrations. The parachute dye-coupling assay was performed on high-density cells that were (SDC 1) untreated (control group) or exposed to LPS at (SDC 2) 10 ng/mL, (SDC 3) 50 ng/mL, (SDC 4) 100 ng/mL, (SDC 5) 500 ng/mL, and (SDC 6) 1000 ng/mL, (SDC 7) retinoic acid at 10 mol, (SDC 8) oleamide at 25µM, (SDC 9) oleamide at 25µM + LPS at 100 ng/mL, and (SDC 10) retinoic acid at 10 µM + LPS at 100ng/mL. Dye transmission was observed by fluorescent microscope, 200× magnification SDC 11: Illustrates that LPS inhibited the expression of Connexin43 in NRK52E cells. Cells at high density were either (a) untreated (control group) or treated with LPS at (b) 10 ng/mL or (c) 100 ng/mL and Cx43 protein expression detected by Western blot. SDC 12-14: Illustrates the LPS-induced changes in pathobiological features of NRK52E cells. Electron microscopy analysis of (a) untreated NRK52E cells appeared as regularly-shaped globular structures with normal polarity, plentiful organelles, and integrated cell membranes having plenty of microvilli structures on the surface. (b) NRK52E cells treated with 100 ng/mL LPS appeared as irregularly-shaped globular structures with less integrated cell membrane, fewer organelles, microvilli, and connective structures, such as gap junctions. (c) NRK52E cells treated with 1000 ng/mL LPS showed cytoplasmic and karyoplasmic swelling and a remarkable absence of microvilli.Supplemental Digital Content Figure Legends