
Learning Objectives Explain how correlation differs from causation in regression models Learn the three sources of the endogeneity problem and how they cause assumption CR5 to fail Learn about some solutions to the ID: 1027611
Download Presentation The PPT/PDF document "Chapter 11 Identifying Causation" is the property of its rightful owner. Permission is granted to download and print the materials on this web site for personal, non-commercial use only, and to display it on your personal computer provided you do not modify the materials and that you retain all copyright notices contained in the materials. By downloading content from our website, you accept the terms of this agreement.


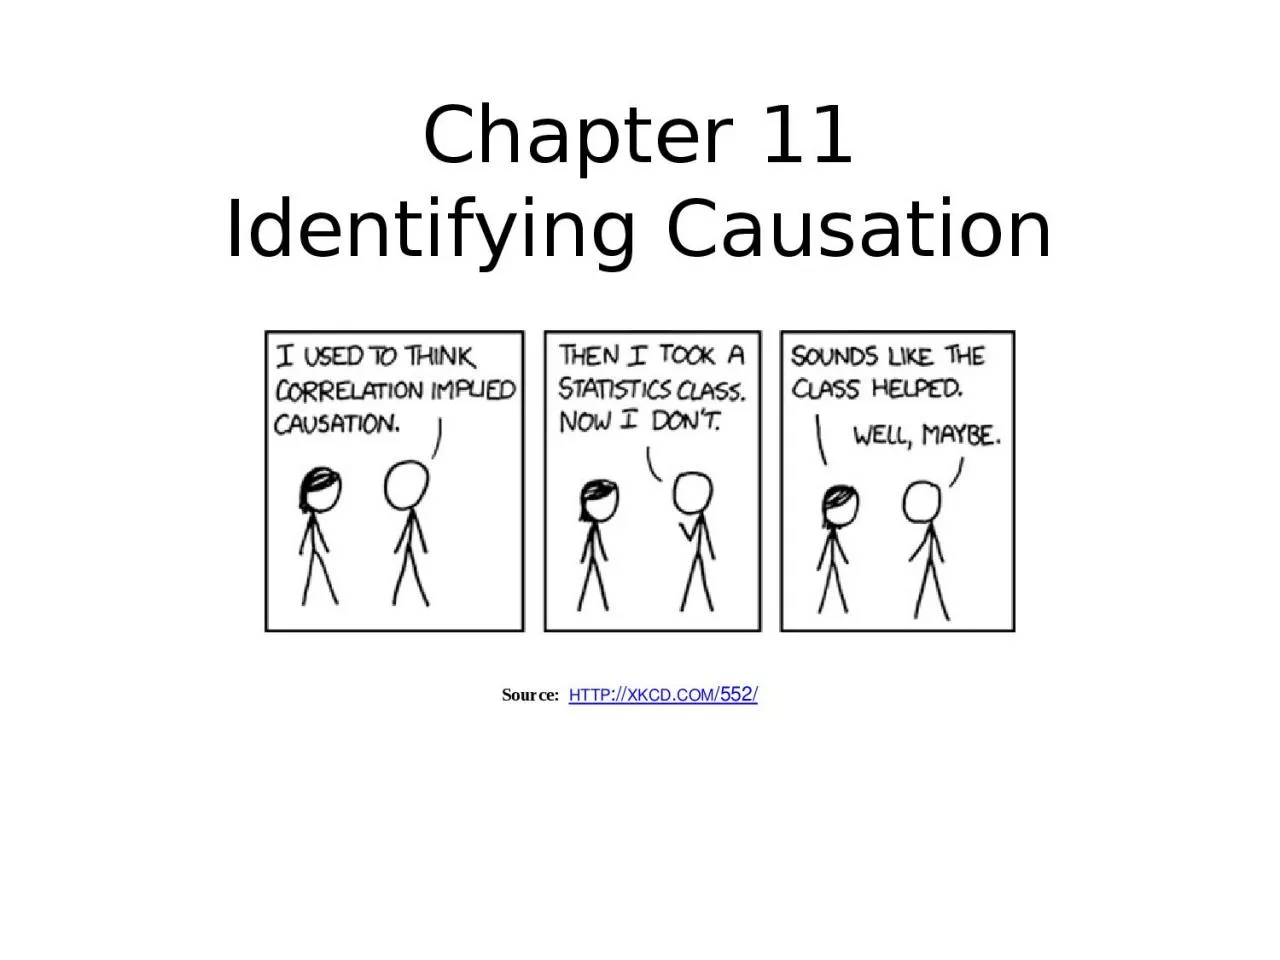
1. Chapter 11Identifying Causation
2. Learning ObjectivesExplain how correlation differs from causation in regression modelsLearn the three sources of the endogeneity problem and how they cause assumption CR5 to failLearn about some solutions to the endogeneity problem
3. Why CausalityDoes joining a union or getting more education raise workers’ earnings?Do immigrants reduce wages and employment for native workers?Do good roads make economies grow faster?Does economic growth make civil wars less likely?Do smaller class sizes help kids learn more?Do welfare payments to poor women make their kids better educated and well-fed?What makes some nations rich and others poor?
4. How to tell correlation from causationCorrelation means that if you tell me X, I can make a prediction of Y. The population doesn’t changeCausation means that if you change X to a different value, then I expect Y to change.The population changes because there was a “treatment”
5. A New AssumptionCR5: The values of the explanatory variable are exogenous, or given (there are no errors in the X-direction). If CR5 holds, then β1 is the causal effect of X on YIf CR5 fails, then we have an endogeneity problem
6. Three Sources of “Endogeneity”Measurement error in X. X and Y determined jointly.Omitted X variable.Some economists use the word “endogeneity” only for jointly determined variables, but modern econometrics uses the word for any of the three settings.
7. 1. Measurement ErrorRegression you want: You observe X with error: Regression you run: What’s in the error? (Hint: substitute for Xi in the original equation)
8. Bias from Measurement ErrorSo the error now has the original error, plus the error in X times 1OLS estimate of 1 usually biased towards zeroExample: Janitor randomly messes up your experiment in the night
9. 2. X and Y determined jointlySupply and demandAre you estimating the supply equation or the demand equation?Solve for Pi and you’ll find BOTH errors in it!
10. 3. Endogeneity (Omitted Variables)Data: random sample of 30-39 year olds in the United StatesXi =1 if i has a college degree and Xi = 0 otherwiseYi = log earnings last yearThis means that college graduates earned 25% more than non-graduatesIf the non-graduates had gone to college, would they have earned 25% more?
11. Endogeneity = Omitted VariablesRegression you run: But people with higher ability get more schooling: (“Model” of schooling) X1i = α0 + α1Z2i + uiRegression you should run: Coefficients and β1 are the same only if X1 and Z2 are uncorrelated or β2 = 0 What’s the idealized “thought experiment?”SchoolingAbilityYi = 0 + 1X1i +2Z2i + iYi = 0* + 1*X1i + i*Earnings
12. The Magic of Fixed Effects Models with Panel DataMultiple observations on same people over time (say, 2 years: t = 1, 2):Changes in earnings:So the missing ability variable disappears…PROBLEM SOLVEDBut people’s schooling has to change over timeYit = 0 + 1X1it +2Z2i + itAbility doesn’t change over time (SO no “t” subscript)Yi2 – Yi1 = (0 - 0) + 1(X1i2 - X1i1) +2(Z1i - Z1i) + i2 - i1Yi2 – Yi1 = 1(X1i2 - X1i1) + i*
13. What We LearnedCorrelation means that if you tell me X, I can make a prediction of Y.Causation means that if you change X to a different value, then I expect Y to change.The three sources of “endogeneity” are (i) measurement error, (ii) simultaneity, and (iii) omitted variables.Measurement error in X variables usually (but not always) leads to coefficient estimates that are smaller than they should be (biased toward zero). Proxy variables can help reduce measurement error bias.Simultaneity means that X and Y cause each other. Fixed-effects estimation can mitigate the omitted variables problem in panel data (but only for time-invariant omitted variables)