
Jiancheng Wu 1 2 Shaopeng Wang 1 2 Youhua Wang 1 2 Chengcheng Liu 1 2 1 State Key Laboratory of Reliability and Intelligence of Electrical Equipment Hebei University of Technology ID: 1002542
Download Presentation The PPT/PDF document "Sensitivity Analysis of Design Parameter..." is the property of its rightful owner. Permission is granted to download and print the materials on this web site for personal, non-commercial use only, and to display it on your personal computer provided you do not modify the materials and that you retain all copyright notices contained in the materials. By downloading content from our website, you accept the terms of this agreement.


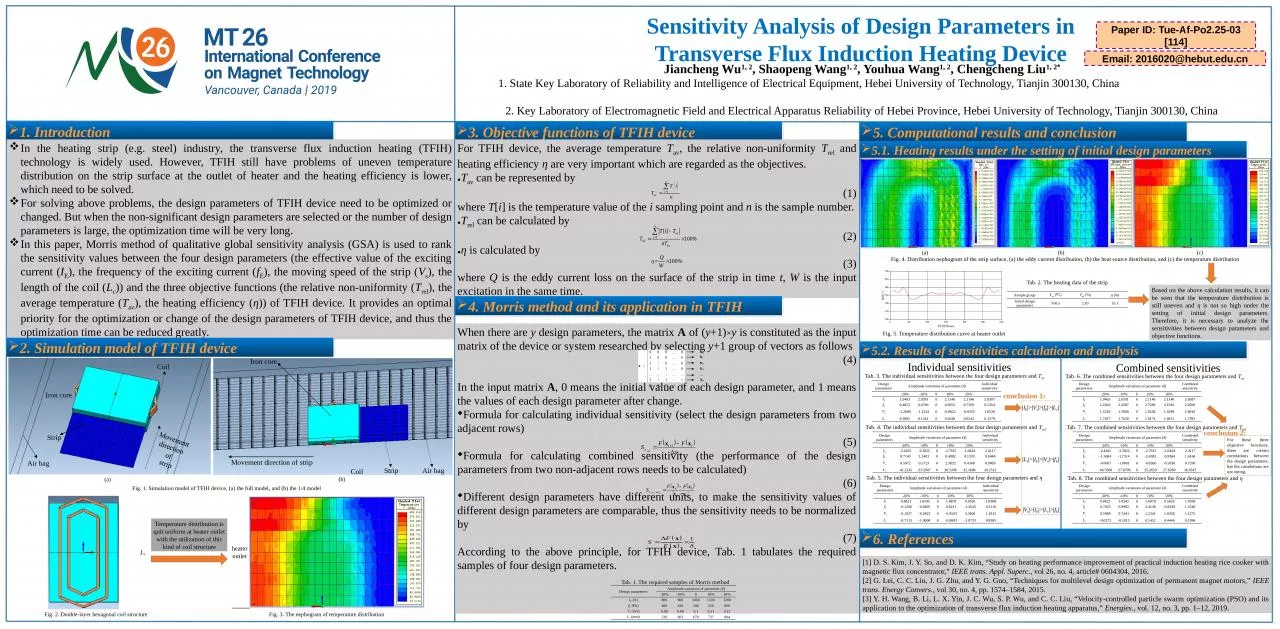
1. Sensitivity Analysis of Design Parameters in Transverse Flux Induction Heating DeviceJiancheng Wu1, 2, Shaopeng Wang1, 2, Youhua Wang1, 2, Chengcheng Liu1, 2*1. State Key Laboratory of Reliability and Intelligence of Electrical Equipment, Hebei University of Technology, Tianjin 300130, China 2. Key Laboratory of Electromagnetic Field and Electrical Apparatus Reliability of Hebei Province, Hebei University of Technology, Tianjin 300130, China1. IntroductionIn the heating strip (e.g. steel) industry, the transverse flux induction heating (TFIH) technology is widely used. However, TFIH still have problems of uneven temperature distribution on the strip surface at the outlet of heater and the heating efficiency is lower, which need to be solved. For solving above problems, the design parameters of TFIH device need to be optimized or changed. But when the non-significant design parameters are selected or the number of design parameters is large, the optimization time will be very long.In this paper, Morris method of qualitative global sensitivity analysis (GSA) is used to rank the sensitivity values between the four design parameters (the effective value of the exciting current (IE), the frequency of the exciting current (fE), the moving speed of the strip (Vs), the length of the coil (Lc)) and the three objective functions (the relative non-uniformity (Trel), the average temperature (Tav), the heating efficiency (η)) of TFIH device. It provides an optimal priority for the optimization or change of the design parameters of TFIH device, and thus the optimization time can be reduced greatly.2. Simulation model of TFIH device(a)(b)Fig. 1. Simulation model of TFIH device, (a) the full model, and (b) the 1/4 modelFig. 2. Double-layer hexagonal coil structure3. Objective functions of TFIH deviceFig. 3. The nephogram of temperature distributionTemperature distribution is quit uniform at heater outletwith the utilization of this kind of coil structureFor TFIH device, the average temperature Tav, the relative non-uniformity Trel and heating efficiency η are very important which are regarded as the objectives. ●Tav can be represented by (1)where T[i] is the temperature value of the i sampling point and n is the sample number.●Trel can be calculated by (2)●η is calculated by (3)where Q is the eddy current loss on the surface of the strip in time t, W is the input excitation in the same time.4. Morris method and its application in TFIHWhen there are y design parameters, the matrix A of (y+1)×y is constituted as the input matrix of the device or system researched by selecting y+1 group of vectors as follows(4)In the input matrix A, 0 means the initial value of each design parameter, and 1 means the values of each design parameter after change.Formula for calculating individual sensitivity (select the design parameters from two adjacent rows)(5)Formula for calculating combined sensitivity (the performance of the design parameters from two non-adjacent rows needs to be calculated)(6)Different design parameters have different units, to make the sensitivity values of different design parameters are comparable, thus the sensitivity needs to be normalized by(7)According to the above principle, for TFIH device, Tab. 1 tabulates the required samples of four design parameters.Tab. 1. The required samples of Morris methodDesign parametersAmplitude variations of parameter (δ)-20%-10%010%20%IE (A)800900100011001200fE (Hz)400450500550600Vs (m/s)0.080.090.10.110.12Lc (mm)5366036707378045. Computational results and conclusion(a)(b)(c)Fig. 4. Distribution nephogram of the strip surface, (a) the eddy current distribution, (b) the heat source distribution, and (c) the temperature distributionFig. 5. Temperature distribution curve at heater outlet Tab. 2. The heating data of the stripSample groupTav (℃)Trel (%)η (%)Initial design parameters558.52.8355.1Based on the above calculation results, it can be seen that the temperature distribution is still uneven and η is not so high under the setting of initial design parameters. Therefore, it is necessary to analyze the sensitivities between design parameters and objective functions.Tab. 3. The individual sensitivities between the four design parameters and TavDesign parametersAmplitude variations of parameter (δ)Individual sensitivity -20%-10%010%20% IE1.94632.059102.11462.11462.0587fE0.48520.478000.50550.75690.5564Vs-1.2890-1.12240-0.8652-0.93551.0530Lc0.30850.134100.16480.02420.1579 |IE|>|Vs|>|fE|>|Lc|Tab. 4. The individual sensitivities between the four design parameters and Trel|Lc|>|IE|>|Vs|>|fE|Tab. 5. The individual sensitivities between the four design parameters and η|Vs|>|IE|>|Lc|>|fE|Tab. 6. The combined sensitivities between the four design parameters and TavTab. 7. The combined sensitivities between the four design parameters and TrelTab. 8. The combined sensitivities between the four design parameters and ηFor these three objective functions, there are certain correlations between the design parameters, but the correlations are not strong.5.1. Heating results under the setting of initial design parameters5.2. Results of sensitivities calculation and analysisIndividual sensitivities6. References[1] D. S. Kim, J. Y. So, and D. K. Kim, “Study on heating performance improvement of practical induction heating rice cooker with magnetic flux concentrator,” IEEE trans. Appl. Superc., vol 26, no. 4, article# 0604304, 2016.[2] G. Lei, C. C. Liu, J. G. Zhu, and Y. G. Guo, “Techniques for multilevel design optimization of permanent magnet motors,” IEEE trans. Energy Convers., vol 30, no. 4, pp. 1574–1584, 2015.[3] Y. H. Wang, B. Li, L. X. Yin, J. C. Wu, S. P. Wu, and C. C. Liu, “Velocity-controlled particle swarm optimization (PSO) and its application to the optimization of transverse flux induction heating apparatus,” Energies., vol. 12, no. 3, pp. 1–12, 2019.Combined sensitivitiesDesign parametersAmplitude variations of parameter (δ)Individual sensitivity -20%-10%010%20% IE-2.4205-3.39220-2.7915-1.04242.4117fE0.71431.240100.49020.13390.6446Vs0.59720.572302.38320.43480.9969Lc-41.2145-33.2907038.339632.160036.2512Design parametersAmplitude variations of parameter (δ)Individual sensitivity -20%-10%010%20% IE0.86211.034501.68780.56261.0368fE-0.1206-0.040500.6211-1.26430.5116Vs-0.1927-0.28230-0.95033.34061.1915Lc-0.7113-1.00000-0.9693-1.07330.9385Design parametersAmplitude variations of parameter (δ)Combined sensitivity -20%-10%010%20% IE1.94632.059102.11462.11462.0587fE2.24262.438702.72693.19162.6500Vs1.53181.590001.62581.65891.6016Lc1.74571.702801.81741.69111.7393Design parametersAmplitude variations of parameter (δ)Combined sensitivity -20%-10%010%20% IE-2.4205-3.39220-2.7915-1.04242.4117fE-1.3604-1.73140-2.4382-0.93641.6166Vs-0.6007-1.06010-0.6360-0.58300.7200Lc-46.7668-37.8799035.265027.826936.9347Design parametersAmplitude variations of parameter (δ)Combined sensitivity -20%-10%010%20% IE0.86211.034501.68780.56261.0368fE0.76230.998202.4138-0.84391.2546Vs0.59890.744101.23411.93281.1275Lc-0.0272-0.181500.14520.44460.1996Paper ID: Tue-Af-Po2.25-03 [114]Email: 2016020@hebut.edu.cnconclusion 1:conclusion 2: