PPT-Independent Study:
Author : sherrill-nordquist | Published Date : 2017-05-06
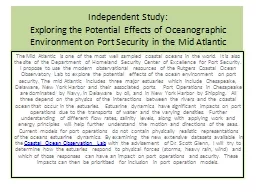
Exploring the Potential Effects of Oceanographic Environment on Port Security in the Mid Atlantic The Mid Atlantic is one of the most well sampled coastal oceans
Presentation Embed Code
Download Presentation
Download Presentation The PPT/PDF document "Independent Study:" is the property of its rightful owner. Permission is granted to download and print the materials on this website for personal, non-commercial use only, and to display it on your personal computer provided you do not modify the materials and that you retain all copyright notices contained in the materials. By downloading content from our website, you accept the terms of this agreement.
Independent Study:: Transcript
Download Rules Of Document
"Independent Study:"The content belongs to its owner. You may download and print it for personal use, without modification, and keep all copyright notices. By downloading, you agree to these terms.
Related Documents