
Mean 4 Median 4 Std dev 224 CH 2 If the mean is greater than the median the distribution is skewed right If the mean is less than the median the distribution is skewed ID: 808742
Download The PPT/PDF document "STA 2023 CH. 2 Find the mean, median, ..." is the property of its rightful owner. Permission is granted to download and print the materials on this web site for personal, non-commercial use only, and to display it on your personal computer provided you do not modify the materials and that you retain all copyright notices contained in the materials. By downloading content from our website, you accept the terms of this agreement.


Slide1
STA 2023
Slide2
Slide3CH. 2
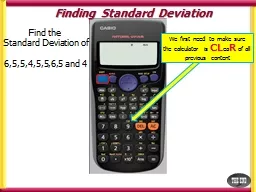
Find the mean, median, and standard deviation of the data set { 5, 4, 7, 3, 1 }
Mean =
4
Median=
4
Std. dev.= 2.24
Slide4CH. 2
If the mean is
greater
than the median, the distribution is skewed
right
.
If the mean is
less
than the median, the distribution is skewed
left
.
If the mean is
equal
to the median, the distribution is
not skewed
.
Slide5CH. 2
A football team scores an average of 20 points a game with a standard deviation of 3 points.
T
he distribution is approximately normal. (a) What is the probability that the team scores between 17 and 23 points? (b) Between 14 and 23 points?
a.)
About
68%
b.)
About
81.5%
Slide6CH.2
The mean of a data set is 8 with a std. dev. of 1.5. If we don’t know the shape of the distribution, what is the probability between 6.5 and 9.5? Between 5 and 11?
Chebychev
: 1- 1/k
2
Where k is the number of St.
Devs
away from the mean.
Answer=
At least
0%
Answer=
At least
75%
Slide7CH. 3
What is the difference between multiplicative, combination, and permutation?
Multiplicative: Just looking to find how many possible outcomes per trial “x” from “n” number of trials. (X)
n
Combination: Number of ways we can select n items from N items without replacement.
Use when
order doesn’t matter
.
Slide8CH. 3
Permutation: Number of ways we can put n things out N in order.
Use when order matters!
Slide9CH. 3
How many ways can we choose 5 flavors of ice cream out of 21? How many ways can we put 3 flavors in order from first to third?
Answer:
Answer:
Slide10CH. 3
Currently Whipping
Currently Nene
Total
Done Whipping
3
15
18
Done
with
Nene
7
8
15
Total
10
23
33
Find Probability of these dance combinations according to the table: (a) Done whipping or currently Nene; (b) Finished Nene and currently Nene
Slide11CH. 3
Answer (a):
Answer (b):
Slide12CH. 3
If P(A)= 0.3, P(B)= 0.5, and P(A U B)= 0.65:
(a) what is P(A
∩
B)?
(b) Are A and B independent?
Slide13CH. 3
a.)
b.)
If independent,
Since
, A and B are
independent
Slide14CH. 4
(a) Find μ and σ
(b) Find P(x=5); P(x≤ 7); P(x > 2)
a.) μ= 4.1; σ= 1.67
b.) P(x=5)= 0.35; P(x≤ 7)= 1; P(x > 2)= 0.8
X
2
3
5
7
P(x)
0.20
0.30
0.35
0.15
Slide15CH. 4
You play roulette and place a $10 bet on red.
There are 18 red spaces, 18 black spaces, and 2 green spaces.
What is the expected result of your bet?
Probability of red (success)= 18/38
Probability of black (failure) = 18/38
Probability of green (failure) = 2/38
Success= 18/38 Failure= 20/38
Slide16CH. 4
(gain) x P(success) – (lose) x P(failure)
(10) X (18/38) – (10) x (20/38)
4.74 – 5.26 =
-$0.52
We should expect to lose money.
Slide17CH. 4
How do you know when to use binomial or Poisson?
Binomial: 2 possible outcomes (success and fail).
Poisson: Use when dealing with time/rate.
where
and x=number of successes we are interested in.
Slide18CH. 5
The average semester grade in STA 2023 is 70 with a standard deviation of 3.5. What is the probability that the average grade this semester will be greater than 76? Less than 72? Equal to 68?
Answer: 0.50 – 0.4564 = 0.0436
Answer
:
0.50 + 0.2157 = 0.7157
Answer: Cannot be equal to a number because these are continuous random variables. P = 0.
Slide19CH. 5
The average grade in STA 2023 is 70 with a standard deviation of
6
. If you want to be in the 98
th
percentile, what is the minimum score you must obtain?
Answer: 85.3
Slide20CH. 6
We want to find out how many times Detroit Lions fans cry themselves to sleep per week. We randomly sample 40 Lions fans from a population with a mean of 5 and std. dev. of 1.5. What is the probability that the mean of our sample will be more than 4.5?
L
ess than 4?
P= 0.50 + 0.4826 = 0.9826
P= Our Z-score is -4.22. This is too negative to look up, so we assume P<-4.22 = 0
Slide21CH. 7
At a set level of confidence, does our confidence interval increase or decrease as sample size increases?
Answer: Decreases
Slide22CH. 7
At a set sample size, what happens to our confidence interval as our level of confidence increases?
Answer: Increases
Slide23CH. 7
If constructing interval for
When n
When n
If finding n:
Slide24CH. 7
If constructing interval for P:
When n
When n
If finding n:
Note: When finding n, if
is unknown use 0.50.
Slide25CH. 7
Construct a C.I. at 95% confidence with a sample mean of 70 and a std. dev. of 20 when n=49. When n=25
Answer = 70
5.6 = (64.4, 75.6)
Answer = 70
Slide26CH. 7
30 pre-med students out of a sample of 40 say they have stress-induced acid reflux. Construct a 90% confidence interval to estimate the true proportion of pre-med students with stress-induced acid reflux.
Answer = 0.75
0.11 = (0.64, 0.86)
Slide27CH. 7
Determine the sample size needed to construct a 99% C.I. to estimate the true proportion to within 0.10 with
= 0.60. What if we didn’t know
Slide28CH. 8
It is believed that the average grade on STA 2023 final exams is 70. A study of 36 students was run, and the results yielded a mean of 76 with a standard deviation of 18. Is this enough evidence to claim that the true mean score is greater than 70 at
What is the level of significance?
Answer: Yes, our test statistic lies in the RR;
P=0.0228.
Slide29CH. 8
It is estimated that 70 percent of college students enjoy going to Chipotle. A sample was conducted where 23 out of 29 students sampled said that they enjoy Chipotle. Is this
e
nough evidence to say that more than 70 percent like Chipotle at
.
Answer: No, our T.S. of 1.09 does not fall in the RR t>1.28.
Slide30CH. 9
A study was run to see if there is a difference in mean test scores between students who play piano, and students who do not. 20 piano students and 18 non-piano students were studied. The mean of the piano group was 85 with
s.d.
of 8, and the mean of the non-piano group was 81 with
s.d.
equal to 7.5. Is this enough evidence to conclude that there is a difference at
Construct a 95% C.I.
Slide31CH. 9
T.S.
Answer: Test stat is not in RR, do not reject.
Answer:
Slide32Hopefully you now feel less like this
Slide33And more like Sheldon
https://www.youtube.com/watch?v=ay3dSzkfswE