
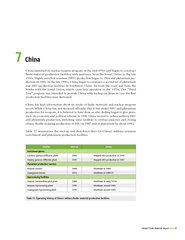
China Sectors Quarterly Report Overview Sector Ticker Firms Total Market Cap Billions USD Weight in MSCI China A Shares SOE MSCI China Index MXCN 711 12152 115 ID: 1017530
Download Presentation The PPT/PDF document "Q2 2020 China Sector Report" is the property of its rightful owner. Permission is granted to download and print the materials on this web site for personal, non-commercial use only, and to display it on your personal computer provided you do not modify the materials and that you retain all copyright notices contained in the materials. By downloading content from our website, you accept the terms of this agreement.


1. Q2 2020 China Sector Report
2. China Sectors – Quarterly Report: OverviewSector (Ticker)# FirmsTotal Market Cap (Billions USD)% Weight in MSCI ChinaA Shares %SOE %MSCI China Index (MXCN)711$12,152-11.511.9Communication Services38$1,23922.834.33.5Consumer Discretionary68$1,80131.47.91.3Consumer Staples52$1,0584.048.07.0Energy24$5582.142.734.0Financials97$3,74715.818.539.3Health Care81$9035.626.34.2Industrials114$1,0244.828.822.4Information Technology101$1,0175.135.74.2Materials66$5261.947.737.0Real Estate50$5134.610.93.7Utilities26$2352.031.842.2Source: Bloomberg as of Jun 30, 2020Market Cap calculations based on MSCI China Index. All else calculated on sector index level.SOE: State Owned Enterprise
3. Source: Bloomberg as of Jun 30, 2020China Sectors – Quarterly Report: Risk and Return
4. Performance shown is past performance, based on the NAVs of the underlying sector ETFs and does not guarantee future results. The investment return and principal value of an investment will fluctuate so that an investor’s shares, when sold, may be worth more or less than their original cost and current performance may be lower or higher than the performance quoted. To see standard performance for each of the funds, please see next slide.Sector (ETF Ticker)1 month return (%)3 month return (%)MSCI China Index (MXCN)8.9815.29Communication Services (CHIC)11.5416.48Consumer Discretionary (CHIQ)12.1128.68Consumer Staples (CHIS)8.0718.69Energy (CHIE)2.57-1.86Financials (CHIX)3.200.52Health Care (CHIH)17.3536.25Industrials (CHII)2.415.57Information Technology (CHIK)23.5932.97Materials (CHIM)3.597.06Real Estate (CHIR)5.854.21Utilities (CHIU)-0.811.611 mo. Return (%)3 mo. Return (%)Source: Bloomberg as of Jun 30, 2020China Sectors – Quarterly Report: Performance
5. The performance data quoted represents past performance. Past performance does not guarantee future results. The investment return and principal value of an investment will fluctuate so that an investor's shares, when sold or redeemed, may be worth more or less than their original cost and current performance may be lower or higher than the performance quoted. Returns for periods greater than one year are annualized. For performance data current to the most recent month end, please call 1-888-493-8631, or visit www.globalxetfs.com.Standard PerformanceAll data as of 6/30/2020Fund InformationPerformanceExpense Ratio 1 Year3 Year5 YearAnnualized since Fund InceptionGlobal X MSCI China Communication Services ETF (CHIC)0.66%NAV6.04%1.31%0.76%6.25%Market Price4.27%1.22%0.76%6.21%NU722121 Index6.73%2.05%1.69%7.11%Global X MSCI China Energy ETF (CHIE)0.66%NAV-26.51%-5.97%-7.56%-3.53%Market Price-26.66%-5.88%-7.46%-3.53%NU722195 Index-25.85%-5.10%-6.78%-2.72%Global X MSCI China Health Care ETF (CHIH)0.66%NAV52.01%--33.34%Market Price53.47%--34.21%NU722071 Index53.26%--34.40%Global X MSCI China Information Technology ETF (CHIK)0.66%NAV48.33%--37.02%Market Price49.18%--37.04%NU722094 Index49.44%--37.93%Global X MSCI China Industrials ETF (CHII)0.66%NAV-6.32%-1.28%-3.59%-0.39%Market Price-6.23%-1.20%-3.64%-0.46%NU721886 Index-5.61%-1.85%-3.73%0.08%Global X MSCI China Materials ETF (CHIM)0.66%NAV-4.14%-0.90%-0.43%-4.33%Market Price-4.15%-1.22%-0.46%-4.42%NU721934 Index-3.35%-0.16%-1.08%-3.98%Global X MSCI China Consumer Discretionary ETF (CHIQ)0.65%NAV30.54%14.25%9.50%4.39%Market Price29.50%14.27%9.65%4.35%NU722069 Index31.17%14.99%10.27%5.02%Global X MSCI China Real Estate ETF (CHIR)0.65%NAV-4.09%--9.76%Market Price-5.23%--8.58%NU721936 Index-3.65%--10.46%Global X MSCI China Consumer Staples ETF (CHIS)0.67%NAV28.55%--42.12%Market Price25.51%--40.77%NU722070 Index29.01%--42.89%Global X MSCI China Utilities ETF (CHIU)0.66%NAV-11.74%---5.86%Market Price-11.76%---5.64%NU722095 Index-11.03%---5.15%Global X MSCI China Financials (CHIX)0.66%NAV-12.89%0.24%-1.76%1.67%Market Price-13.37%-0.12%-1.64%1.61%NU721887 Index-11.33%1.00%-1.05%2.27%
6. Source: Bloomberg as of Jun 30, 2020Market Cap and Contribution to Return calculations based on MSCI China Index. All else calculated on sector index level.China Sectors – Quarterly Report: Contribution
7. Sector (Ticker)P/EP/BP/SDividend Yield %30DSEC Yield %Profit Margin %Return on Equity30DVolatility60D VolatilityMSCI China Index (MXCN)14.51.91.61.810.212.423.420.7Communication Services (CHIC)33.23.13.67.9-0.087.96.628.226.2Consumer Discretionary (CHIQ)27.15.22.43.7-0.123.77.329.530.1Consumer Staples (CHIS)27.67.04.69.60.119.619.322.124.5Energy (CHIE)9.60.70.45.00.755.08.422.025.0Financials (CHIX)6.20.71.116.52.2916.511.722.123.8Health Care (CHIH)37.37.75.93.80.153.810.031.029.9Industrials (CHII)10.91.60.75.61.285.610.321.924.4Information Technology (CHIK)343.81.44.20.074.29.736.733.0Materials (CHIM)14.32.01.04.01.104.09.221.725.3Real Estate (CHIR)61.30.711.93.9711.917.932.831.2Utilities (CHIU)9.61.41.08.22.718.29.721.222.1QualityValuationsRiskSource: Bloomberg as of Jun 30, 2020; ETF Research Center as of Jun 30, 2020P/E refers to price-to-earnings; P/B (price-to-book); P/S (price-to-sales); 30D refers to 30 Day; 60D refers to 60 DayChina Sectors – Quarterly Report: Valuations, Fundamentals & Risk
8. Shares are bought and sold at market price (not NAV) and are not individually redeemed from the Fund. Brokerage commissions will reduce returns. Global X NAVs are calculated using prices as of 4:00 PM Eastern Time. The closing price is the Mid-Point between the Bid and Ask price as of the close of exchange. Indices are unmanaged and do not include the effect of fees, expenses or sales charges. One cannot invest directly in an index This material must be preceded or accompanied by a current prospectus, which can be found by clicking here for CHIS, CHIH, CHIK, CHIR, CHIU, and here for CHIQ, CHIE, CHIX, CHII, CHIM, CHIC . Investors should read it carefully before investing or sending money. Global X Management Company LLC serves as an advisor to Global X Funds. The Funds are distributed by SEI Investments Distribution Co. (SIDCO), which is not affiliated with Global X Management Company LLC. Global X Funds are not sponsored, endorsed, issued, sold or promoted by MSCI nor does MSCI make any representations regarding the advisability of investing in the Global X Funds. Neither SIDCO nor Global X is affiliated with MSCI. Investing involves risk, including the possible loss of principal. International investments may involve risk of capital loss from unfavorable fluctuation in currency values, from differences in generally accepted accounting principles, or from economic or political instability in other nations. Emerging markets involve heightened risks related to the same factors as well as increased volatility and lower trading volume. Securities focusing on a single country and narrowly focused investments may be subject to higher volatility. Disclosures