
Knowing how many genes determine a phenotype Mendelian andor QTL analysis and where the genes are located linkage mapping is a first step in understanding the genetic basis of a phenotype A ID: 915558
Download Presentation The PPT/PDF document "DNA sequencing: g enes, genomes, and mar..." is the property of its rightful owner. Permission is granted to download and print the materials on this web site for personal, non-commercial use only, and to display it on your personal computer provided you do not modify the materials and that you retain all copyright notices contained in the materials. By downloading content from our website, you accept the terms of this agreement.


Slide1
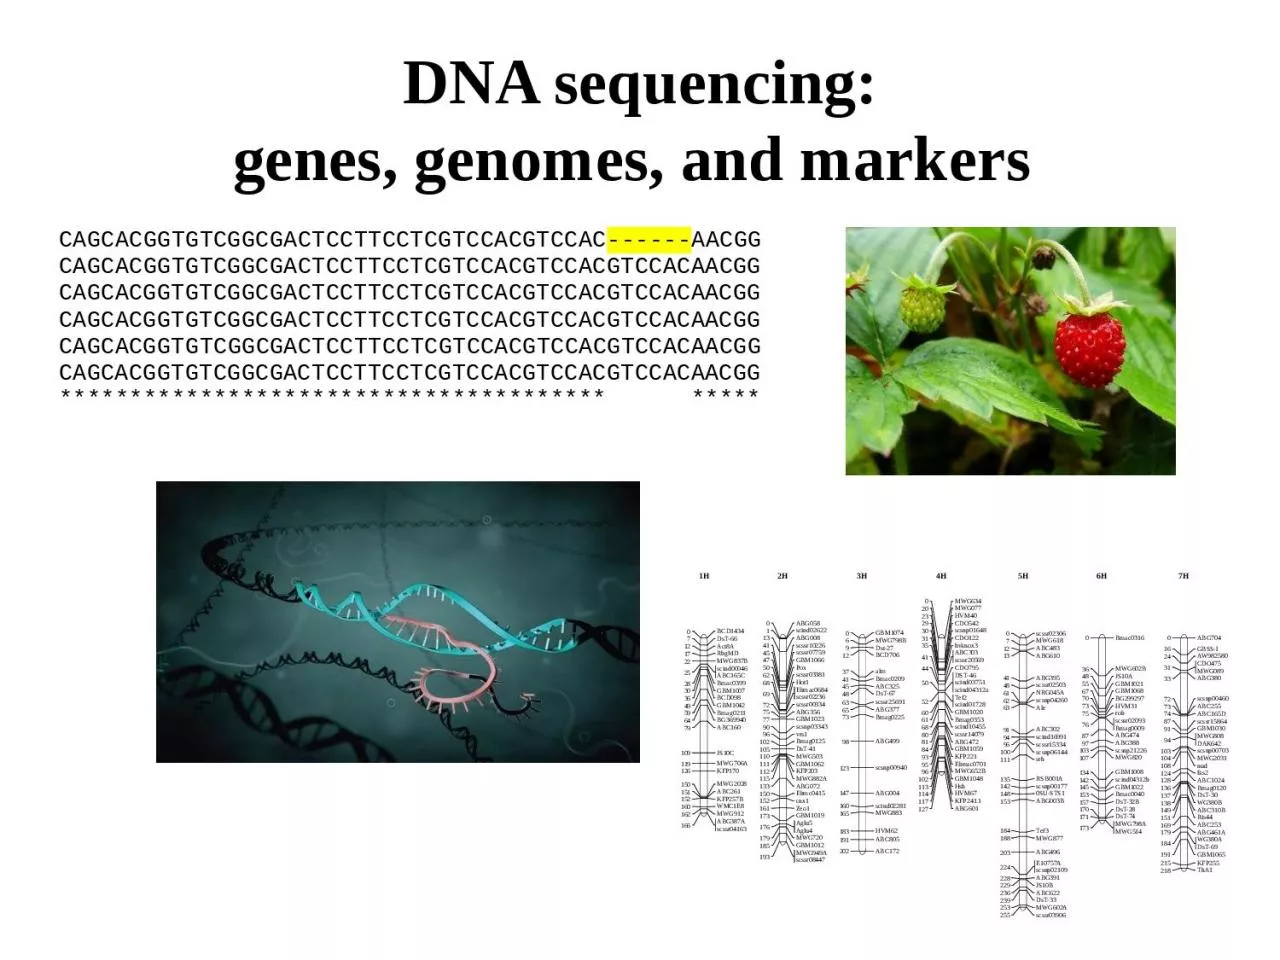
DNA sequencing:genes, genomes, and markers
Slide2Knowing how many genes determine a phenotype (Mendelian and/or QTL analysis), and where the genes are located (linkage mapping) is a first step in understanding the genetic basis of a phenotype
A second step is determining the sequence of the gene (or genes
)Steps in Genetic Analysis
Slide3Subsequent steps involve….Understanding gene regulation
Understanding the context of the gene in the sequence of the whole genome
Analysis of post-transcriptional events, understanding how the genes fit into metabolic pathways, how these pathways interact with the environmentSteps in Genetic Analysis
Slide45,300,000,000 base pairs165% of human genome Enough characters for 11,000 large novels60,000,000 base pairs of expressed sequence
~ 1% of total sequence, like humans
125 large novels
Genome sequence of a diploid
plant
(2n = 2x = 14)
Slide5Genomic DNA (or RNA) extraction(RNA cDNA) Manipulate DNA with
restriction enzymes to reduce complexity and/or facilitate further manipulation
Manage and/or maintain DNA in vectors and/or libraries
Selecting DNA targets via amplification
and/or
hybridization
Determining
nucleotide sequence
of the targeted DNA
Molecular
t
ools for determining DNA (or RNA) sequence
Slide6G
enomic
DNA (or RNA): Leaf segments or target tissues
Key
considerations are
Concentration
Purity
Fragment size
Extracting DNA (
orRNA
)
Slide7RNA-
seq
: mRNA to cDNA
Reverse transcriptase
Slide8Restriction enzymes make cuts at defined recognition sites in DNAA defense system for bacteria, where they attack and degrade the DNA of attacking bacteriophages
The restriction enzymes are named for the organism from which they were isolated
Harnessed for the task of systematically breaking up DNA into fragments of tractable size and for various polymorphism detection assaysEach enzyme recognizes a particular DNA sequence and cuts in a specified fashion at the sequence
Restriction Enzymes
Slide9Restriction Enzymes
Recognition sites and fragment size: a
four-base cutter ~ 256 bp (4
4); more frequently
than a six-base cutter, which
in turn will cut more often than one with an eight
base-cutter
Methylation sensitive restriction enzymes
Target
the
epigenome
Slide10Palindrome recognition sites – the same sequence is specified when each strand of the double helix is read in the opposite direction.
Sit on a potato pan, Otis
Cigar? Toss it in a can, it is so tragicUFO. tofuGolf? No sir, prefer prison flogFlee to me remote elfGnu dung
Lager, Sir, is regalTuna nut
CRISPR: Clustered
regularly interspaced palindromic repeats
Restriction Enzymes
Slide11Propagate and maintain DNA fragments generated by the restriction digestion Efficiency and simplicity of inserting and retrieving the inserted DNA fragments
Key feature of the cloning vector: size of the DNA insertPlasmid ~ 1 kb
BAC ~ 200 kb
Vectors
Slide12Repositories of DNA fragments cloned in their vectors
or
attached to platform-specific oligonucleotide adapters
Classified in terms of
cloning vector: e.g. plasmid, BAC
i
n terms of cloned DNA fragment source: e.g. genomic,
cDNA
In terms of intended use: e.g. next generation sequencing (NGS)
Libraries
Slide13Total genomic DNA digested and the fragments cloned into an appropriate vector or systemRepresentative sample all the genomic DNA present in the organism, including both coding and non-coding sequences
Enrichment strategies: target specific types of sequences
unique sequences Methylated sequences
Genomic DNA libraries
Slide14Generated from mRNA transcripts, using reverse transcriptaseThe cDNA library represents only the genes that are expressed in the tissue and/or developmental stage that was sampled
cDNA libraries
Slide15K.B Mullis, 1983
in vitro amplification of ANY DNA
sequenceDNA Amplification: Polymerase Chain Reaction (PCR)
https://www.youtube.com/watch?v=2KoLnIwoZKU
Slide16Primers, adapters, and more
…
~$0.010 per bp
...< ~ 100 bases
Synthetic DNA
: oligonucleotides
Slide17Design of two single stranded oligonucleotide primers complementary to motifs on the template DNA.
DNA Amplification: Polymerase Chain Reaction (PCR)
Slide18A Polymerase extends the 3’ end of the primer sequence using the DNA strand as a template.
DNA Amplification - PCR
Slide19The PCR reaction consists of:Buffer
DNA polymerase (
thermostable)Deoxyribonucleotide triphosphates (
dNTPs)
Two primers (oligonucleotides)
Template
DNA
PCR Principles
Slide20Each cycle generates exponential numbers of DNA fragments that are identical copies of the original DNA strand between the two binding sites.
PCR Principles
Slide21The choice of what DNA will be amplified by the polymerase is determined by the primers
The DNA between the primers is amplified by the polymerase: in subsequent reactions the original template, plus the newly amplified fragments, serve as templates
Steps in the reaction include denaturing the target DNA to make it single-stranded, addition of the single stranded oligonucleotides,
hybridization of the primers to the template, and
primer extension
PCR Principles
Slide22Amplify a target sequence from a pool of DNA (your favorite gene, forensics, fossil DNA)Start the process of genome sequencing
Generate abundant markers for linkage map construction molecular markers
PCR Applications
Slide23Single strand nucleic acids find and pair with other single strand nucleic acids with a complementary sequenceAn application of this affinity is to label one single strand and then to use this
probe to find complementary sequences in a population of single stranded nucleic acids
For example, if you have a cloned gene – either a cDNA or a genomic clone - you could use this as a probe to look for a homologous sequence in another DNA sample The microarray concept:
https://
www.dnalc.org/resources/3d/26-microarray.html
DNA Hybridization
Slide24The principle of hybridization can be applied to pairing events involving DNA: DNA; DNA: RNA; and protein: antibody
DNA Hybridization
Southern blot
Northern blot
Western blot
Slide25Advances in technology have removed the technical obstacles to determining the nucleotide sequence of a
gene, a chromosome region, or a whole genome.
DNA sequencing
Slide26Start with a defined fragment of DNA
Based on this template, generate a population of molecules differing in size by one base of known composition
Fractionate the population molecules based on size
The base at the truncated end of each of the fractionated molecules is determined and used to establish the nucleotide sequence
Sanger DNA Sequencing
(classic but still relevant)
Slide27A dideoxy nucleotide lacks a 3' OH and once incorporated, it will terminate strand synthesis. L-1. No free 3' OH
Sanger Sequencing -
ddNTPs
Slide28Buffer
DNA polymerase
dNTPs
Primer
Target DNA
ddGTP
ddATP
ddTTP
ddCTP
Sanger Sequencing
https://
www.dnalc.org/view/15923-Cycle-sequencing.html
https://
www.dnalc.org/view/15479-Sanger-method-of-DNA-sequencing-3D-animation-with-narration.html
http://www1.udel.edu/dnasequence/Site/How_does_DNA_sequencing_work.html
Slide29Next Generation Sequencing - Illumina
https://
www.youtube.com/watch?annotation_id=annotation_228575861&feature=iv&src_vid=womKfikWlxM&v=fCd6B5HRaZ8
Slide30Sequencing - PAC Biohttps://www.youtube.com/watch?v=v8p4ph2MAvI
Slide31Sequencing considerations Read length
AccuracySpeed
CostAssembly
Slide32Sequencing – up and coming (?)
https://
nanoporetech.com/applications/dna-nanopore-sequencing
Slide33Genome sizes and whole genome sequencing
Plant
Genome size
# GenesArabidposis thaliana
135 Mb
27,000
Fragaria
vesca
240 Mb
35,000
Theobroma cacao 415 Mb
29,000Zea mays2,300 Mb40,000
Pinus
taeda
23,200Mb50,000Paris japonica148,852Mb??
Credit: Karl
Kristensen
, Denmark
Slide34Sequencing a plant genome
Slide35Fragaria vesca
Herbaceous, perennial
2n=2x=14 240 Mb
Reference species for Rosaceae
Genetic resources
Fragaria
x
ananassa
:
2n=8x=56.
Domesticated 250 years ago
Sequencing a plant genome
Credit: commons.Wikimedia.org
Slide36Short reads
No physical reference
De novo assemblyOpen source
Sequencing a plant genome
Slide37Roche 454, IlluminaX39 coverage (number of reads including a given nucleotide) Contigs
(overlapping reads) assembled into scaffolds (contigs
+ gaps)~ 3,200 scaffolds N50 of 1.3 Mb (weighted average length)Over 95% (209.8 Mb) of total sequence is represented in 272 scaffolds
Sequencing a plant genome
Slide38Anchoring the genome sequence to the genetic map
94% of scaffolds anchored
to the diploid Fragaria reference
linkage map using 390 genetic
markers
Pseudochromosomes
~ linkage groups
Sequencing a plant genome
Slide39Synteny
Homologs Orthologs
Paralogs
Sequencing a plant genome
Credit: Biology stackexchange.com
Slide40The small genome size (240 Mb)Absence of large genome duplications Limited numbers of transposable elements, compared to other angiosperms
Sequencing a plant genome
Slide41Sequencing a plant genome the
transcriptome
Fruits and roots – different types of genes
Slide42Gene prediction 34,809 nuclear genesflavor, nutritional
value, and flowering time
1,616 transcription factorsRNA genes 569
tRNA, 177
rRNA
, 111
spliceosomal
RNAs, 168 small nuclear RNAs,
76 micro RNA and 24 other RNAs
Chloroplast genome
155,691
bp
encodes 78 proteins, 30
tRNAs
and 4
rRNA
genesEvidence of DNA transfer from plastid genome to the nuclear genome
Sequencing a plant genome
Slide43DNA (molecular) markersLinkage mapping, quantitative trait locus (QTL) mapping, anchoring genome sequences
Slide44A way of addressing plant genetics and breeding challenges: The large number of genes per genome
Huge genome
sizesOften a subset of the total genome is of interest
Why use markers rather than whole genome sequences?
Slide45Establish evolutionary relations: homoeology and synteny
Applications of Markers
Slide46Are trait associations due to linkage or pleiotropy?
Identify markers that can be used in marker assisted selection
Locate genes for qualitative and quantitative traitsA starting point for map-based cloning strategiesApplications of Markers
Slide47Markers are based on polymorphisms Amplified fragment length
polymorphism
Restriction fragment length polymorphismSingle nucleotide polymorphism
The polymorphisms become the alleles at marker loci
The marker locus is not necessarily a gene: the polymorphism may be in the dark matter, in a UTR, in an intron, or in an exon
Non-coding regions may be more
polymorphic
Molecular markers are abundant
Slide48Silent
*** CTG GGA GAT TAT GGC TT
T AAG****** CTG GGA GAT TAT GGC TTC AAG*** alignment
Leu
Gly
Asp Tyr
Gly
Phe
Lys
Leu
Gly Asp Tyr Gly Phe Lys translation
Missense
*** CTG GGA GAT TAT GGC TT
T
AAG****** CTG GGA GAT TAT GGC TAT AAG*** alignment
Leu
Gly
Asp Tyr
Gly
Phe
Lys
Leu
Gly
Asp Tyr
Gly
Tyr
Lys translation
Nonsense
*** CTG GGA GAT TAT GGC TT
T
AAG***
*** CTG GGA GAT TA
G
GGC TTT AAG*** alignment
Leu
Gly
Asp Tyr
Gly
Phe
Lys
Leu
Gly
Asp
STOP
translation
Marker polymorphisms are based on
mutations
Slide49Polymorphisms can be visualized at the metabolome, proteome, or
transcriptome level but for a number of reasons (both technical and biological)
DNA-level polymorphisms are currently the most targeted Regardless of whether it is a “perfect” or a “linked” DNA marker, there are
two key considerations that need to be addressed in order for the researcher/user to visualize the underlying genetic polymorphism
Markers
Slide50Finding and understanding the genetic basis of the DNA-level polymorphism
, which may be as small as a single nucleotide polymorphism (SNP) or as large as an insertion/deletion (INDEL) of
thousands of nucleotides
Detecting the polymorphism via a specific assay or "platform". The same DNA polymorphism may be amenable to different detection assays
DNA Markers
Slide51Marker examples: Simple Sequence Repeats (SSRs)
Simple sequence repeats (SSRs) (aka microsatellites) are
tandemly repeated mono-, di-, tri-, tetra-, penta-, and hexa-nucleotide motifs
SSR length polymorphisms are caused by differences in the number of repeatsAssayed by PCR amplification using pairs of oligonucleotide primers specific to unique sequences flanking the SSR
Multiple platforms
Slide52Simple sequence repeats in hazelnut:
Note the
differences in repeat length AND the consistent flanking sequences
Marker
examples
Simple
Sequence Repeats (SSRs)
Credit: mind42.com
Slide53Highly polymorphicHighly abundant and randomly dispersed
Co-dominant Locus-specific
Amenable to high throughput assays Marker examples
Simple Sequence Repeats (SSRs)
Slide54Individual 1 (AC)x9
Individual 2 (AC)x11
51
bp
55
bp
SSR Concept
Slide55DNA sequence variations that occur when a single nucleotide (A, T, C, or G) in the genome sequence is alteredMarker examples:
Single Nucleotide Polymorphisms (SNPs)
Alleles
…..ATGCTCTTACTGCTAGCGC……
…..ATGCTCTTACTGCTAGCGC……
…..ATGCTCTT
C
CTGCTAGCGC……
…..ATGCTCTTACTGC
A
AGCGC……
Single
Nucleotide
Polymorphisms
(SNPs)
Consensus…..ATGCTCTT
N
CTGC
N
AGCGC……
Slide56Marker examples: SNPsHighly abundant (~ 1 every 200 bp)Locus-specific
Co-dominant and bi-allelic
Basis for high-throughput and massively parallel genotyping technologiesConnectivity to reference genome sequences
Slide57SNP Detection StrategiesLocus specific systems
Many samples with few markersMarkers for key target characters
Example: KASP Genome wide systemsFewer samples with many markers
Germplasm characterization Genotyping panels for Genome Wide Association Studies Example: Illumina
Slide58SNPs on KASP and Illumina 9K
Slide59Abundant markers are
available for every plant !!!!!