
ExecutiveSummaryWineWine like anything we consume requires natural resources and generates environmental emissions and therefore understanding the processes that contribute the most impact can aid in ID: 872338
Download Pdf The PPT/PDF document "Environmental Footprint Literature Revie..." is the property of its rightful owner. Permission is granted to download and print the materials on this web site for personal, non-commercial use only, and to display it on your personal computer provided you do not modify the materials and that you retain all copyright notices contained in the materials. By downloading content from our website, you accept the terms of this agreement.


1 E xecutive Summary: Environmental Fo
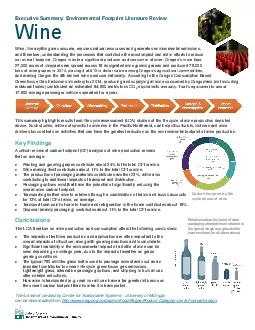
E xecutive Summary: Environmental Footprint Literature Review Wine Wine, like anything we consume, requires natural resources and generates environmental emissions, and therefore, understanding the processes that contribute the most impact can aid in efforts to reduce our overall footprint. Oregon is both a significant producer and consumer of wine. Oregon’s more than 27,000 acres of vineyards are spread across 18 designated wine gr owing areas and produced 78,000 tons of wine grapes in 2014, placing it at #10 in dollar value among Oregon’s agricultural commodities, and making Oregon the 4th ra nked wine producer nationally. According to the Oregon Consumption Based Greenhouse Gas Emis sions Inventory for 2014, producing and supplying all wine consumed by Oregonians (not including restaurant sales) contributed an estimated 84,500 metric tons CO 2 equivalents annually. That’s equivalent to about 17,800 average passenger vehicles operated f or a year . This summary highlight s results from life cycle asse ssment ( LCA ) studies of t he life cycle of wine production depicted above . Such studies, while not specific to wineries in the Pacific Northwest, can help viticulturists, vintners and wine dr inkers focus efforts on activities that can have the greatest reduction on the environmental footprint of wine production . Key Findings A critical review of carbon footpr int ( CF ) analyses of wine production reveals that on average : Planting and growing grapes contribute about 24% to the total CF for wine. Wine making itself contributes abo ut 11% to the total CF for wine. The production of packaging materials contribute s another 23%, while also contributing to additional impacts of t ransport and distribution. Packaging options exist that have the potential of significantly reducing the overall wine carbon footprint. Transporting bottled wine to retailers through a combination of tra ins and trucks accounts for 13% of total CF of wine, on average. Transport from point - of - sale to home and refrigeration in the home contributes about 18%. Disposal (mainly packaging) contributes about 11% to the total CF for wine . Conclusions The LCA literature on wine production and consumption offers the following conclusions: The impacts of fertilizer production and application are often important to the overall impacts of viticulture, along with growing practices and local climate. Significant variability in the environmental impact of a bottle of wine can be seen depending on vintage year, due to the impact of weather on grape growing conditions. The typical 750 milliliter glass bottle used to package wine stands out as an important contributor to overall life cycle greenhouse gas emissions. Lightweight glass, alternative packaging options, and shippin g in bulk all can offer notable reductions. How wine is transported (e.g. road vs rail) can have a far greater influence on the overall carbon footprint than how far it is transported . The full report created by Center for Sustainable Systems - University of Michigan can be downloaded from http://www.oregon.gov/deq/mm/food/Pages/Product - Category - Level - Footprints.aspx . Carbon footprint by life cycle phase of wine Relative carbon footprint of wine packaging alternatives in relation to the typical single use glass bottle (same volume for all alternatives)