

Fernando Almaguer Angeles John Murphy Liam Murphy and A Omar Portillo Dominguez fernandoalmaguerangeles atucdconnectie Motivation Evaluation Results and Future Work Proposed Approach ID: 804758
Download The PPT/PDF document "Choosing Machine Learning Algorithms for..." is the property of its rightful owner. Permission is granted to download and print the materials on this web site for personal, non-commercial use only, and to display it on your personal computer provided you do not modify the materials and that you retain all copyright notices contained in the materials. By downloading content from our website, you accept the terms of this agreement.


Slide1
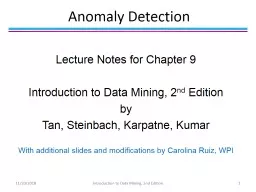
Choosing Machine Learning Algorithms for Anomaly Detection in Smart Building IoT Scenarios
Fernando Almaguer-
Angeles
, John Murphy, Liam Murphy, and A. Omar Portillo-Dominguez fernando.almaguerangeles[at]ucdconnect.ie
Motivation
Evaluation
Results and Future Work
Proposed Approach
What
ML
technique
(s)
should
we
use?
Dataset
Different feature selection
Dataset
Dataset
Dataset
Three-fold
cross-validation
ML
auROC
= (1 + recall – false positive rate) / 2
R
ecall
= TP / (TP + FN)
F
alse
positive rate = FP / (FP + TN)
After each experiment, we collect the true positives (TP), true negatives (TN), false positives (FP), and false negatives (FN) – which capture how well the algorithm classified the information – to calculate the
auROC
metric with this formula:
The ML training was made by using two-thirds of the anomalous data points in the DS and the same amount of regular data points, so we can have a balanced training DS.
We analyzed and injected binary anomalies in real-world smart-buildings datasets.
We used 22 state-of-the-art supervised ML classifiers.
We
evaluated the classification performance using the area under the ROC curve [1].
We studied two types of DS: Tracking (above) & Coexisting Time (bottom).
Tracking: it is very likely that any of these ML algorithms will have a good performance for DS with similar characteristics as the tracking datasets we had analyzed.Coexisting Time: the advice is to start working with these ML algorithms for DS with coexisting time characteristics. Furthermore, the algorithm can be tuned to increase the classification performance on the data.
Future work:
confirm and extend our results, with new datasets and new scenarios like other feature selection and other dataset types.
[1]
V. López, A. Fernández, S. García, V.
Palade
, and F. Herrera, “
An
insight
into
classification
with
imbalanced
data:
Empirical
results
and
current
trends
on
using
data
intrinsic
characteristics
,”
Information
Sciences
, vol. 250, pp. 113–141, 2013. [Online]. Available:
http://dx.doi.org/10.1016/j.ins.2013.07.007
This work was supported, in part, by Science Foundation Ireland grant 13/RC/2094 and co-funded under the European Regional Development Fund through the Southern & Eastern Regional Operational
Programme
to Lero - the Irish Software Research Centre (
www.lero.ie
).