
Seda Yerli 20824388 Serap Sunatepe 20824245 Gonca Çalışkan 20823894 Beytepe Ankara 12042012 OUTLINE History of IR Radiation and FTIR General Information about IR ID: 268574
Download Presentation The PPT/PDF document "FOURIER TRANSFORM INFRARED SPECTROSCOPY" is the property of its rightful owner. Permission is granted to download and print the materials on this web site for personal, non-commercial use only, and to display it on your personal computer provided you do not modify the materials and that you retain all copyright notices contained in the materials. By downloading content from our website, you accept the terms of this agreement.

Slide1
FOURIER TRANSFORM INFRARED SPECTROSCOPY
Seda Yerli 20824388
Serap
Sunatepe
20824245
Gonca Çalışkan 20823894
Beytepe
,Ankara
12.04.2012Slide2
OUTLINE
History
of IR
Radiation
and
FTIR
General
Information
about
IR
Spectroscopy
Types
of IR
Spectrometers
Sample
Preparation
Instrumentation
Applications
of FTIRSlide3
Goals of presentation
;
To
give
general
information
about
differences
between
IR
spectrometers
about
FTIR
theorySlide4
History of IR and FTIR
spectroscopy
Chemical IR spectroscopy was emerged as a science in 1800 by Sir William Herschel
Firstly most IR instrumentation was based on prism or grating monochromators
Michelson invented interferometer in 1881Slide5
In 1949 Peter Fellgett
obtained
the
first
IR
spectrum
by
using
FTIR
spectrometer
In
1960s
commercial
FTIR
spectrometers
appeared
In
1966 Cooley-
Tukey
developed
an
algorithm, which quickly does a Fourier transformSlide6
What is Spectroscopy?
Spectroscopy
deals
with
interactions between matter and
energy
Figure 1 : interaction between matter and energy Slide7
Figure 2 : electromagnetic
spectrumSlide8
Motion of atoms and molecules IR radiation higher
temperature
motion
more IR radiation emissionSlide9
Figure 3 : human body at normal body temperatureSlide10
Vibrations of Molecules
Symmetrical
stretching
Antisymmetrical
stretching
Scissoring
Rocking
Wagging
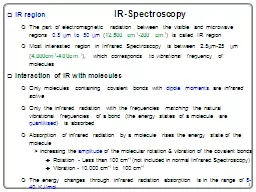
TwistingSlide11
Absorption of IR Radiation
Net change in molecules’ dipol
moment
Equıvalence
in frequenciesSlide12
Figure 4 : vibration
energy
levels
of moleculesSlide13
The spectrum tells us;
The infrared spectrum for a molecule is a graphical
display
The spectrum has two
regions
:
The fingerprint region 600-1200 cm-1
F
unctional
group
region
1200-3600 cm
-1Slide14
determining structures of compoundsidentifying
compounds
Figure 5 :
i
nfrared spectrum of isopropanolSlide15
Two types of instrumentations are used to obtain IR spectrum;Dispersive Type
Fourier
Transform Infrared (FTIR)Slide16
Dispersive Type Spectrometer
Having
a
filter
or
grating
monochromator Figure 6 : dispersive type
spectrometer
instrumentationSlide17
Fourier Transform Infrared Spectrometer
collecting
an
interferogram
simultaneously
measuring
acquir
ing
and digitizing the interferogramoutput
ing
the
spectrumSlide18
Why FT-IR spectroscopy?
Non-destructive technique
Good precision
No external calibration
High speed
Signal-Noise ratio
Mechanically simpleSlide19
What
information can FT-IR
provide?
Identify
unknown
material
Determine
quality or consistency of
sampleDetermine amount of components in mixtureSlide20
Sample Preparation
Gaseous
samples
L
ong pathlength
to compensate for the
diluteness
Liquid samples
Can be sandwiched between two plates of a saltsodium chloride potassium bromide
calcium fluorideSlide21
SolidsKBr
pellet
Nujol mull
Dissolving
in
organic
solvent
(CCl4)Figure 7 : preparation
KBr
pellet
Slide22
INSTRUMENTATION1.Radiation
S
ources
Black-body radiation
Nernst
filament (ZrO and some other rare earth
oxides)
Globar (Si-C)Ni-Cr wireHeated ceramicMercury lampSlide23
2.The Interferometer
spectral encoding
resulting interferogram signal obtains
Figure
8 : an
interferometer
Slide24
How does it work?D
ividing
the
radiation
into
two beams
One of them goes to fixed mirrorOther one goes to movable mirrorRecombining Sending to detector
Figure
9:
ligth
travel
in
interferometerSlide25
𝛿
=0 or 𝛿
=
𝑛𝜆
constructive
interference𝛿=𝜆/2 or 𝛿 = (𝑛 + 1)𝜆/2 destructive interferences
Figure
9 :
constructive
-
destructive
interfrence
of
wavesSlide26
Interferogram: Name of the signal which has time domain and occurs as a result of constructive interferences.
Figure
11 : an
interferogram
example
Slide27
A Fourier transform converts the time domain to the frequency domain with absorption as a function of frequency.
Figure
12:
example
of
spectrum
that
is converted by fourier transform Slide28
3.DetectorsThe
beam finally passes to the
detector
Thermal
detectors
Thermocouples
Bolometer
Photoconducting detectors
most
sensitive
detectors
.Slide29
Pyroelectric detectors
much faster
response
time
insulator material
Triglycine
sulphate
Figure
13:
pyroelectricc
detectorSlide30
4.The Computer
The
measured signal is digitized and sent to the computer where the Fourier transformation takes place.
Figure
14 : FTIR
spectrometerSlide31
The
Sample
Analysis
Process
Figure 15 : FTIR spectrometeranalysis processSlide32
Applications of FT-IRPharmaceutical research
Forensic
investigations
Polymer
analysis
Lubricant
formulation and fuel
additives
Foods researchQuality assurance and control Environmental and water quality analysis methods Biochemical and biomedical researchcoatings and surfactantsSlide33
References
Introduction to
S
pectroscopy
,
Donald L. Pavia
Infrared Spectroscopy in Conservation Science,
Michele
R Derrick,Dusan Stulik,James M. Landryhttp://resources.yesicanscience.ca/trek/scisat/final/grade9/spectrometer2.html
http://roadtickle.com/10-cool-facts-about-the-human-bodySlide34
http://www.health.clinuvel.com/en/
uv
-
light
-a-skin
http://mmrc.caltech.edu/FTIR/FTIRintro.pdf
Hacettepe Üniversitesi Fen Fakültesi
Enstrümental
Analiz Deneyleri FöyüSlide35
Thank
You
for
Listening