
Nguyen NL Le B Wang D Serologic Evidence of Frequent Human Infection with WU and KI Polyomaviruses Emerg Infect Dis 200915811991205 httpsdoiorg103201eid1508090270 ID: 1046938
Download Presentation The PPT/PDF document "Figure 2 Figure 2. ELISA result..." is the property of its rightful owner. Permission is granted to download and print the materials on this web site for personal, non-commercial use only, and to display it on your personal computer provided you do not modify the materials and that you retain all copyright notices contained in the materials. By downloading content from our website, you accept the terms of this agreement.


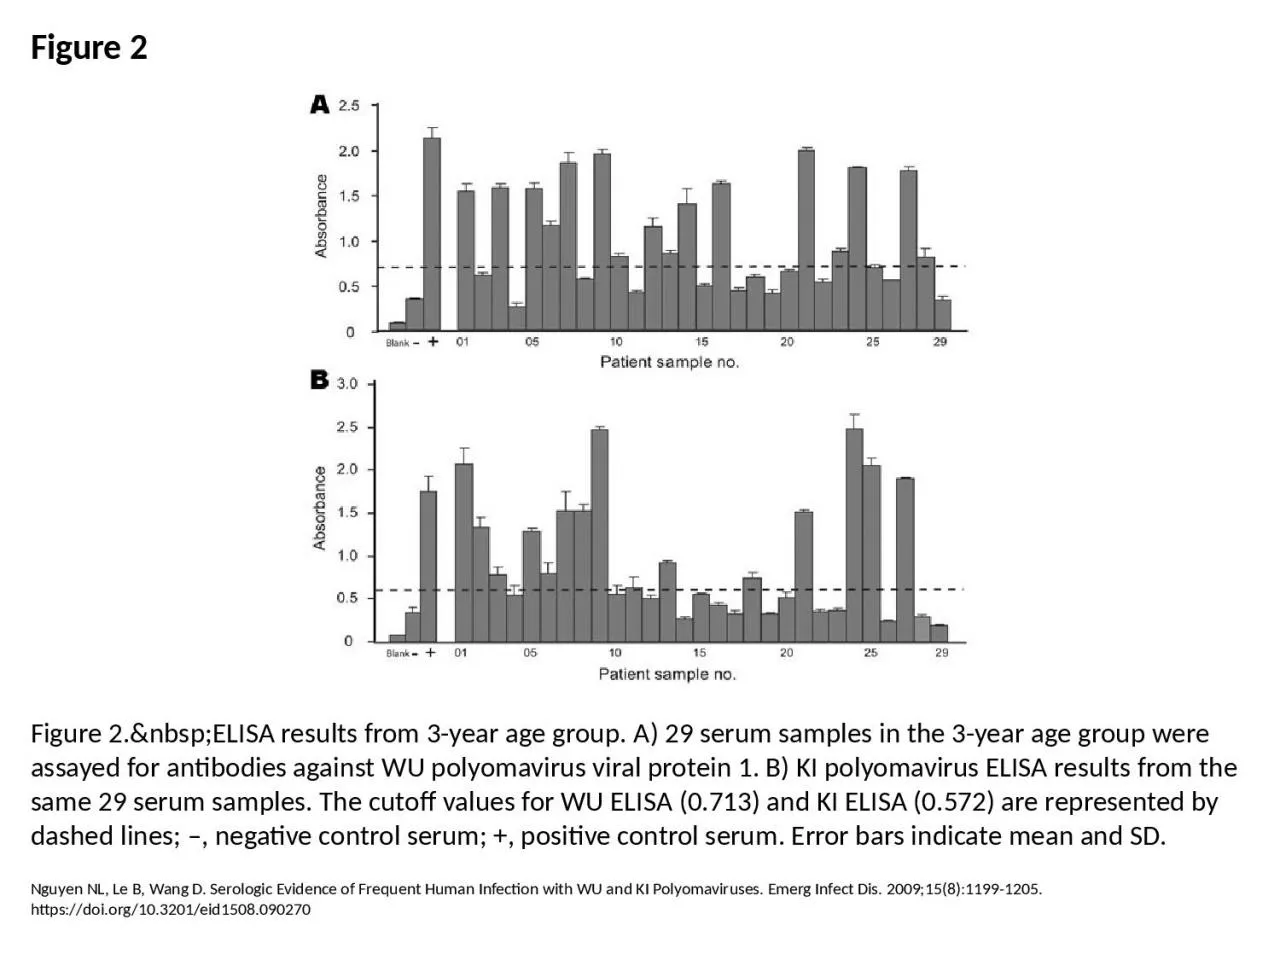
1. Figure 2Figure 2. ELISA results from 3-year age group. A) 29 serum samples in the 3-year age group were assayed for antibodies against WU polyomavirus viral protein 1. B) KI polyomavirus ELISA results from the same 29 serum samples. The cutoff values for WU ELISA (0.713) and KI ELISA (0.572) are represented by dashed lines; –, negative control serum; +, positive control serum. Error bars indicate mean and SD.Nguyen NL, Le B, Wang D. Serologic Evidence of Frequent Human Infection with WU and KI Polyomaviruses. Emerg Infect Dis. 2009;15(8):1199-1205. https://doi.org/10.3201/eid1508.090270