
What is Edge Detection Identifying pointsEdges in a digital image at which the image brightness changes sharply or has discontinuities Edges are significant local changes of intensity in an image ID: 1022194
Download Presentation The PPT/PDF document "Edge Detection Prof. B.A.Khivsara" is the property of its rightful owner. Permission is granted to download and print the materials on this web site for personal, non-commercial use only, and to display it on your personal computer provided you do not modify the materials and that you retain all copyright notices contained in the materials. By downloading content from our website, you accept the terms of this agreement.


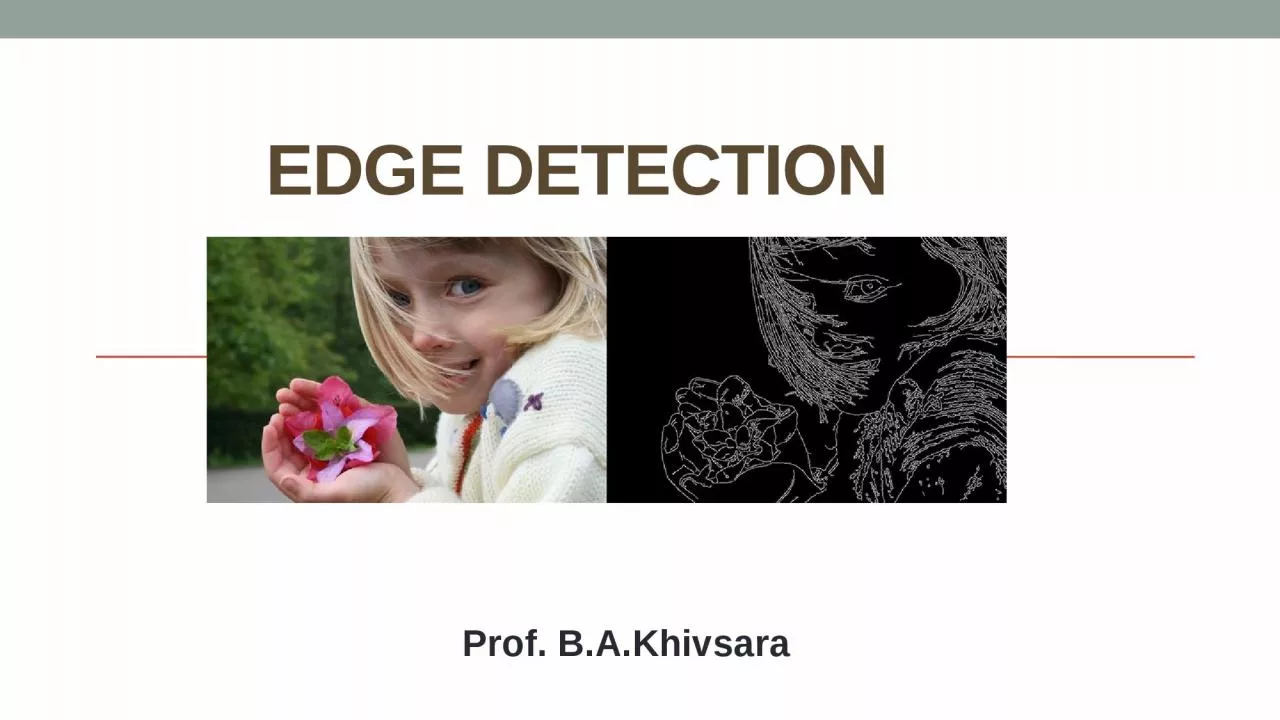
1. Edge Detection Prof. B.A.Khivsara
2. What is Edge Detection?Identifying points/Edges in a digital image at which the image brightness changes sharply or has discontinuities. - Edges are significant local changes of intensity in an image.- Edges typically occur on the boundary between two different regions in an image.
3. Goal of edge detection
4. TYPES OF EDGES
5. Process of Edge Detection
6. Process of Edge Detection - Noise reduction where we try to suppress as much noise as possible, without smoothing away the meaningful edges. Original ImageAfter Nois Reduction
7. Process of Edge Detection - Edge enhancementwhere we apply some kind of filter that responds strongly at edges and weakly elsewhere.
8. METHODS OF EDGE DETECTION
9. First Order Derivative
10. Gradient For a continuous two dimensional function Gradient is defined as
11. Gradient Methods – Roberts Operator100-10-110
12. Roberts Operator - Example
13. Gradient Methods – Sobel Operator-101-202-101121000-1-2-1Gx=Gy=
14. Sobel Operator - ExampleOutputs of Sobel (top) and Roberts operator
15. Second Order Derivative Methods
16. Second Order Derivative Methods - LaplacianDefined as Mask Very susceptible to noise, filtering required, use Laplacian of Gaussian0101-41010
17. Second Order Derivative Methods - Laplacian of Gaussian
18. Program#Libraries to be installed# sudo apt-get install python-opencv# sudo apt-get install python-matplotlibimport cv2from matplotlib import pyplot as pltimg0 = cv2.imread('images.jpeg',)# loading imagegray = cv2.cvtColor(img0, cv2.COLOR_BGR2GRAY)# converting to gray scaleimg = cv2.GaussianBlur(gray,(3,3),0)# remove noise cv2.GaussianBlur(image,(Kernal_Hieght,Kernal_Width),SigmaX)
19. Program# convolute with proper kernelslaplacian = cv2.Laplacian(img,cv2.CV_64F) sobelx = cv2.Sobel(img,cv2.CV_64F,1,0) # xsobely = cv2.Sobel(img,cv2.CV_64F,0,1) # yplt.subplot(2,2,1),plt.imshow(img,cmap = 'gray')plt.title('Original'), plt.xticks([]), plt.yticks([])plt.subplot(2,2,2),plt.imshow(laplacian,cmap = 'gray')plt.title('Laplacian'), plt.xticks([]), plt.yticks([])plt.subplot(2,2,3),plt.imshow(sobelx,cmap = 'gray')plt.title('Sobel X'), plt.xticks([]), plt.yticks([])plt.subplot(2,2,4),plt.imshow(sobely,cmap = 'gray')plt.title('Sobel Y'), plt.xticks([]), plt.yticks([])plt.show()