
TaxtoGDP ratio over time TaxtoGDP ratio 2018 ID: 846941
Download Pdf The PPT/PDF document "Revenue Statistics in Africa 2020 Tog..." is the property of its rightful owner. Permission is granted to download and print the materials on this web site for personal, non-commercial use only, and to display it on your personal computer provided you do not modify the materials and that you retain all copyright notices contained in the materials. By downloading content from our website, you accept the terms of this agreement.


1 Revenue Statistics in Africa 2020 â
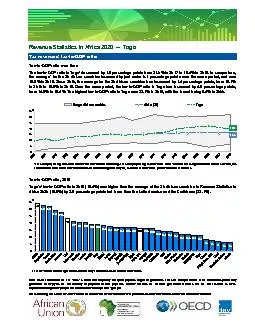
Revenue Statistics in Africa 2020 â Togo Tax-to-GDP ratio over time Tax-to-GDP ratio, 2018 ¹ The LAC average refers to the Revenue Statistics in Latin America and the Caribbean 2020 publication. oe.cd/revenue-statistics-in-latin-america-and-the-caribbean The tax-to-GDP ratio in Togo¹ decreased by 1.6 percentage points from 21.0% in 2017 to 19.4% in 2018. In comparison, the average* for the 30 African countries increased by just under 0.1 percentage points over the same period, and was 16.5% in 2018. Since 2010, the average for the 30 African countries has increased by 1.4 percentage points, from 15.1% in 2010 to 16.5% in 2018. Over the same period, the tax-to-GDP ratio in Togo has increased by 4.6 percentage points, from 14.8% to 19.4%. The highest tax-to-GDP ratio in Togo was 22.1% in 2016, with the lowest being 9.4% in 2000. In the OECD classification the term âtaxesâ is confined to compulsory unrequited payments to general government. Taxes are unrequited in the sense that benefits provided by government to taxpayers are not normally in proportion to their payments. Non-tax revenues are all other government revenues that are not classified as taxes. http://www.oecd.org/tax/tax-policy/oecd-classification-taxes-interpretative-guide.pdf Tax revenues: tax-to-GDP ratio Togo's¹ tax-to-GDP ratio in 2018 (19.4%) was higher than the average of the 30 African countries in Revenue Statistics in Africa 2020 (16.5%) by 2.8 percentage points but lower than the Latin America and the Caribbean (23.1%). The tax-to-GDP ratio of Togo excludes social security contributions as the data are not available. *The Africa (30) average was 16.5% in both 2017 and 2018 due to rounding. The Africa (30) average is not available before 2009 due to missing data in some countries. In 2009, it is calculated based on estimated tax-to-GDP ratios for Chad and Nigeria in that year, as data were not available prior to 2010 in these countries. 16.5 19.4 0 5 10 15 20 25 30 35 Range African countries Africa (3
2 0) Togo % 34.3 32.4 32.1 29.1 27.8 23.1
Togo
%
34.3
32.4
32.1
29.1
27.8
23.1")
0) Togo % 34.3 32.4 32.1 29.1 27.8 23.1 21.2 20.4 20.2 19.4 #N/A 18.3 17.4 17.2 17.1 16.8 16.7 16.5 16.5 16.0 14.6 14.1 14.1 13.1 12.1 11.8 11.4 11.1 8.5 7.5 7.1 6.3 6.3 #N/A #N/A #N/A #N/A #N/A #N/A #N/A #N/A #N/A #N/A 19.4 #N/A #N/A #N/A #N/A #N/A #N/A #N/A #N/A #N/A #N/A #N/A #N/A #N/A #N/A #N/A #N/A #N/A #N/A #N/A #N/A #N/A #N/A 0 5 10 15 20 25 30 35 % ¹ Source: Revenue Statistics in Africa 2020 For more information see: oe.cd/revenue-statistics-in-africa Total non-tax revenues % of GDP, 2018 Non-tax revenues by category in Togo % of GDP, 2018 With financial support from the governments of Ireland, Japan, Luxembourg, Norway, Sweden and the United Kingdom. In 2018, Togo's non-tax revenues amounted to 7.3% of GDP. This was lower than the average non-tax revenues for the 30 African countries (6.5% of GDP). Grants represented the largest share of non-tax revenues in 2018, amounting to 3.6% of GDP and 48.7% of non-tax revenues. Tax structure refers to the share of each tax in total tax revenues. The highest share of tax revenues in Togo¹ in 2018 was contributed by value added taxes (VAT) (41%). The second-highest share of tax revenues in 2018 was derived from taxes on goods & services other than VAT (35%). Tax revenues: structure Non-tax revenues The tax-to-GDP ratio of Togo excludes social security contributions as the data are not available. *The data for the OECD are for 2017 as the data for 2018 are not available. 24 10 17 8 9 16 19 13 26 17 7 0 20 28 30 41 12 22 22 35 8 8 4 3 0% 10% 20% 30% 40% 50% 60% 70% 80% 90% 100% OECD* LAC Africa (30) Togo¹ Personal income tax Corporate income tax Social security contributions Value added taxes (VAT) Taxes on goods & services other than VAT Other taxes 3.56 0.12 1.26 1.94 0.04 0.39 0.00 0.50 1.00 1.50 2.00 2.50 3.00 3.50 4.00 Grants Rents and royalties Property income excluding rents and royalties Sales of goods and services Fines, penalties and forfeits Miscellaneous and unidentified revenue % 0 2 4 6 8 10 12 14 16 18 20 22 24 26 28