
Habitat Quality and Rarity Brad Eichelberger Model Overview Managing the quality of habitat allows for us to manage the associated species Tier 1 model produces a map of habitat quality ID: 243351
Download Presentation The PPT/PDF document "Biodiversity:" is the property of its rightful owner. Permission is granted to download and print the materials on this web site for personal, non-commercial use only, and to display it on your personal computer provided you do not modify the materials and that you retain all copyright notices contained in the materials. By downloading content from our website, you accept the terms of this agreement.


Slide1
Biodiversity:
Habitat Quality and Rarity
Brad EichelbergerSlide2
Model Overview
Managing the quality of habitat allows for us to manage the associated speciesTier 1 model produces a map of habitat qualityHabitat is a function of conservation
objectiveAre we considering all species or just forest birds? All mammals on the landscape or just threatened mammals? Threats to habitat can be divided into two major categoriesActual removal of habitat or edge fragmentationSources of pollution (e.g., noise), roads, hunters, harvesters, etc. that degrade the integrity of habitatSlide3
Model OverviewSlide4
Model Overview
ServicesHabitat qualityAbility of environment to provide conditions for appropriate individual and population persistenceHabitat rarityThe relative commonness of the habitat relative to the baseline land use scenario Slide5
Alternative
ModelsHeuristic models – (weighted overlay, crayon and paper approach) Expert knowledgeNot statistical
Statistical models – (MaxEnt, logistic regression, CART, ANN) Often data intensiveOutput is probability of occurrence or conversionWhy the InVEST model?Requires basic data that is widely availableHabitat approach can encompass multiple speciesCompare scenarios to a baselineIncorporate the spatial impacts of threats Slide6
Habitat Quality and Rarity ModelSlide7
Model Inputs
InputsMap of each threatRelative weights of threats (0.0 to 1.0)Spatial impact of threatsLand use/land
coverhabitat/nonhabitatsensitivity of each habitat type to each threataccessibility of habitat to threat (social, political, geographical restrictions)roads
cities
LULC
distance
impact
0.35
0.65Slide8
ThreatsSlide9
Threats
roads
cities
distance
·
·
z
roads
cities
0.35
0.65
distance
impactSlide10
Defining HabitatSlide11
Defining Habitat
Is it habitat?
If yes, how suitableis the habitat?0.1
0.3
0.7
1.0
If
unsuitable, then…
LULC
j
0.0Slide12
Defining Sensitivity
How sensitive is the habitat to each threat?Index from 0.0 (not sensitive) to 1.0 (highly sensitive)Example: forest is more sensitive to cropland conversion than grassland
GrasslandCroplandForestCropland
0.8
0.1Slide13
Defining
AccessibilityAccessibility of habitat to threat (social, political, geographical restrictions)Index from 0.0 (restricted)
to 1.0 (unrestricted)Protected ForestRoad Development0.80.0
Unprotected
Forest
Road DevelopmentSlide14
Habitat Rarity
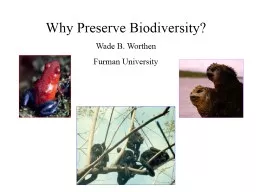
Relative rarity of current land use types in regards to baselineIdentifies habitat that is likely threatened in current or projected scenarioSlide15
Habitat Rarity
Baseline
Current or ProjectedSlide16
Validation of
InVEST to GAPSlide17
Application of
InVEST Slide18
Application of
InVEST Question for audience: “What types of questions and/or decision making can InVEST inform?”Conservation prioritization
Placement of preserves/easements highest quality and rarity or areas most susceptible to highest degradation Concentrate research for rare speciesSlide19
Inputs and Hands On SessionSlide20
Future Improvements
Reviewing methods to incorporate species richnessCommunity proximity of habitat Slide21
Questions?