/
OPEN SOURCE SIMULATOR DUMU OPEN SOURCE SIMULATOR DUMU

OPEN SOURCE SIMULATOR DUMU - PDF document

taylor
taylor . @taylor
Follow
343 views
Uploaded On 2021-08-23

OPEN SOURCE SIMULATOR DUMU - PPT Presentation

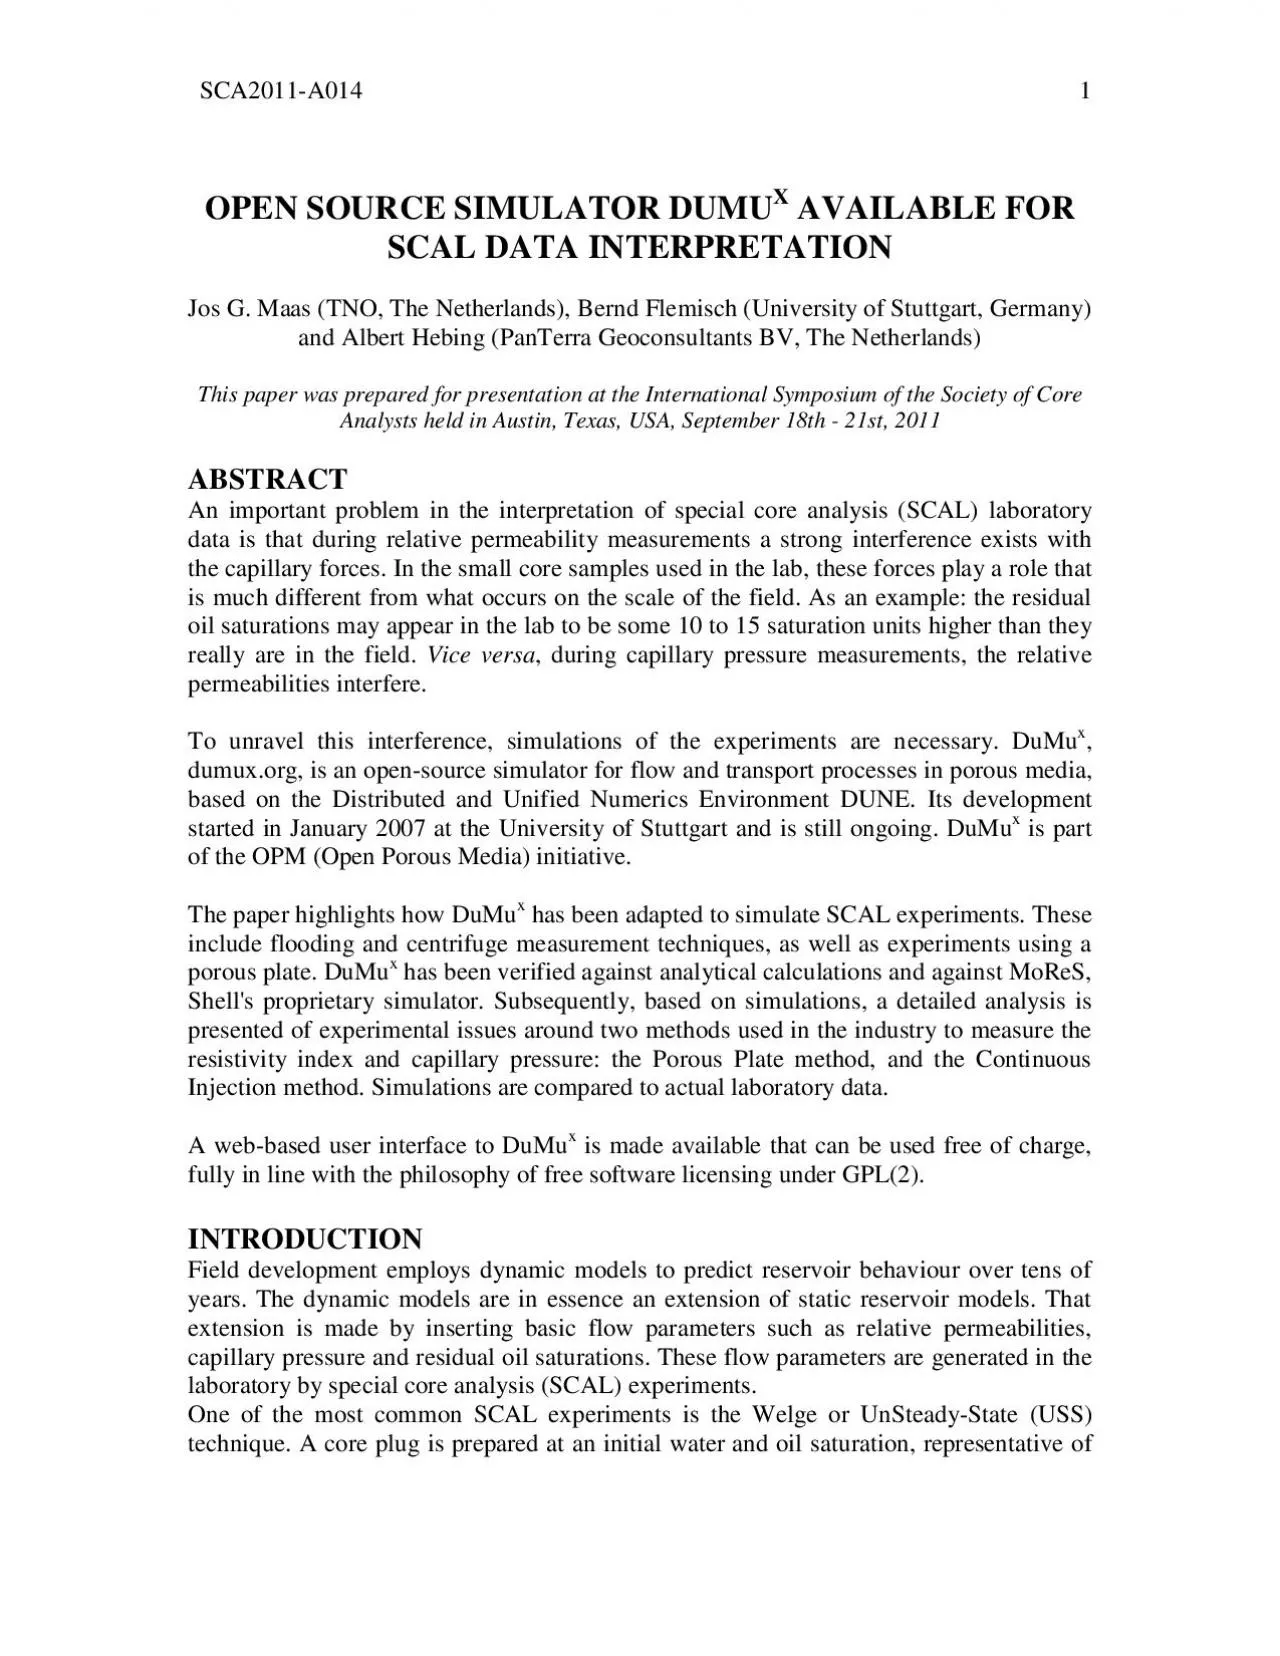
SCA2011A0141XAVAILABLE FOR SCAL DATA INTERPRETATIONJos G Maas TNO The Netherlands Bernd Flemisch University of Stuttgart Germany and Albert Hebing PanTerra Geoconsultants BV The NetherlandsThis paper ID: 869563

capillary pressure oil saturation pressure capillary saturation oil dumu porous water flow plate data relative simulations centrifuge core experiments

Share:

Link:

Embed:

Download Presentation from below link

Download Pdf The PPT/PDF document "OPEN SOURCE SIMULATOR DUMU" is the property of its rightful owner. Permission is granted to download and print the materials on this web site for personal, non-commercial use only, and to display it on your personal computer provided you do not modify the materials and that you retain all copyright notices contained in the materials. By downloading content from our website, you accept the terms of this agreement.


Presentation Transcript

1 SCA2011 - A014 1 OPEN SOURCE SIMUL
SCA2011 - A014 1 OPEN SOURCE SIMULATOR DUMU X AVAILABLE FOR SCAL DATA INTERPRETATION Jos G. Maas (TNO, The Netherlands), Bernd Flemisch (University of Stuttgart, Germany) and Albert Hebing (PanTerra Geoc onsultants BV, The Netherlands) This paper was prepared for presentat ion at the International Symposium of the Society of Core Analysts held in Austin, Texas, USA, September 18th - 21st, 2011 ABSTRACT An important prob lem in the interpretation of special core analysis (SCAL) laboratory data is that during relative permeabi lity measurements a strong interference exists with the capillary forces. In the small core samples used in the lab , these forces play a role that is much different from what occurs on the scale of the field. As an example: the residual oil saturations may appear in the lab to be some 10 to 15 saturation units higher than the y really are in the field . Vice versa , during capillary pressure measurements, the relative permeabilities interfere. To unravel this interference, simulations of the experiments are n ecessary . DuMu x , dumux.org, is a n open - source simulator for fl ow and transport processes in porous media, b ased on the Distributed and Unifi ed Numerics Environment DUNE . Its development started in January 2007 at the University of Stuttgart and is still on going . DuMu x is part of the OPM (Open Porous Media) initiative. The paper highlights how DuMu x has been adapted to simulate SCAL experiments. These include flooding and centrifuge measurement techniques, as well as experiments using a porous plate. DuMu x has been verified against analytical calculations and against MoReS, Shell's proprietary simulator. Subsequently, based on simulations, a detailed analysis is presented of experimental issues around two methods used in the industry to measure the resistivi ty index and capillary pressure: the Porous Plate method, and the Continuous Injection method. Simulations are compared to actual labor atory data . A web - based user interface to DuMu x is made available that can be used free of charge, fully in line with th e philosophy of free software licensing under GPL(2). INTRODUCTION Field development employs dynamic models to predict reservoir behaviour over tens of years. The dynamic models are in essence an extension of static reservoir models. That extension is mad e by inserting basic flow parameters such as relative permeabilities, capillary pressure and residual oil saturations. These flow parameters are generated in the laboratory by special core a nalysis (SCAL) experiments . One of the most common SCAL experiment s is the Welge or UnSteady - State (USS) technique. A core plug is prepared at an initial water and oil saturation , representative of SCA2011 - A014 2 the relevant reservoir unit. Subsequently, water is injected to mimic a water drive. The pressure drop is measured together with the produced oil and water. From these data after water breakthrough, the relative permeability to wa

2 ter and oil as a function of saturation
ter and oil as a function of saturation can be derived through an anal ytical approach like the JBN [ 1 ] method. A limitation of the USS technique is th at the relative permeabilities can only be determined for saturations above the Buckley - Levere tt [ 2 ] shock - front saturation. This limitation is overcome by the Steady - State method where oil and water are injected simultaneously, at varying fractional flow. Relative permeabilities are derived through a straight inversion of Darcy's equation for each phase. However, both JBN and the inversion of Darcy's equation assume that capillary forces are absent. Particularly at saturations close to the residual oil sat uration S orw , this assumption is violated and the oil production is severely hampered by a capillary end - effect inside the core plug. Eventually, oil flow will stop due to the capillary forces, while the oil saturation is actually significantly above resid ual. Since the analytical methods mentioned above are unaware of capillary forces, zero oil flow incorrectly is interpreted as reaching residual oil saturation. This remaining oil saturation is often 10 to 15 saturation u nits higher than true residual. Cle arly, this data interpretation problem is a big issue when IOR or EOR targets need to be established in mature water flood fields. To account for the capillary end effect, capillary (imbibition) curves need to be measured. Porous Plate (PP) experiments an d centrifuge experiments are used for that. The measurement protocols require an equilibration time at each pressure step in PP or at each speed step of the centrifuge to establish hydrostatic equilibrium at zero flow. A direct data inversion in PP or a so mewhat more involved method like Hassler - Brunner [ 3 ] for centrifuge experiments will then deliver the capillary pressure function. It is interesting to note that these analytical data inversions to extract capillary pressure fr o m production data in PP or c entrifuge, assume that relative permeabilities can be neglected. Similar to the situation in relative permeability measurements, the assumption is certainly violated at residual oil , using finite equilibration times . To properly analyse the situation, one would need to measure these relative permeabilities first. Therefore, we see that in SCAL experiments relative permeability and capillary pressure are mutually interfering and obscur e the true data particularly for saturations close to residual oil, and vi ce versa close to connate water. Initially there have been attempts to expand the analytical procedures by introducing (estimates for) correction functions. Eventually, it was understood by several authors [ a.o. 4 , 5, 6 ] that the interference between rela tive permeabilities and capillary pressure was best unraveled by forward modeling of the experiments. An iterative procedure is used to arrive at a simultaneous match of flow and PP or centrifuge experiments with one common data set for relative permeabili ty and capillary pressure. To pro

3 mote this appro ach, at no cost Shell
mote this appro ach, at no cost Shell in the late nineties made available SCORES, a web - based interface to MoReS, Shell's proprietary simulator. SCORES allowed simulation of USS (imbibition only) , SS and centrifuge multi - spe ed and single - speed experiments [ 7 ] . Th is service was available until 2010. Meanwhile, very few commercial simulators are SCA2011 - A014 3 suitable for simulation of SCAL experiments on the scale of the laboratory i.e. on core plugs of just a few centimeters long and wide [8] . The present paper presents a successor to the Shell tool, now based on the open source simulator DuMu x , extending the original tool to incorporate not only USS, SS and centrifuge, but also PP and Continuous Injection (CI) [ 9 ]. DuMu x includes the meas urement of the resistivity index (RI) for PP and CI , to facilitate a detailed analysis of RI laboratory measurements. Another extension is that USS now also can be run in drainage mode. The new SCORES internet interface again is available at no cost. In t his paper, w e will first discuss the general characteristics of DuMu x . Subsequently, modeling details are presented for the USS, SS, centrifuge, PP and CI methods. We will then present a validation of DuMu x , comparing simulations with analytical results an d results ob tained previously with MoReS. We will also present results for PP and CI and relate these to actual laboratory measurements. DUMUX CHARACTERISTICS DuMu x is a simulator for flow and transport processes in porous media [ 10 ] , licensed under the t erms and conditions of the GNU General Public License (GPL ) version 2 or later [11 ] . Stable releases are available for download [12 ], and anonymous read - access to the Subversion repository is granted. DuMu x is built on top of DUNE , the Distributed and Unif ied Numerics Environment, a modular toolbox for solving partial differential equations with grid - based methods [ 1 3 ] . The development of DUNE is a joint effort of five research groups located at German and English universit ies . Its user base is growing , and a first DUNE user meeting in October 2010 was attended by 30 scientists from 16 research groups out of 4 European countries. The DUNE module DuMu x includes several standard models of varying complexity, ranging from stationary isothermal single - phase si ngle - component flow to transient non - isothermal multi - phase compositional flow. Active research is currently undertaken to include multi - scale and multi - physics concepts, as well as non - standard formulations like multiple continua approaches or models invo lving interfacial area as a primary state variable. All models employ efficient nonlinear solvers in close combination with sophisticated time step management. The capabilities of DUNE are heavily exploited to offer various spatial discretization schemes a s well as the possibility of parallel computations. The applications currently targeted by DuMu x include fuel cells, groundwat

4 er remediation, evaporation from partia
er remediation, evaporation from partially saturated soils, CO 2 storage, and drug delivery into human tissue. Several scientists f rom diverse areas of expertise (computer science, engineering, mathematics) are involved in the code development. Since the first release in July 2007, over 200 certified release downloads have been counted, and direct contact to several users has been est ablished. As part of the Open P orous Media (OPM) initiative [14 ], the development of DuMu x is partially funded in a joint industry project. SCA2011 - A014 4 The numerical models implemented in DuMu x can be distinguish ed as decoupled semi - implicit and coupled fully - implic it approaches . For the SCAL simulation of this study, the latter approach is used for modeling two - phase immiscible isothermal porous media flow and transport. As spatial discretization, a vertex - centered finite volume scheme (box method ) i s used. An impli cit Euler scheme is applied for the temporal discretization. MODELING DETAILS Similar to reservoir simulation models, a SCAL core plug needs to be discretised into cells or grid blocks. MoReS employs a finite difference scheme where equations are solved at the centr e points of the grid blocks. DuMu x employs a control volume finite element scheme and the coupled material balance and flow equations are solved at each node on the grid, where the nodes are located at the corner points of each cell or grid blo ck. Both MoReS and DuMu x are fully implicit simulators. Gridding We have chosen a common set - up for the gridding for all experiments. Based on previous experience with MoReS, the core plug in a SCAL experiment is divided into rectangular cells. Basically the grid blocks are in 1 - D, but each has nodes left and right if the plug is vertical. The solutions of the equations on the left and right sides will be identical. The bulk of the grid blocks are evenly spaced by a constant  z, z being the vertical co - ord inate. Near in - and out - flow ends, spacing is refined over 4 grid blocks, according to 0.1  z (at outer end), 0.2  z, 0.4  z and 0.8  z [ 7 ]. The user specifies the total number of blocks N for the core plug and DuMu x has been adapted to calculate t he appro priate  z such that , with the refinement cells included , the total length of the core plug is covered with N blocks . Gravity For imbibition or drainage, injection is always set for gravity stable displacement in line with laboratory practice. For ease of programming and code maintenance, production is always at the lowest numbered block and injection is always at the highest numbered block. To make this possible, the sign of gravity is flipped when choosing between drainage and imbibition to account for th e density difference . The user may opt to have the plug mounted horizontally, in which case g is set to zero. As mentioned above, the gridding of the core plug is common to all SCAL experiments. The differences between the

5 simulation set - ups are in the ch oice
simulation set - ups are in the ch oice for boundary conditions. We will discuss these for each experiment individually. UnSteady State S imulations A constant flux boundary condition is programmed at the in - flow end and a constant pressure boundary condition is programmed at the out - flow e nd . Capillary pressure at the SCA2011 - A014 5 outer nodes is set identically to zero to simulate the chamber in the flanges 1 . All the other nodes have the read - in capillary pressure . Other user input includes the water and oil relative permeability k rw and k ro tables as a function of water saturation S w , absolute permeability K abs , porosity , water and oil density and viscosity and IFT between water and oil. IFT is used when the user specifies a dimensionless table for the Leverett - J [ 1 5 ] function, rather than a direct tabl e of the capillary pressure. DuMu x calculates at each time step the individual phase pressure at each node. Consequently, the pressure difference between the (first+1) node and the (last - 1) represents the pressure difference that would be measured in the laboratory when water - wet and oil - wet filters in pressure taps are used, while the pressure difference between the outer nodes corresponds to the pressure difference measured in the laboratory with pressure transducers connected without filters to the oute r flanges. At each time step the differential pressures, injection and production flow rates, cumulatives and mean saturation is printed into an E xcel file. At time levels indicated by the user, a satura t i on profile along the core is printed into a second E xcel file. As an extension to the original SCORES set - up, the USS simulations allow both imbibition (injection of water) and drainage (injection of oil), under gravity stable conditions. Steady State S imulations As with USS, a constant flux boundary con dition is set at the in - flow face and a constant pressure at the out - flow face , and zero capillary pressure is set at both end - faces . Differential pressure, data on produced liquids and saturation profiles are printed into Excel files as for USS. Centrifu ge S imulations A constant pressure boundary condition is programmed at the exit face at a value p 0 , and zero capillary pressure is set at both end - faces . For the entry face, a nother constant pressure boundary condition is set at p 0 +  i gH. H equals the len gth of the core plug; g depends on the rotational speed setting of the centrifuge and  i represents the density of water in imbibition runs and the density of oil in drainage runs. The user will specify the rotational speed in a table indicating speed vers us time switch points. g is then calculated within DuMu x as g = ω 2 , with ω = 2π  ,  being the rotational frequency in s - 1 ; and r being the distance to the centre of rotation. Note that r is different for each node. The user needs to supply only the distan ce of the centre of the plug to the centre of rot

6 ation. In the laboratory, a centrifuge
ation. In the laboratory, a centrifuge will not immediately spin at the next speed when the setting is changed. This start - up time characteristic can be obtained from the centrifuge manufacturer and needs to be taken into account because at high permeabilities the effect 1 To the best of our knowledge, the Hassler - type cells that are used in the industry either have circular of spiralling grooves, or "spider web" grooves in the end flanges . This e f fectively brings about a zero capillary pressure boundary condition. SCA2011 - A014 6 of start - up time is very noticeable. DuMu x has been programmed to adjust speed as a function of t ime according to user input. A footbath 2 is simulated by setting S w =0 at the exit nodes for im bibition runs and S w =1 for drainage runs as an extension of the boundary conditions. PP S imulations The gridding is extended to cover the porous plate with 10 or more grid blocks (dependent on the thickness specified by the user), with a separate refineme nt scheme similar as discussed above for the core plug proper , i.e. smaller grid blocks near the end - faces . The plate grid blocks are an addition to the core plug gridding, so the number of grid blocks requested by the user for the plug proper is still hon oured. The capillary pressure for the porous plate is derived from a fixed dimensionless table (see Table 1), that is scaled according to the entry pressure given by the user. Also k rw and k ro are fixed for the porous plate itself in terms of Corey funct ions [ 16 ] with parameters as listed in Table 2. Note that a critical oil saturation is used: this represents the percolation threshold for the porous plate and has been fixed at 0.05. The simulation results were found to be not sensitive to the exact value . Entry and exit b oundary conditions are similar to the drainage centrifuge case , except that g is now constant and the entry pressures are set according to a user supplied time table. O utput of the simulations is similar to USS. CI S imulations Gridding for CI is similar to gridding for PP. The constant injection rate is modeled by programming a constant flux boundary condition at the entry face, similar to the USS set - up. Also similar to USS (or CI for that matter), at the exit a constant pressure bound ary condition is programmed. As for CI, the output of the simulations is similar to USS. VALIDATION OF DUMUX FOR SCAL We have validated DuMu x for the simulation of SCAL experiments by a two - step approach. First we compared simulation results against analy tical calculations. In this way we obtained a good starting position for the second step in the validation process: comparison with its predecessor MoReS. Comparison With Analytical C alculations At zero capillary pressure P c , the outcome of SS simulations can directly be validated against Darcy's law, after equilibrium is achieved. Pressure drop and saturations were found to duplicate

7 the analytical predictions. After that,
the analytical predictions. After that, we calculated analytically (again with P c =0), using Buckley - Leverett theory [ 2 ], th e production behaviour of USS experiments, pressure drop development, water breakthrough and saturation profile 2 To prevent back flow and also to better define experimentally the boundary condition at the out - flow face, a so - called footbath may be mounted. SCA2011 - A014 7 development over time. We obtained excellent agreement between theory and DuMu x simulation results , as shown in Fig. 1 where we compare runs wit h 50 and 500 grid blocks to the analytical solution for the pressure drop  P(t). We also sh ow that sensitivity was observed to the interpolation of the relper m tables: a good agreement was only obtained with a 20 - data - pair table. Finally, we verified multi - speed centrifuge runs at equilibrium levels against the inputted capillary pressure. Single - speed centrifuge simulations were verified against analytical production profiles as predicted by Hagoort's theory [ 1 7 ], with capillary pressure set to zero and th e viscosity of the invading phase set to a fraction of 10 - 3 of the v i scosity of the displaced phase (in line with Hagoort's assumptions). This proved again that our implementation of gridding and boundary conditions provided a good simulation tool for thes e simplified cases. Comparison W ith MoReS MoReS results on selected SCAL data sets have been published on the web already many years ago, actually through the SCA web site www.scaweb.org . Three sets of simulation resu lts files are available as a demonstration of USS, SS and centrifuge multi - speed simulations. The sets present production profiles, i.e. flow rates, cumulatives, pressures and dif f erential pressures and average saturation. Separate files for USS and SS als o present saturation profiles in the core plug at selected time levels. The files include inp ut data for the individual runs, and all cases have a non - zero capillary pressure. We have used the same input data as in the three demo sets, and verified for ea ch of the se how DuMu x duplicated the results. Only minor deviations were observed. As an example we present the production profile of the demo mu lti - speed centrifuge run (Fig. 2 ). DuMu x duplicates the results produced by MoReS within 5%. A detailed study w as carried out to ensure that the observed differences were not caused by effects hidden in the simulator and that could amplify later in more complicated cases. Again, i t was found that a primary source for the deviations was located in the interpolation routines used for the relative permeability and capillary pressure tables . The interpolation used by MoReS, Shell's proprietary simulator, has not been documented in the open literature . For DuMu x , we employ spline functions with preserved monotonicity , pr ogrammed with routines found in the public domain [ 1 8 ], based on an algorithm developed by Fritsch and Ca

8 rson [ 1 9 ]. Fig. 2 shows the resu
rson [ 1 9 ]. Fig. 2 shows the results by DuMux for the standard data set and for a data set where we have populated the tables for k rw , k ro and P c each w ith one hundred data - pairs to reduce the effect of interpolation. Clearly, dependent on the saturation range, the production curve for the high - resolution case is shifted up or down with respect to the base case. The deviations are around 3%. It is interes ting to note that difference in interpolation can move a production curve with this error margin. Not only does this limit the accuracy that one can hope to achieve in history matching SCAL experiments in general, it also points to an essential range of un certainty in simulations on the scale of the field. Finally, we point out that a second reason for the deviations may well be found in the fact that MoReS is working with a finite difference scheme, where variables are calculated at SCA2011 - A014 8 the centre of each gri d block, while DuMu x calculates variables at the nodes that span a grid block, so at the grid block corners. POROUS PLATE AND CONTINUOUS INJECTION SIMULATIONS We have employed DuMu x to study porous plate and continuous injection measurement protocols. Bo th methods are in use to measure the resistivity index. In addition, the porous plate is in use to prepare samples at initial conditions in an attempt to achieve a more flat saturation profile than generated by the centrifuge technique, while still generat ing an imbibition capillary pressure curve. Porous Plate The porous plate experiment resembles a multi - speed centrifuge experiment in the sense that the pressure at the in - flow end is increased in a step - wise manner and equilibrium has to be established t o take a reading for the capillary pressure. Contrary to the centrifuge technique, it is assumed that at equilibrium the in - situ saturation profile is homogenous 3 . Therefore, at equilibrium, the combined pressure drop across the sample and the porous plate at equilibrium is equated to the capillary pressure at that saturation. Moreover, resi s tivity across the sample is accepted as belong ing to that same saturation. In practice, as with the centrifuge technique, equilibrium is not always achieved. I n Fig. 3 , we present a typical laboratory measurement of the porous plate technique. Due to operational reasons, the injection pressure was switched to the next step before the production curve flattened out. To study the impact of non - equilibrium, we have simulat ed this experiment with DuMu X . In order to obtain a good mat ch between simula t i ons and experiment, we had to shift the capillary pressure at lower S w considerably (Table 3 ). In the absence of additional SCAL data, we used assumed relative permeability curv es [ 7 ] . Both the relative permeabilities and the capillary pressure had to be adjusted to arrive at the match, so the results are only indicative for the sensitivity to the violation of the equilibrium assumption. In any case, the "true" co

9 nnate water satu ration S cw is defi
nnate water satu ration S cw is definitively lower than initially reported from the raw data. The simulations allow us to "look inside" , because the in - situ profiles for saturation and pressure (for the individual phases, as well as for Pc) are printed to file at each time step if so specified. Some general observations: - Dependent on the shape of the relative permeabilities, a shock front is seen to travel through the core at an early stage of the experiment. - Later in the experiment, when the mid - saturation range is pro bed at higher P c , the saturation distribution remains more flat, when moving from one pressure level to the next. 3 Note that for an analytical interpretation of the multi - speed centrifuge technique, the Hass ler - Brunner [3 ] correction is applied to account for the saturation distribution. SCA2011 - A014 9 - At the end of the experiment, high oil saturations may build - up near the out - flow end, because the porous plate keeps blocking oil to leave the plug. The saturation distribution may become quite heterogeneous. Fig. 4 shows a typical case. From these observations, we conclude that - Already in the early stages of the experiment, it is important to wait for equilibration. Otherwise, a shock fro nt still moving may distort the saturation profile and both the P c and the resistivity data are inaccurate. - When probing the mid - saturation range, equilibration times may be shortened because even transient saturation profiles tend to be flat. - The buil d - up of high oil saturations near the out - flow end hamper s the flow of water that leaves the core plug through the water - wet porous plate. Therefore, at increasingly higher oil saturations, equilibrium is reached at longer and longer equilibration times. C ontinuous Injection Porous Plate experiments can take typically between 2 to 6 months dependent on K abs and P c . To accelerate these measurements, Shell has proposed in the 80's a modification: the Continuous Injection method [ 9 ]. The CI protocol requires injection at constant rate rather than at constant pressure. The rate is chosen in the order of 1 MOV (Movable Oil Volume) in two weeks. As with the PP method, a porous plate is mounted in direct contact with the core plug at the exit. The original aim was to accelerate resistivity index measurements for water - wet samples . However, in the case that capillary forces dominate viscous forces, the pressure drop across the plug will approximate the capillary pressure and can be determined as a function of satura tion as the experiment progresses. As was the case for PP, for the resistivity measurements to be valid, it is necessary that the saturation profile is reasonably flat in the core plug. In other words: it is implicitly assumed in CI that capillary forces s tretch the saturation profile into a flat profile. However, contrary to PP, viscous forces will be present and the measurement is essentially dyn

10 amic. Certainly at high oil saturations
amic. Certainly at high oil saturations, oil may build up against the porous plate like in PP experiments. So, a n assurance is needed that the saturation profile is reasonably flat during the measurements . Simulations of the experiments will be useful in the design of a particular CI protocol for an individual plug. Fig. 5 shows the differential pressure for a syn thetic data set for a typical water wet case, as a function of the average saturation, predicted by DuMu x . Three different injection rates were chosen, roughly one order of magnitude slower in each case . The plot also shows the actual capillary pressure cu rve used as input. At the highest rate, viscous forces dominate capillary forces already early in the experiment, and even the plateau value is affected. For the slowest rate, the pressure differential approximates the true capillary curve quite well , but the apparent S cw is still significantly higher than the true S cw . Simulations of the experiment are necessary to aid in the interpretation of the differential pressure as a capillary pressure measurement. SCA2011 - A014 10 Fig. 6 shows the calculated resistivity curve, tog ether with the inputted resistivity curve, for the same speeds as used in the numerical experiment of Fig. 5. The rate effect is significant: at high speed the curve is strongly curved, while the underlying saturation exponent has just a constant value of 2. This shows the power of simulating CI experiments: a wrong design for a measurement may result in data biased by a heterogeneous saturation distribution. For an analytical analysis of this phenomenon, we refer to [20]. CONCLUSION S - SCAL simulations ar e sensitive to the type of table interpolation technique used for relative permeabilities and capillary pressures. We recommend that full scale reservoir simulations be tested for the impact on project performance of this phenomenon. - The measurement of w ater and oil relative permeabilities in drainage mode will assist in optimising a Porous Plate measurement protocol for specific flow units reducing measurement time as well as improving measurement accuracy of P c and resistivity. - Capillary pressure meas ured with the Porous Plate method, without interpretation - by - simulation is likely to give too high values for S cw and correspondingly too high Pc at lower water saturations in general. - The Porous Plate method does not necessarily provide a flat saturatio n profile at low initial water saturation. - Although the Continuous Injection method originally was n ot designed to provide Pc data, a limited part of the Pc curve is accessible. - Resistivity measurements with the CI method are sensitive to the injectio n rate. Simulations can be used to design the experiment . - There is a risk that r esistivity measurements with the Continuous Injection method access a saturation range that is smaller than can be obtained with the Porous Plate method. Simulations can be u sed to optimise the protocol. DuMu

11 x through our user interface SCORES is
x through our user interface SCORES is available at www.jgmaas.com/scores . In line with the philosophy of GPL(2), simulations are provided free of charge. A password can be req uested through the web site. Each experimental SCAL protocol is addressed by an individual web page with a common look and feel. Additional information is provided through links on the various web pages. REFERENCES 1. Johnson, E.F., D.P. Bossler and V.O. Naumann, "Calculation of relative permeability from displacement experiments", Trans. AIME 216 (1959) 370 - 372. 2. Dake, L.P., Fundamentals of Reservoir Engineering , Elsevier, Amsterdam (1978). 3. Hassler, G.L. and E. Brunner, "Measurement of capillary pres sures in small core samples", Trans. AIME (1945) 160 , 114 - 123. 4. Kokkedee, J.A. and V.K. Boutkan, "Towards measurement of capillary pressure and relative permeability at representative wettability", in New Developments in Improved Oil Recovery , de Haan, H .J. (ed.), Geological Society Special Publication 84 (1995) 43 - 50; also available in Proceedings of the Seventh European IOR Symposium , Moscow (Oct 27 - 29, 1993). 5. Jennings, J.W., D.S. McGregor, and R.A. Morse, "Simultaneous determination of capillary pre ssure and relative permeability by automatic history matching", SPE 14418, 60th SPE Annual and Technical Conference and Exhibition (Sept. 22 - 25, 1985). SCA2011 - A014 11 6. Nodtvedt, J.E., H. Ukedal, E. Ebeltoft, K. Kolltveit, E.B. Petese, A. Sylte, R. Valestad, “The Sigificace of Violated Assumptios o Coe Aalysis Results”, SCA - 9931, presented at the Intl. SCA Symposium in Golden, CO (August 1 - 4, 1999) . 7. Maas, J.G., ad A.M. Schulte, “Compute simulatio of Special Coe Aalysis (SCAL) flow expeimets shaed o the Iteet”, SCA - 9719, presented at the Intl. SCA Symposium in Calgary (September 1997). 8 . Examples are PORLAB by D&B Ruth Ente rprises , SENDRA (www.weatherford.com) and CYDAR (www.cydarex.fr). 9 . De Waal J.A., R.M.M. Smits, J.D. Graaf, B.A. Schipper , " Measurement and Evaluat ion of Resistivity Index Curves" , SPWLA, 30th Symposium (June 1989). 10 . Flemisch, B., M. Darcis, K. Erberts eder, B. Faigle, A. Lauser, K. Mosthaf, S. Müthing, P. Nuske, A. Tatomir, M. Wolff, ad R. Helmig, “UMUX: UNE fo Multi - {Phase, Component, Scale, Physics, ...} Flow and Transport i Poous Media,” Advances in Water Resources , (2011), in press. 11 . GNU G eneral Public License version 2, www.gnu.org/licenses/old - licenses/gpl - 2.0.html . 12 . DuMu x web site, www.dumux.org . 1 3 . Bastian , P., M. Blatt , A. D edner , C. Engwer , R. Klöfkorn , R. Kornhuber , M. Ohlberger , and O. Sander , “A generic grid interface for parallel and adaptive scientific computing. II. I mplemetatio ad tests i UNE”, Computing , (2008) 82 , 2 - 3, 121 - 138. 14 . The Open Porous Media (OPM) i nitiative, www.sintef.no/Projectweb/GeoScale/S

12 imulators/OPM/. 1 5 . Collins, R.E.,
imulators/OPM/. 1 5 . Collins, R.E., Flow of Fluids through Porous Materials , Penwell Publishing Company, Tulsa, OK (1976). 16 . http://www.jgmaas.com/scores/ facts.html 1 7 . Hagoot, J., “Oil Recovey by Gavity aiage”, Society of Petroleum Engineers Journal ( 1980), 139. 1 8 . H. Berland in: public.ict.sintef.no/opm/hg/dune - cornerpoint/file/tip/common/MonotCubicInterpolator.cpp 1 9 . Fritsch , F.N. and R.E. Carl son, "Monotone piecewise cubic interpolation", SIAM J. Numer. Anal. , (1980) 17 (2) , 238 - 246 . 20. Maas, J.G., N. van der Post, K.H. van der Gyp, J.G.C. Coenen and W.J. Looyestijn, "Resistivity index measurements under weak capillary forces", SCA2000 - 18, pre sented at the Intl. SCA Symposium in Abu Dhabi (October 2000) Table 1 . Dimensionless capillary pressure used for the porous plate in the PP and CI simulations. Pc is scaled according to user defined entry - pressure. S w 0. .1 .15 .18 .20 .75 .80 .90 .97 .98 .99 1. P c_plate 10 3 10 2 20 2 1.5 1.2 1.1 1.01 1. .3 .1 0. Table 2. Water - wet Corey parameters used for the drainage water and oil relative permeabilities for the porous plate in the PP and CI simulations. Note that for drainage, Sor in the Corey formul ation 4 for the water relative permeability is set to zero, while for the oil relative permeability a critical oil saturation is set to account for the percolation threshold. S cw S or n k r_endpoint k rw 0.05 0. 5 1. k ro 0.05 0.05 2 .7 Table 3 . Original P c and adjusted P c for an actual Porous Plate experiment. Note that the history match of the measurements indicated that the lowest two saturations needed to be reduced. This effective ly lowers the P c at low water saturation and is to be expected when equil ibrium was not achieved in the PP experiment. P c (bar) 12.41 5.52 2.77 1.72 .97 .55 .28 .14 .07 0. S w orig .195 .419 .641 .833 .915 .963 .971 .975 .982 1 . S w adj .1 .35 .641 .833 .915 .963 .971 .975 .982 1 . 4 We use as Corey formulation [16 ] for phase i: k ri (S i ) = k r_endpoint * ( (S - S ic )/(1. - S cw - S or ) ) n SCA2011 - A014 12 Fig. 1 Comparison of DuMu X with 50 and 500 grid blocks vs analytical for an USS experiment . With 13 data pairs relperm tables a deviation is observed. Fig. 3 Match of Porous Plate laboratory data. Curvature is dominated by k r 's; levels are dominated by P c table. Fig. 5 Continuous Injection. S ynthetic case, rate dependency of differential pressure. Fig. 2 Validation of DuMu x simulations against MoReS for the centrifuge demo data set. Effect of densely spaced table interpolation. Fig. 4 Heterogeneous saturation profile at end of the experim ent shown in Fig. 3. Fig. 6 Continuous Injection. Synthetic case, rate dependency resistivity measu