

Chong Ho Yu Crime hot spots How can criminologists find the hot spots Data reduction Group variables into factors or components based on peoples response patterns PCA Factor analysis Group people into groups or clusters based on variable patterns ID: 708752
Download Presentation The PPT/PDF document "Cluster analysis" is the property of its rightful owner. Permission is granted to download and print the materials on this web site for personal, non-commercial use only, and to display it on your personal computer provided you do not modify the materials and that you retain all copyright notices contained in the materials. By downloading content from our website, you accept the terms of this agreement.


Slide1
Cluster analysis Chong Ho YuSlide2
Crime hot spotsHow can criminologists find the hot spots?Slide3
Data reductionGroup variables into factors or components based on people’s response patternsPCAFactor analysisGroup people into groups or clusters based on variable patterns
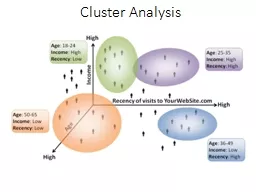
Cluster analysisSlide4
Why do we look at grouping (cluster) patterns?Consider this example: This regression model yields 21% variance explained.The p value is not significant (p=0.0598).
But remember we must look at (visualize) the data pattern rather than reporting the numbers only.Slide5
These are the data!Slide6
Regression by clusterFit a line for each clusterSlide7
Regression by clusterSlide8
CA: ANOVA in reverseIn ANOVA participants are assigned into known groups. In cluster analysis groups are created based on the attitudinal or behavioral patterns with reference to certain independent variables.Slide9
Discriminant analysis (DA)There is a test procedure that is similar to cluster analysis: Discriminant analysis (DA)But in DA both the number of groups (clusters) and their content are known. Based on the known information (examples), you assign the new or unknown observations into the existing groups.Slide10
Eye-balling? In a two-dimensional data set (X and Y only), you can “eye-ball” the graph to assign clusters. But it may be subjective. When there are more than two dimensions, assigning by looking is almost impossible, and so we need cluster analytical algorithms.Slide11
Type of Cluster analysisSpecific:Normal mixtures: need numeric variables and data come from a mixture of multivariate normal distribution.Latent class analysis: need categorical variables
General:K-mean clusteringDensity-based clusteringHierarchical clusteringTwo-step clusteringSlide12
K-meanSelect K points as the initial centroidsAssign points to different centroids based upon proximityRe-evaluate the centroid of each group
Repeat Step 2 and 3 until the best solution emerges (the centers are stable)Slide13
Sometimes it doesn’t make senseData set: regression by cluster.jmpAnalyze Clustering K means clusterSlide14Slide15
Do these 2 groups make sense?Out put the cluster result by Save Cluster Formula.Graph Graph Builder Put Y into Y-axisPut X into X-axisPut Cluster Formula into overlaySlide16
Do these 2 groups make sense?Slide17
Density-based Spatial Clustering of A
pplications with Noise (DBSCAN)Available in SAS/StatInvented in 1996In 2014 the algorithm won the Test of Time Award at Knowledge Discovery and Data Mining Conference.Slide18
Density-based Spatial Clustering of A
pplications with Noise (DBSCAN)Unlike K-mean, it can discover clusters in any shape, not necessarily an ellipse based on a centroid.
Clusters
are grouped by data
concentrations
, meaning that dense and spare areas are separated
.
Outlier/noise excludedSlide19
Hierarchical clusteringGrouping/matching people like what e-harmony and Christian-Mingle do. Who is the best match? Who is the second best? The third…etc.Slide20
Hierarchical clusteringTop-down or Divisive: start with one group and then partition the data step by step according to the matricesBottom-up or Agglomerative
: start with one single piece of datum and then merge it with others to form larger groups Slide21
Hierarchical clusteringData set: MBTI.jmpMBTI is a measure of personalityAnalyze Clustering
Hierarchical clusteringSlide22
Hierarchical clusteringHC can work with Multidimensional scaling (MDS) on some data sets.MDS is a way of visualizing the level of similarity of individual cases of a
data matrix (rows and columns are the same). Bonney, L., & Yu, C. H. (2018, January). Sharing tacit knowledge for school improvement. Paper presented at International Congress for School Effectiveness and Improvement, Singapore.Five superintendents reviewed 68 statements regarding leadership in education, and decided which concepts are related by pairing them.Slide23
Hierarchical clusteringThe numbers show the frequency of pairing.e.g. Two superintendents said that S2 and S4 are conceptually related.
S4 is related to itself and so the default count is 5.Slide24
Hierarchical clusteringBased on the result it was decided that there should be 5 clusters.Assign the number of clustersAssign a different color to each cluster.Slide25
Hierarchical clusteringAnalyze Multivariate Methods Multidimensional scalingData format = Attribute list (distance matrix is constructed from the correlation structure)Slide26
Compare HC and MDSHC and MDS agree with each other to a large extentBut there are some discrepanciesSlide27
Compare HC and MDSDiscrepancy is good! Always triangulate with more than one method.The results are different. Should you side with HC or MDS?Quantitative methods cannot resolve it.Read the statements and determine which statement can
conceptually (qualitatively) fit into which cluster.Slide28
Assignment 7.1Use JMP sample data: Crime.jmpRun a hierarchical clustering by including all crime rate.Set the number of cluster to 5.Assign a different
color to each cluster.Open Graph Builder and put state into Map ShapeAre crime rates clustered by location?Subset the “orange” clusterWhat are their common characteristics in terms of crime rate? Why?Slide29
Two-step clustering
Example: Clustering recovering mental patientsTse, S., Murray, G., Chung, K. F., Davidson, L., Ng, J., Yu, C. H. (2014). Differences and similarities between functional and personal recovery in an Asian population: A cluster analytic approach.
Psychiatry: Interpersonal and Biological Processes, 77
(1), 41-56.
DOI: 10.1521/psyc.2014.77.1.41Slide30
Two-step clustering
What are the relationships between subjective and objective measures of mental illness recovery?What are the profiles of those recovered people in terms of their demographic and clinical attributes based on different configurations of the subjective and objective measures of recovery?Slide31
Subjective recovery scale (E2 Stage model)Slide32
Subjective recovery scaleSlide33
Subjective recovery scaleSlide34
Objective scale 1: Vocational status
The numbers on the right are the original codes. They were recoded to six levels so that the scale is ordinal. e.g. Employed full time at expected level is better than below expected level.Slide35
Objective recovery scale 2: Living status
The numbers on the right are the original categories. They were collapsed and recoded so that the scale is converted from nominal to ordinal. e.g. Head of household is better than living with family under supervision.Slide36
Participants
150 recovering or recovered patients (e.g. bipolar, schizophrenia) in Hong Kong.Had not been hospitalized in the past 6 months.Slide37
Analysis: Correlations among the scales
The Spearman’s correlation coefficients are small but significant at the .05 or .01 level. However, the numbers alone might be misleading and further insight could be unveiled via data visualization. Slide38
Data visualization: Linking and brushing
The participants who scored high in the subjective scale (E2) also ranked high in the current residential statusBut they are all over the vocational status, implying that the association between the subjective scale and the vocational status is weak.Slide39
Data visualization: Linking and brushing
The reverse is not true. The subjects who scored high in the residential status (3) spread all over in the subjective scale (E2) and the vocational statusSlide40
Data visualization: Heat mapView data concentrationSlide41
Data visualization: Heat mapSlide42
Two-step cluster analysis
In this study one subjective and two objective measures of recovery were used to measure the rehab progress of the participants.
Two-step
Step 1:
To
avoid unnecessary complexity
, cluster analysis condenses the dependent variables by proposing certain initial clusters
(pre-clusters
).
Step 2: Make final clustersSlide43
Two-step cluster analysis
Available in SPSSUse AIC or BIC to avoid complexity
Can take both continuous and categorical
data (vs. K-mean can take continuous data only)
Truly exploratory and data-driven (vs. K-mean prompts you to enter the number of clusters)
Group
sizes are almost equal (vs. K-mean groups are highly asymmetrical) Slide44
IBM SPSS ModelerSlide45
IBM SPSS ModelerSlide46
Cluster quality
Yellow or green: go aheadPink: pack and go homeSlide47
Predictor importanceSubjective feeling doesn’t matter!Slide48
Number of clustersSlide49Slide50
Cluster 5In cluster 5 the grouping by vocational is very “clean” or decisive because almost all subjects in the group chose “employed full time at expected level”. Slide51
Cluster 5Slide52
Cluster 3: MessySlide53
Cluster 5: The best
The clustering pattern suggests that Cluster 5 has the best cluster quality in terms of the homogeneity (purity) in the partition. In addition, the subjects in Cluster 5 did very well in all three measures, and therefore it is tantalizing to ask why they could recover so well. But cluster analysis is a means rather than an end. Further analysis is needed based on the clusters.
Our team found that family income can predict whether the subjects are in Group 5 or others.Slide54
Diamond plotSlide55
Family income: Cause or effect?
Cluster 5 (the best group in terms of both subject and objective recovery) has a significantly higher income level than all other groups.Plausible explanation 1: they recovered and are able to find a full time job, resulting in more income.
Plausible explanation 2: the family have more money and thus more resources to speed up the recovery process. Slide56
Assignment 7.2Data set: Best_college.savLists 400 world’s best colleges and universities compiled by US News and World Report. The criteria include: Academic peer review score
Employer review scoreStudent to faculty scoreInternational faculty scoreInternational students
score
C
itations
per faculty
scoreSlide57
Assignment 7.2Educational researchers might not find the list helpful because the report ranks these institutions by the overall scores. We want to find the grouping pattern (Categorizing the best schools by common threads). Use IBM SPSS Modeler to run a two-step cluster analysis.Use all criteria set by US News and World Report, plus geographical location.