

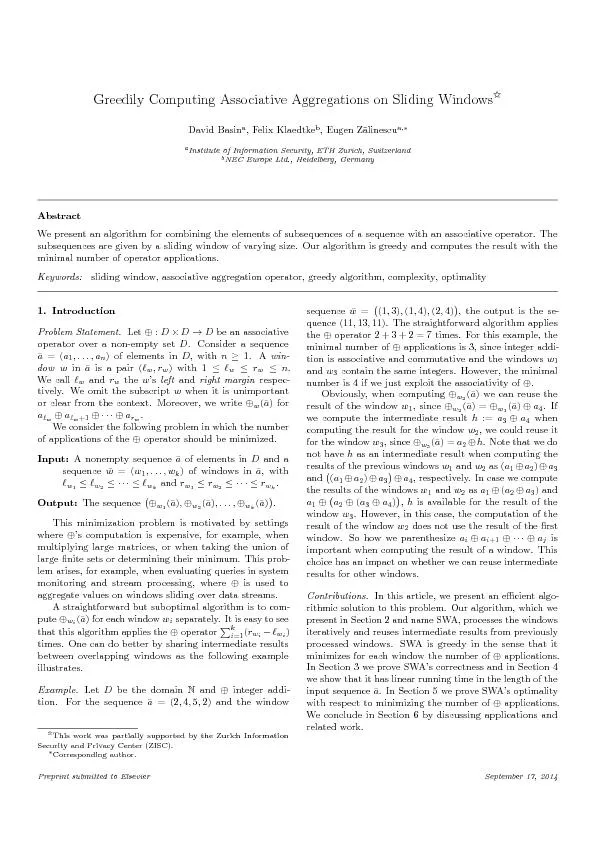
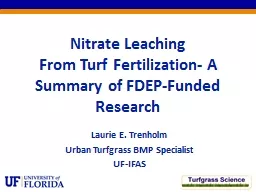
Monday PM David A Reckhow University of Massachusetts Introduction Water treatment engineers and public health officials need to pay careful attention to the presence of dissolved organic matter in water supplies selected for human consumption ie raw drinking waters ID: 459233
Download Presentation The PPT/PDF document "Leaf Leaching Experiment" is the property of its rightful owner. Permission is granted to download and print the materials on this web site for personal, non-commercial use only, and to display it on your personal computer provided you do not modify the materials and that you retain all copyright notices contained in the materials. By downloading content from our website, you accept the terms of this agreement.


Slide1
Leaf Leaching Experiment
Monday PM
David A. Reckhow
University of MassachusettsSlide2
Introduction
Water treatment engineers and public health officials need to pay careful attention to the presence of dissolved organic matter in water supplies selected for human consumption (i.e., raw drinking waters).
For many reasons related to human health and cost, it is necessary to remove a substantial amount of these organic compounds before the water is ready for human use. The cost of doing this is highly variable and dependent on the particulars of the ecosystem from which the raw water originates. In the Northeast US, a large fraction of aquatic organic matter found in lakes and rivers comes from the forest floor. We’re all familiar with organic-rich soils with upper soil horizons containing roots, branches, logs and leaves in various stages of decay. Slide3
Intro (cont.)
Thinking about the fate of plant biomass, many questions come to mind.
How much of this plant biomass degrades to CO2 and H2O in place (i.e., the process of mineralization), how much becomes incorporated in the soil below and how much becomes dissolved in pockets of water and is carried away to groundwater and surface water bodies (i.e., solubilization)? How quickly does this happen and do leaves age and degrade at the same rate for all species under all conditions?
What are the steps in degradation and solubilization? Does decomposition/degradation and solubilization occur at a constant rate, or an increasing or decreasing rate with time? Is there a lag phase?Slide4
Materials
Containers for leaching & imaging
Plastic Culture Flasks (275 mL), Corning #430720; $3.70 each from Fisher ScientificPlastic AquariumKritter Keeper (Large), Lee’s Aquarium & Pet Products$14 from local pet storeScale (reading in grams)I used a postal scale, but top loading balance is betterPlant Biomass
Your backyardTap WaterCamera, computer & ADI softwareSlide5
Leaching DOM from Leaves
About 7 g of leaves in 10 L of water
Good for UV abs, but 20g is better for visual assessment
B: Oak/Maple Aged 7 mo
I: GoldenrodFreshBlank
:
Tap water
No leaves
5Slide6
zcxSlide7
Line Tool: Aquaria
xcz
B
I
BlankSlide8
Aquaria vs
Bottles
Different Pathlengths9 cm for bottles32 cm for aquaria (better for low level leaching)Aquaria still have plant biomassBottles allow separation, or decantation of leaching mixtureAquaria are good for producing large volumes of leachate (~10L) for later testingBottles (Culture flasks) hold ~75 mLSlide9
Photographic Image: Bottles
Blank in middle
Experimental on either side7g/tankprobably too lowWhite background
ID labels belowSlide10
Line Tool
lineSlide11
Line Tool: Color along line
All three
B
I
BlankSlide12
With image
Rectangle ToolSlide13
histogram
Rectangle Tool: I bottle
50Slide14
blank
Rectangle Tool: Blank bottle
64Slide15
B sample
Rectangle Tool: B bottle
42Slide16
Data Analysis
Find location of blue peak for each rectangle on the color intensity scale
Calculate difference between this value and the value for the blank (tap water); this is the “color lost”Plot “color lost” vs leaching timeThis will show the accumulation of released colored organic matter from the leavesSlide17
Leaching Rates
Leaching rates from the scientific literature
Amount released each weekDiminishes with time for some, accelerates for others
From: Magill and Aber, 2000Soil Biology & Biochemistry
, vol. 32, pp.603-613Slide18
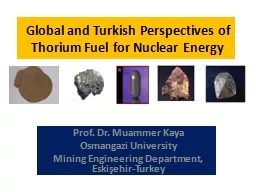
Composition of an “average” leaf
250 g/m
2/yr EABPDave Reckhow
18
Highly-colored
Some colorSlide19
Source:
Terrestrial Ecosystems
Aber & Melillo2nd edition
Harcourt Academic PressVariations based on SpeciesSlide20
Phenolic Acids
Readily released, highly colored
LigninVery slowly released, some colorColored CompoundsSlide21
Simple sugars
Readily released, highly biodegradableStarch
Easily released and also biodegradableCellulose & HemicelluloseSlow to solubilize, not easily degraded
Colorless CompoundsSlide22
Constituents degrade at different rates
“
Solubles” go firstFree carbohydrates are nextBound or Lignified carbohydrates and Lignin are lastSlide23
Solubilization
vs Total Loss
DOC-C loss versus total C loss in mg C.
Y-axis values are mean leached DOC concentration for the 15 week treatment
X-axis values are total C loss from litter.
33%
solubilization
12.5%
Solubilization
Maple
Oak
Pine
Re-drawn from Magill and
Aber
, 2000Slide24
What to Do for the Leaching Tests?
Monday
Step 1: decide on plant material to useStep 2: select and weigh out sufficient biomassI’d recommend something between 20 and 100 gramsStep 3: add biomass to a plastic aquariumStep 4: fill with tap water to 4 cm below topThis will give you a total volume of 10 LitersTuesday, Wednesday, ThursdayCollect one photographic image of aquarium next to blank
FridayCollect final aquarium photo and begin treatment testsSlide25
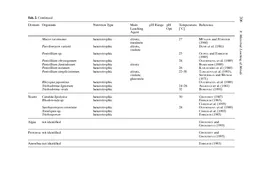
Step 1: Select Leaves
Biomass smorgasbord
Label
Short Description
NotesA
28 Month Aged Oak/Maple litterfall
Partially degraded from 2010 growing season, collected in March 2012
B
19 Month Aged Oak/Maple litterfall
Partially degraded from 2011 growing season, collected in June 19, 2012
C
19 Month Aged Oak on Tree
Collected from Fitzgerald Lake Conservation area on June 23, 2012 – branches that probably fell during the 10/30/2011 storm
D
19 Month Aged White Pine
Collected from Fitzgerald Lake Conservation area on June 23, 2012 - branches that probably fell during the 10/30/2011 storm
E
12 Month Aged Oak
Collected from freshly cut branches on June 23, 2012, aged in bag
F
12 Month Aged Cherry
Collected from freshly cut branches on June 23, 2012, aged in bag
G
Fresh Oak
Collected from freshly cut branches on June 23, 2013
H
Fresh Cherry
Collected from freshly cut branches on June 23, 2013Slide26
Extra Topic: Beer’s Law
Concentration of a pure solution of an absorbing compound is directly proportional to the logarithm of the light intensity for experimental (I) divided by the light intensity for the blank (I
o)This is the “Absorbance”
Fixed value
Fixed value