
Converging to the Real Oceanic Precipitation George J Huffman 1 Ali Behrangi 2 JianJian Wang 3 1 Code 612 NASA GSFC 2 JPL 3 Univ of Maryland ESSIC Earth Sciences Division Atmospheres ID: 761149
Download Presentation The PPT/PDF document "Converging to the “Real” Oceanic Pre..." is the property of its rightful owner. Permission is granted to download and print the materials on this web site for personal, non-commercial use only, and to display it on your personal computer provided you do not modify the materials and that you retain all copyright notices contained in the materials. By downloading content from our website, you accept the terms of this agreement.


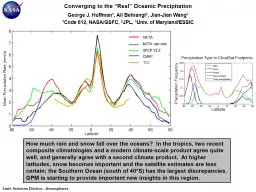
Converging to the “Real” Oceanic PrecipitationGeorge J. Huffman1, Ali Behrangi2, Jian-Jian Wang31Code 612, NASA/GSFC, 2JPL, 3Univ. of Maryland/ESSIC Earth Sciences Division - Atmospheres H ow much rain and snow fall over the oceans? In the tropics, two recent composite climatologies and a modern climate-scale product agree quite well, and generally agree with a second climate product. At higher latitudes, snow becomes important and the satellite estimates are less certain; the Southern Ocean (south of 40°S) has the largest discrepancies. GPM is starting to provide important new insights in this region. Precipitation Type in CloudSat Footprints Latitude Precipitation Frequency Latitude TCC Mean Precipitation Rate (mm/d)
Name: George J. Huffman, NASA/GSFC, Code 612 E-mail: george.j.huffman@nasa.gov Phone: 301-614-6308References:Behrangi, A., G. Stephens, R.F. Adler, G.J. Huffman, B. Lambrigtsen, M. Lebsock, 2014: An Update on Oceanic Precipitation Rate and Its Zonal Distribution in Light of Advanced Observations from Space. Journal of Climate, 27(11), doi:10.1175/JCLI-D-13-00679.1, 3957-3965.Wang, J.-J., R.F. Adler, G.J. Huffman, D.F. Bolvin, 2014: An Updated TRMM Composite Climatology of Tropical Rainfall and Its Validation. Journal of Climate, 27(1), doi:http://dx.doi.org/10.1175/JCLI-D-13-00331.1, 273-284. Data Sources: The MCTA merges precipitation products from TRMM PR, CloudSat CPR, and Aqua AMSR- E. The TCC composites TRMM products from TMI, PR, and TMI-PR combined, and uses the TRMM-based TMPA multi-satellite product for quality control. The TMPA uses TRMM TMI-PR precipitation estimates to intercalibrate the constellation of low-Earth-orbit (leo) microwave satellites, including Aqua AMSR-E, and uses geosynchronous-IR (geo-IR) data. The GPCP product is computed at NASA/GSFC with geo-IR data, leo-microwave data, NOAA TOVS, and Aqua AIRS. CMAP uses many of the same data sets as GPCP . [TMPA and GPCP use surface precipitation gauge data, but this is largely over land and not relevant to this study.] Technical Description of Figures: Left: The Merged precipitation estimate from CloudSat , TRMM, and Aqua (MCTA) compiles histograms of precipitation as a function of latitude over the oceans for the years 2007-2009. CloudSat CPR is used throughout, but cannot estimate higher values of precipitation; TRMM PR (Aqua AMSR-E) is used at low (high) latitudes to capture higher values. The TRMM Composite Climatology (TCC) provides an intelligent consensus for 1998-2012 of the three TRMM instrument products ; the TRMM Multi-satellite Precipitation Analysis (TMPA) providing quality control. The Global Precipitation Climatology Project (GPCP) product is a long-term data set (averaged here for 2007-2009) that uses microwave-calibrated IR and sounding-based precipitation estimates. The CPC Merged Analysis of Precipitation (CMAP) product is a long-term data set (averaged here for 2007-2009) that uses a more averaging-based approach to combining the input data. The various schemes use many of the same inputs, but process them differently. As such, the agreement among most of the products in the tropics appears to show convergence to the correct climatology. This is in contrast to the majority of numerical models, which show higher estimates. Note that the TCC tends low in the subtropics, probably reflecting the declining performance of tropically oriented TRMM algorithms. The spread outside of 40°N-S, particularly in the Southern Ocean, reflects the less-refined state of algorithms at higher latitudes. In particular, the peak in GPCP at 60°S has long been considered suspect. The surprise is the large value of MCTA around 40°S. The subtropical TCC and the “mixed” CloudSat estimates continue to be scrutinized. [After Fig. 4a, Behrangi et al . 2014; TCC added.]Right: At higher latitudes, snow (both by itself and “mixed” with rain) becomes a significant fraction of the precipitation events as depicted by CloudSat. Present retrievals have difficulty depicting such cases, which is a major reason for the disagreement. The GPM Core Observatory, launched in February, 2014, provides advanced observations over the latitudes 65°N-S. These should substantially improve the data bases used in retrievals by providing routine swaths of channels that are sensitive to all rain rates and to snowfall. [This is in contrast to CloudSat, which primarily focused on clouds, only provides sparse sampling from a curtain of data along the satellite track, and saturates at modest precipitation rates.] [After Fig. 2, Behrangi et al. 2014.] Scientific significance, societal relevance, and relationships to future missions: Knowledge of quantitative precipitation amounts over the ocean have two important uses. First, it is a prime component of the global water and energy cycles, since some 75% of the world’s precipitation falls over the ocean. The time/space distributions of the latent heat released in precipitating system and of the return of fresh water to the ocean hinge on accurate precipitation estimates. Second, reliable observationally based precipitation estimates are required to enable accurate validation for numerical prediction systems of weather and climate over the vast expanses of ocean that are essentially devoid of surface precipitation observations. Present-day climate models typically forecast rain amounts that are significantly above the satellite estimates in tropical oceanic areas. Convergence and agreement among the satellite estimates is necessary to establish confidence in their results. Earth Sciences Division - Atmospheres
The 27-Day Rotational Variations in Total Solar Irradiance (TSI) Observations:from SORCE/TIM, ACRIMSAT/ACRIM III, and SOHO/VIRGOJae N. Lee1,2, Robert F. Cahalan2,3, and Dong L. Wu21. JCET/UMBC, 2. Code 613, NASA/GSFC, 3. APL/JHU Earth Sciences Division - Atmospheres Solar irradiance changes with the 11-year solar cycle (SC), associated with variations in solar surface magnetic field. These changes are modulated by a short-term 27-day solar rotation viewed from Earth. The rotational signal is well captured with space-borne total solar irradiance measurements. Fig.1 Solar rotational variations in Total Solar Irradiance d eclining SC23 missing rising SC24 m inimum SC23 maximum TSI at 1 AU (W/m 2 ) Fig.2 SORCE Total Solar Irradiance
Name: Point of Contact, NASA/GSFC, Code 613, JCET/UMBC E-mail: jae.n.lee@nasa.gov Phone: 301-614-6189References: Lee, Jae N., Robert F. Cahalan, and Dong L. Wu. (2015), The 27-Day Rotational Variations in Total Solar Irradiance Observations: From SORCE/TIM, ACRIMSAT/ACRIM III, and SOHO/VIRGO, J. of Atm. and Solar-Terrestrial Physics, in review.Kopp, G., and J. L. Lean (2011), A new, lower value of total solar irradiance: Evidence and climate significance, Geophy. Res. Lett., 38, L01706.Data Sources: SORCE/TIM, ACRIMSAT/ACRIM III, and SOHO/VIRGO Total Solar Irradiance (TSI). We thank the SORCE, ACRIM, and VIRGO teams for providing their data and analysis support. This work is supported by the NASA Living With a Star Targeted Research and Technology Program (NNH10ZDA001N-LWSTRT). Technical Description of Figures: Figure 1: Comparison of the TSI rotational variation from TIM (blue), ACRIM III (green), and VIRGO (red), in W/m2. By applying EEMD (Ensemble Empirical Mode Decomposition) analysis, the 27-day solar rotational variations are clearly identified and characterized by more than 100 rotational cycles. The three independent measurements show excellent agreement in rotational variations (note that the superimposition of three different colors for the three different records is dominated by blue because of the excellent agreement). During (b) solar minimum phase, the amplitudes of the variations are reduced. The amplitudes are 0.8 W/m2, 0.1W/m2, and 0.4 W/m2, during ‘declining phase’, ’minimum phase’, and ‘rising phase’, respectively.Figure 2: Daily averaged TSI measured from TIM. TIM measurement of TSI during the 2008-9 solar minimum established a new TSI value at 1360.8±0.5 W/m2 , 4.6W/m2 (0.34%) lower than space-borne estimates of the quiet Sun TSI made in the previous 25 years [Kopp and Lean, 2011]. After unusually extended minimum, the dual peaks of solar cycle 24 are indicative of the least active cycle in 100 years. At the time of near solar cycle maximum, the degradation of battery performance caused the SORCE data gap from Aug. 2013 to Feb. 2014. SORCE resumed daily solar observations with “Day Only Operations” (DO-Op) Mode, by deploying a new flight software (http://lasp.colorado.edu/home/ sorce/2013/08/19/sorce-spacecraft-status /).Scientific significance, societal relevance, and relationships to future missions: Building an accurate and un-interrupted TSI data record is important for assessing Earth’s radiation budget. Space -borne measurements of TSI with unprecedented accuracy and stability enable us to determine the amount of solar irradiance reaching the top of the atmosphere and how solar irradiance varies in different time scales. Total and Spectral Solar Irradiance (SSI) Sensor (TSIS-1) is planned for launch in the 2017-2018 timeframe. By continuing for two more years, SORCE will overlap with TSIS-1 measurements. TSI and SSI climate records are critical for estimating possible trends and variations of the solar irradiance, how these changes affect the Earth’s climate. Earth Sciences Division - Atmospheres
Tropical winds affect chlorine levels inside the Antarctic ozone holeSusan Strahan, Luke Oman, Anne Douglass, Code 614, NASA GSFC & USRALawrence Coy, Code 610.1 NASA GSFC & SSAIEarth Sciences Division - Atmospheres Horizontal transport of N2O anomaly (A→B) then Vertical Descent over Antarctica (B →C) Summary: The direction of the wind in the tropical stratosphere during one year affects how much chlorine will be in the Antarctic ozone hole the following year.Over the course of 1 year, variations in N 2 O and chlorine, driven by the tropical winds, travel nearly undiminished from their origin in the middle stratosphere (Box ‘A’) to the Antarctic lower stratosphere (Box ‘C’). The year-to-year chlorine variations are large (up to ± 200 ppt ) compared to predicted decline in chlorine due to the Montreal Protocol (20 ppt /year). Tropical winds cause chlorine levels and ozone depletion to vary inside the Antarctic Ozone Hole.
Name: Dr. Susan E. Strahan, NASA/GSFC, Code 614, GESTAREmail: Susan.e.strahan@nasa.govPhone: 301-614-5995Earth Sciences Division - AtmospheresReferences:S.E. Strahan, L.D. Oman, A.R. Douglass, and L. Coy (2015), Modulation of Antarctic vortex composition by the Quasi-Biennial Oscillation, Geophys. Res. Lett., submitted.S.E. Strahan, A.R. Douglass, P.A. Newman, and S.D. Steenrod (2014), Inorganic chlorine variability in the Antarctic vortex and implications for ozone recovery, Journal of Geophysical Research, 119, doi:10.1002/2014JD022295.Data Sources:NASA Aura Microwave Limb Sounder (MLS) v3.3 Level 2 N2 O and temperature data, 2004-2014. The NASA Global Modeling & Assimilation Office (GMAO) Modern Era Retrospective for Research and Applications (MERRA) reanalysis temperature and zonal wind products. Technical Description of Figures :Chart 1. N 2O anomalies in 2008-9 on the 750 K isentropic surface in the middle stratosphere. The QBO-driven anomaly is seen in midlatitudes in Sep/Oct (‘A’). The stratospheric circulation transports the anomaly to high latitudes in Dec/Jan (‘B’). Chart 2. Antarctic N2 O anomalies in 2009. The late summer anomalies (‘B’) descend inside the Antarctic vortex to ‘C’ during fall and winter. The transport pathways shown in Charts 1 & 2 are typical of other years (2004-2014). Chart 3. Strahan et al. [2014] reported large interannual variability of chlorine inside the Antarctic ozone hole. Because N 2O and chlorine are anti-correlated, Strahan et al. were able to infer chlorine variability using observed MLS N 2 O variability . The dashed black line is the expected rate of chlorine decline due to the Montreal Protocol. The year-to-year variations in chlorine (red line) are up to 10 times larger than the expected decline rate of 20 ppt /yr. We now know that this variability is caused by the quasi-biennial oscillation (QBO) in tropical winds. This affects the amount of ozone depletion inside the Antarctic ozone hole. Scientific Significance : The dynamics of the tropical middle stratosphere have a direct effect on the trace gas composition of the A ntarctic ozone hole. The QBO modulates chlorine levels inside the ozone hole and therefore affects ozone depletion. The QBO makes a small contribution to area variations in the size of the ozone hole through its effect on chlorine levels. Scientific significance, societal relevance, and relationships to future missions: Increasing greenhouse gases are expected to change the stratospheric circulation. Changes in the circulation, including possible changes in the QBO, will impact stratospheric ozone. Measurements of a long-lived trace gas such as N 2 O are essential 1) for detecting and measuring changes in stratospheric circulation and its variability, and 2) for correctly attributing trends in ozone.