
October 24 2018 Presented by Jeff Vukovich A Eyth B Henderson C Jang US EPA OAQPS C Allen J Beidler K Talgo CSRAGDIT Goal Support a northern hemispheric CMAQ run for year 2016 using the latest available emissions data to better understand hemispheric transport of ID: 725609
Download Presentation The PPT/PDF document "Development of 2016 Hemispheric Emission..." is the property of its rightful owner. Permission is granted to download and print the materials on this web site for personal, non-commercial use only, and to display it on your personal computer provided you do not modify the materials and that you retain all copyright notices contained in the materials. By downloading content from our website, you accept the terms of this agreement.


Slide1
Development of 2016 Hemispheric Emissions for CMAQ
October 24, 2018
Presented by: Jeff
Vukovich
A.
Eyth
, B. Henderson, C. Jang (US EPA OAQPS)
C. Allen, J.
Beidler
, K.
Talgo
(CSRA-GDIT)Slide2
Goal: Support a northern hemispheric CMAQ run for year 2016 using the latest available emissions data to better understand hemispheric transport of biogenic and anthropogenic pollutants
Implement N. American emissions inventories using latest 2016 modeling platform
Integrate a recently acquired year 2015 China inventoryProject year 2010 Hemispheric Transport of Air Pollutants (HTAP) v2 gridded inventories to more current year
EPA OAQPS, Emission Inventory and Analysis Group
2
Project OverviewSlide3
Emissions Modeling Process
3
Inventories
(annual, monthly, daily, hourly)
Met. Data
Gridded, hourly, speciated emissions in a format for an air quality model
Temporal Profiles
Speciation Profiles
Spatial Surrogates
SMOKE
SMOKE
software performs
temporal allocation
,
spatial allocation
,
speciation,
and
plume rise
to create:
Ancillary Data
: profiles and cross references Slide4
Achieving consistency throughout the hemisphere in speciation, spatial allocation, temporal allocation, and vertical allocation
Preparing emissions for the rest of the northern hemisphere based on
gridded inventoriesImplementing new China inventory Obtaining hemispheric inventories for fires and biogenics
Projecting HTAP gridded inventory to a more current yearZeroing out HTAP inventory over North America
4
Challenges
EPA OAQPS, Emission Inventory and Analysis GroupSlide5
Resolution: 0.1 degrees latitude by 0.1 degrees longitude for year 2010
Pollutants
: CO, NMVOC, NOx, SO2, NH3
, PM10, PM2.5, black carbon (BC) and organic carbon (OC)
Emissions sectors: agriculture, aircraft, industry, power industry (i.e., energy), ground transport, residential, and shippingSome sectors have monthly inventories, others annual
SMOKE 4.0 and later
: read gridded inventories and
regrid
them onto a desired modeling grid
Layering: uses constant layer fractions (J. Xing) since there are no stack parameters
EPA OAQPS, Emission Inventory and Analysis Group
5Use of HTAP inventoriesSlide6
EPA OAQPS, Emission Inventory and Analysis Group
6
NOx from Selected HTAP Sectors
Aircraft Cruising
Shipping
Industry
Ground transport
kg NO
x
/daySlide7
Global emissions datasets that include current years (through 2014) and by country
http://www.globalchange.umd.edu/ceds/
Hoesly et al, Historical (1750–2014) anthropogenic emissions of reactive gases and aerosols from the Community Emissions Data System (CEDS),
Geoscientific Model Development, 2018, Vol. 11, p 369-408 https://www.geosci-model-dev.net/11/369/2018/gmd-11-369-2018.pdf
EPA OAQPS, Emission Inventory and Analysis Group
7
Community Emissions Data System (CEDS) for Historical EmissionsSlide8
EPA OAQPS, Emission Inventory and Analysis Group
8
Using CEDS to project HTAPv2 from 2010 to 2014
HTAPv2 2010 sector
CEDS sector
g_ag
"Agriculture" or "AGRICULTURE"
g_energy
"Energy production" or "POWER"
g_industry
"Industrial" or "INDUSTRY" + "Solvents production and application" or "SOLVENTS"
g_transport
"Transportation" or "TRANSPORT",
g_residential
"Residential, Commercial, Other" or "RESIDENTIAL" + "Waste" or "WASTE"
g_ships
"International Shipping" or "SHIP"
* Note factors not available for aircraft projectionsSlide9
Use emissions trends from 2010 to 2014 in the CEDS data to generate a projection factor for each HTAPv2 sector
The CEDS-derived projection factors were applied by HTAPv2 sector and by country and by pollutant
Example:
EPA OAQPS, Emission Inventory and Analysis Group
9
Using CEDS to project HTAPv2 from 2010 to 2014
(2) Slide10
School of Environment, Tsinghua University, Beijing
16 different emissions sectors
Gridded emissions for a 27km Lambert Conformal grid Included Hong Kong and Macau; not TaiwanCAPS emissions provided except CO
Used HTAPv2 CO emissionsCB6 speciation providedMonthly, weekly, diurnal profiles provided
Used same vertical layering allocation as used with HTAP gridded inventories
EPA OAQPS, Emission Inventory and Analysis Group
10
2015 China inventorySlide11
EPA OAQPS, Emission Inventory and Analysis Group
11
2015 China inventory (2)
16 different sectors and the pollutants provided in each sector
* Note open burning not used; FINN fires usedSlide12
OAQPS, Emission Inventory and Analysis Group
12
NOX Road transport
NOX Power plant
NOX Domestic fossil fuels
NOX Domestic bio-fuels
165
75
6
2Slide13
U.S. anthropogenic inventories based on 2016 emissions modeling platform which includes 2014NEIv2
Including the inventories for Alaska, Hawaii, Puerto Rico, and Virgin Islands
U.S. fires from 2016 emissions modeling platformBiogenic from BEISv3.61 for USACanada 2016 (interpolated), Mexico 2016 (interpolated)Fire
INventory from NCAR (FINN) used outside U.S. FINN includes “croplands” fires (did not use HTAPv2 ag fires)
MEGAN v2.1 for outside of USAMonthly GEIA Lightning NOx inventory usedSpatially vary diurnal profiles generatedOcean chlorine consistent with modeling platform
EPA OAQPS, Emission Inventory and Analysis Group
13
Other InventoriesSlide14
GEOCODE contains all country, state, county and district definitions (replaces COSTCY)
GRIDMASK file (for 0.1x0.1 grid) assigns GEOCODEs and time zones to each grid cell
EPA OAQPS, Emission Inventory and Analysis Group
14
Supporting SMOKE Input FilesSlide15
EPA OAQPS, Emission Inventory and Analysis Group
15
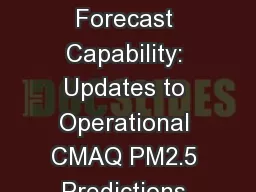
January Residential PM2.5
France
India
All times in GMT
00Z
12Z
Residential emissions have two peaks: morning and evening local timeSlide16
Spatial Surrogates for U.S., Canada, and Mexico developed for the hemispheric grid
187x187 polar stereographic 108km x 108km
Covered outlying areas: AK/HI/PR/VISpatial cross-reference had to be updatedNo surrogates needed outside of North America because inventories are regridded
EPA OAQPS, Emission Inventory and Analysis Group
16
Spatial AllocationSlide17
Emissions created for 44 layers
Layer 1 median at 10m, and layer 44 at 18,200m
SMOKE plume rise used in North AmericaBased on stack parametersFires have a special treatmentHTAP emissionsUse SMOKE program
Layalloc to put emissions at specific height rangesAircraft emissions split into landing and takeoff (layers 1-15), climbing and descent (16-33), and cruising (34-38)
Improved allocation of shipping and industry sources implementedFINN: fires assigned to specific height ranges
EPA OAQPS, Emission Inventory and Analysis Group
17
Vertical DistributionSlide18
EPA OAQPS, Emission Inventory and Analysis Group
18
Vertical Distributions by Sector
L
Km
L
Km
1
.01
25
4.2
5
0.1
306.810
0.4351015
0.94014
202.14418Slide19
Carbon Bond 6 (CB06)-based speciationUsed 2016 platform within North America
Set of speciation profiles for HTAP based on the previous (e.g. 2011) platform averages
For HTAP, only a single speciation profile can be used per sector, country and pollutantHTAP BC and OC inventory pollutants were used directly Rest of PM2.5 speciated into CMAQ’s AE6
EPA OAQPS, Emission Inventory and Analysis Group
19
SpeciationSlide20
EPA OAQPS, Emission Inventory and Analysis Group
20
Examples of merged emissions
July weekday NOX
July weekday PM2.5Slide21
EPA OAQPS, Emission Inventory and Analysis Group
21
Examples of
merged emissions (2)
July weekday VOC
July weekday SO2Slide22
More emissions sensitivity studies where we evaluate the impact of changing emissions in other parts of the world
Consider other methods to obtain future-year projections for non-U.S. emissions using alternative sources (e.g. trends from satellite data)Improvements to biogenic emissionsImprovements to layering
Possible release of hemispheric emissions modeling platform laterQuestions can be directed to vukovich.Jeffrey@epa.gov or
eyth.alison@epa.gov
OAQPS, Emission Inventory and Analysis Group
22
Future WorkSlide23
Xing, J., R. Mathur, J.
Pleim
, C. Hogrefe, C.-M. Gan, D. Wong, C. Wei, R. Gilliam, and G. Pouliot (2015), Observations and modeling of air quality trends over 1990–2010 across the Northern Hemisphere: China, the United States and Europe, Atmospheric Chemistry and Physics, 15(5), 2723-2747Xing, J., J.
Pleim, R. Mathur, G. Pouliot, C. Hogrefe, C. M. Gan, and C. Wei (2013), Historical gaseous and primary aerosol emissions in the United States from 1990 to 2010, Atmos. Chem. Phys., 13(15), 7531-7549, doi:10.5194/acp-13-7531-2013
Janssens-Maenhout, G., M. Crippa
, D.
Guizzardi
, F.
Dentener
, M. Muntean, G. Pouliot, T. Keating, Q. Zhang, J. Kurokawa, and R.
Wankmüller (2015), HTAP_v2. 2: a mosaic of regional and global emission grid maps for 2008 and 2010 to study hemispheric transport of air pollution, Atmospheric Chemistry and Physics, 15(19), 11411-11432Pouliot, G., T. Keating, G. Maenhout
, C. Chang, J. Beidler, and R. Cleary (2014), The Incorporation of the US National Emission Inventory into Version 2 of the Hemispheric Transport of Air Pollutants Inventory, in Air Pollution Modeling and its Application XXIII, edited, pp. 265-268, Springer International Publishing.
EPA OAQPS, Emission Inventory and Analysis Group
23References