
Adapted from http asetuftseduchemistrywaltsepageneticsofracehtml Uploaded January 8 2017 Genetics of Race Lesson 1 Introduction Goals Introduce module topic Provide necessary background ID: 916523
Download Presentation The PPT/PDF document "Genetics of Race Bioinformatics Inquiry ..." is the property of its rightful owner. Permission is granted to download and print the materials on this web site for personal, non-commercial use only, and to display it on your personal computer provided you do not modify the materials and that you retain all copyright notices contained in the materials. By downloading content from our website, you accept the terms of this agreement.


Slide1
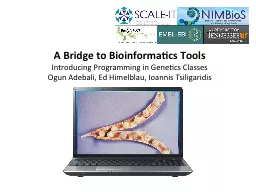
Genetics of Race
Bioinformatics Inquiry through Sequencing
Adapted
from:
http
://
ase.tufts.edu/chemistry/walt/sepa/geneticsofrace.html
Uploaded: January 8, 2017
Slide2Genetics of Race
Lesson 1:
Introduction
Goals:
Introduce module topic
Provide necessary background
Pose research question and hypothesize
Slide3Terms associated with race
What is race?
What is ancestry?
What features do people use to define someone’s race?
Slide4Why is it important to talk about race?
Part of our personal identity, may reflect our heritage
Can change how we interact with the world
Talking openly allows us to understand other
perspectives
Why is it hard to talk about race?
Can we talk about race from a scientific perspective?
Slide5Why is race hard to talk about?
Personal
Difficult to define
Is it based on language, place of origin, physical traits, cultural heritage?
Definitions change with time and place
Racial categories never seem to lead to anything good
Slavery
, the Holocaust,
…
Why talk about race?
Talking openly allows us to
understand other
perspectives, think through concepts
Slide6Can you predict who you’re most genetically similar to?
Guiding Question
Are people of the same race more genetically similar?
Image Credit: http
://www.pbs.org/race
/
Slide7Traits are inherited and expressed via DNA
DNA sequences
Proteins
Traits
Skin color
Height
Eye color
Public domain images from pixabay.com
Slide8Different ways to represent DNA
5’-ATTAGCTAGAC-3’
3D structure
2D chemical structure
Sequence
Public domain images from
W
ikipedia
Slide9Similarity of DNA
The human genome is over 3 billion base pairs long
Two random people are 99.9% identical
However, that still leaves 3 MILLION base pairs that can be different
Slide10How can we determine genetic similarity?
Sequence the entire genome of everyone in the class?
Problems:
Way too long
Image from National Human Genome Institute:
https
://www.genome.gov/25020001/online-education-kit-bioinformatics-finding-genes/
Slide11mtDNA
= mitochondrial DNA
Maternally inherited
Used
to study
ancestry
We will be looking at DNA sequences that do not provide any health information
What is mitochondrial DNA?
Slide12What are mitochondria?
Powerhouse of the cell
Generates chemical energy for the cell
Many mitochondria in each cell
Microbial origin
Cell
Mitochondrion
Slide13Tracking ancestry
AGTG
AGTG
AGTG
AGTG
A
C
TG
AG
A
T
AGTG
Two thousand years pass by…
AGTG
AGTG
AGTG
Slide14Mitochondrial DNA and ancestry
Image from http://www.mitomap.org
How to interpret this map:
Numbers (black text) refer to years before present day
Letters and numbers (color text) refer to different ancestral lineages
Slide15Genetic similarity example
Which pair of people is the most genetically similar?
Which pair of people is the least genetically similar?
A
G
TG
A
C
TG
AG
A
G
AG
A
T
AGTG
Emma
Laura
Marcus
Leslie
Martin
Slide16Genetic similarity
Who is most genetically similar?
People who have identical sequences
4/4 bases same = 100% similarity
Who is least genetically similar?
A
C
TG and AG
A
T
They only have 1 base in common, which is the A in the beginning
1/4
bases same = 25% similarity
A
G
TG
A
G
TG
A
C
TG
AGAT
Emma
Marcus
Martin
Leslie
Slide17Experimental Overview
collect samples
extract mitochondrial DNA
Next Gen. Sequencing (at
BioSeq
lab)
Analyze and interpret results
Sample collection: In class
You are most similar to
Mike___
You are
least similar
to
Maya___
Maya
Mike
Selina
Deanne
Hector
Maya
100%
94.44%
94.44%
88.24%
100%
Mike
94.44%
100%
88.89%
82.35%
94.44%
Selina
94.44%
88.89%
100%
82.35%
94.44%
Deanne
88.24%
82.35%
82.35%
100%
88.24%
Hector
100%
94.44%
94.44%
88.24%
100%
Slide18Wrap-up
What does race mean? What does ancestry mean?
Why are we looking at mitochondrial DNA? What method are we using to look at the DNA?
What are we going to do next time?
Slide19Genetics of RACE
Lesson 2:
Sample Collection
Goals:
Review research question and desired target (
mtDNA
)
Understand what’s happening during procedure
Collect cheek cells and extract DNA
Slide20Experimental Overview
collect samples
extract mitochondrial DNA
Next Gen. Sequencing (at
BioSeq
lab)
Analyze and interpret results
Sample collection: In class
You are most similar to
Mike___
You are
least similar
to
Maya___
Maya
Mike
Selina
Deanne
Hector
Maya
100%
94.44%
94.44%
88.24%
100%
Mike
94.44%
100%
88.89%
82.35%
94.44%
Selina
94.44%
88.89%
100%
82.35%
94.44%
Deanne
88.24%
82.35%
82.35%
100%
88.24%
Hector
100%
94.44%
94.44%
88.24%
100%
Slide21Quick micropipette basics
Holding the micropipette
Correct hand position
Always
keep pipette vertical, not horizontal
Changing volume
Each pipette designed for specific volume range
Don’t move beyond limits of pipette
U
sing tips
Use the pipette to pick up a pipette tip
Eject the pipette tip
T
ransferring volume
Notice two stops
21
Slide22Pipetting example
Select the P-1000 pipette
Set the pipette to 225
uL
Pipette 225
uL
of water into your tube
22
0
2
←1000’s place
←100’s place
←10’s
place
3
2
Slide23Protocol
Items you should have at your bench:
Sterile foam tipped swabs
Sterile
microcentrifuge
tubes
Extraction solution
Neutralizing solution
Pipettes and tips
Biohazard waste container
Shared equipment you will use:
Vortex
mixers
TimerHot plate set
to
95 °C
23
Slide24Buccal swab
Swab the inside of your cheek for 10 seconds.
24
Slide25Begin experiment!
We will continue once everyone’s samples are ready for the water
bath or hot plate
25
Slide26Experiment Reflection
26
What
is in tubes right now?
Why
are we placing the tubes in warm water?
What will the results look like?
Slide27What happens to your sample next?
What region of DNA are we looking at?
How do we focus on this region while ignoring the other parts of DNA?
27
Slide28What happens to your sample next?
We will be sequencing part of your
mitochondrial DNA
We will amplify this region for sequencing by using a process called
PCR
28
Slide29Project review
29
Can you predict who you’re most genetically similar to?
Are people of the same race more genetically similar?
Image Credit: http
://www.pbs.org/race
/
Slide30Wrap up
What was the goal of today’s experiment?
What steps were performed to extract the DNA?
How will this DNA be used to determine genetic relatedness?
30
Slide31Genetics of Race
Lesson 3:
Sequencing by synthesis
Goals:
Review central dogma and limits of DNA
Understand history and recent advances in sequencing
Understand the process (sequencing by synthesis) used to generate data in this module
Slide32What is DNA?
10010110
(coding)
to
as
5’
GATTACA
3
’
(DNA)
to
LIFE
32
Slide33The Central Dogma
DNA
5’
GATTACA
3’
33
Responsible for most of the
structure
and
function
of an organism
goes to
protein
Slide34Different ways to represent DNA
34
5’-ATTAGCTAGAC-3’
3D structure
2D chemical structure
Sequence
DNA sequencing
simply means
reading the sequence of the DNA
Slide35Very small yet very big
DNA is tiny
Each letter in the DNA sequence is less than one nanometer
Genomic information is massive
3 BILLION letters in the human genome
LIFE
35
Slide36So what?
What can we do with DNA sequencing?
36
Are the following scenarios “Sci-Fi” or “Reality”?
Slide37Identify whether someone is more or less likely to commit a
crime
37
Sci-fi.
Slide38Figure out the identity of ancient human
remains
38
Reality.
Slide39Use preserved DNA to re-create extinct plants and
animals
39
Sci-fi.
Slide40Use human DNA to create a
clone with the same personality
40
Sci-fi.
Slide41Track disease by monitoring toilet waste from airplanes
41
Reality.
Slide42Next-Generation Sequencing makes these advances possible
1 human genome in 13 years
~40 sequencing institutions
$3,000,000,000 per genome
16 human genomes in 3 days
1 sequencing system
$1,000 per genome
1990-2003: Human Genome Project
“
Sanger sequencing”
technology
Today
“Next-generation sequencing” technology
42
Slide4343
Slide44DNA Sequencing
by Synthesis
Bioinformatics Inquiry through Sequencing
Slide45DNA synthesis
Template strand
DNA polymerase
Primer
Nucleotides
ATGAGCTTAGCTA
TACTCG
T
A
C
T
G
G
C
A
T
45
Slide46DNA synthesis
ATGAGCTTAGCTA
TACTCG
T
A
C
T
G
G
C
A
T
46
Slide47DNA synthesis
ATGAGCTTAGCTA
TACTCGAATCGAT
47
Slide48Sequencing By Synthesis
48
Sequence DNA by observing the synthesis of a complimentary strand
MiSeq
sequencer
Slide49INLET
DNA is attached to the surface of a flow cell
OUTLET
49
DNA is fixed in place while various chemicals wash over it
The camera takes pictures of DNA synthesis while it happens
Slide50Make identical copies
Because nucleotides are so small, they are difficult to see, even when attached to fluorescent dyes
T
he sequencer copies the sample sequence to form a large group of identical sequences.
This group is called a
cluster
The fluorescent signal from a cluster is much greater than the fluorescent signal from a single strand
50
Slide51OUTLET
DNA is fixed to the surface of a flow cell
INLET
51
Slide52Fluorescent Dye
A
T
G
C
When excited by a laser, fluorescent dyes emit brightly colored light
Each nucleotide is attached to a unique fluorescent dye
52
Blue
A
Red
T
Green
G
Yellow
C
Slide53Sequencing By Synthesis
K.
Voelkerding
,
et al
, Clinical Chemistry, 2009
53
Slide54Fluorescent Dye
Laser excites fluorophore.
Camera captures color
E
ach color indicates a specific base
(support.Illumina.com)
54
Slide55Tracking colors
55
The sequencer uses a camera to identify the color of each nucleotide as it gets added
Write the first letter of the color you see:
R
ed
B
lue
Y
ellow or
G
reen
DNA synthesis happens fast and uncontrollable
Slide56Blocking group controls speed
3’-ATGC-5’
5’-TA
x
C
??
56
Deblocker
Slide57Speed can now be controlled
57
Without blocking groups
With blocking groups
Slide58Sequencing by Synthesis
58
Slide59Primer and polymerase attach
59
Slide601. Add nucleotide
60
Slide612. Image fluorescence
61
Slide623. Remove dye
62
Slide63Sequencing by synthesis
63
Slide64Sequencing by synthesis
64
Slide65Sequencing by synthesis
65
Slide66Sequencing by synthesis
66
Slide67Sequencing by synthesis
67
Slide68Sequencing by synthesis
68
Slide69Complete sequence
69
Slide70What the camera sees:
70
Image 1
Image 2
Image 3
Image 4
Image 5
Blue
A
Red
T
Green
G
Yellow
C
G
G
A
C
T
Slide71What the camera sees:
71
Image 1
Image 2
Image 3
Image 4
Image 5
Blue
A
Red
T
Green
G
Yellow
C
G
T
C
G
A
Slide72Modeling Activity
Everyone gets a role:
DNA Polymerase
Primer
Sequence complementary of primer
Laser
Camera
Nucleotides of the original sequence
Deblocker
Nucleotides
72
Slide73Image Credits
Applications
Criminal baby: toddlerhalloweencostumes.com
Jurassic world: http
://www.jurassicworld.com
/
Airplane poop: http
://
www.wired.com/2015/08/airplane-poop-help-track-global-disease-outbreaks/
73
Slide74Genetics of Race
Lesson 4:
Data Analysis
Goals:
Introduce DNA Assembly and Alignment
Practice determining genetic similarity
Review target DNA and limitations
Slide75Experiment Overview
1: ATCCAGGAGATACGTCT
2: ACTTAGTACATACATAT
3: AGATACTACAAACTTAT
4: ATCTAGTACACTCAAAA
5: AACTAGTACATACATAT
75
Slide76What does DNA sequencing data actually look like?
DNA sequencers usually produce short “reads”, which are fragments of a much larger sequence
Read 1:
GCCTACGGGTGGCAACAGTGGGGAATCTTCCGCAATGGACGAAAGTCTGACGGAGCAACGCCGCGTGAGTGATGACGGCCTTCGGGTTGTAAAGCTCTGTTAATCGGGACGAAAGGTCTTCTTGCGAATAGTTAGAAGAATTGACGGTACCGGAATAGAAAGCCACGGCTAACTACGTGCCAGCAGCCGCGGTAATACGTAGGTGGCAAGCGTTGTCCGGAATTATTGGGCGTAAAGCGCGCGCAGGCGGA
Read
2:
TGGCCTACAGTAGTCACTGTCTCTTATACACATCTCCGAGCCCACGAGACTGCAGCTAATCTCGTATGCCGTCTTCTGCTTGAAAAAAAAAAAAAAAAAAGAAGTAATGCAGGGGTGTGAGTGACTAAGAGGAGAGTGGTATGACATAAAACTAAGAAAACAACTAAAACAAGGGGAGGGCACAATATAACGTATCTCTGAGATGGTACTATGTGTCTGTGTAGCATCTGACATAATAACGTCCATATTCA
Read 31,164:
CCTACGGGTGGCTGCAGTGGGGAATCTTCCGCAATGGACGAAAGTCTGACGGAGCAACGCCGCGTGAGTGATGACGGCCTTCGGGTTGTAAAGCTCTGTTAATCGGGACGAAAGGTCCTCTTGCGAATAGTTAGAGGAATTGACGGTACCGGAATAGAAAGCCACGGCTAACTACGTGCCAGCAGCCGCGGTAATACGTAGGTGGCAAGCGTTGTCCGGAATTATTGGGCGTAAAGCGCGCGCAGGCGGAT
…
76
Slide77How do we turn these reads into usable information?
Step 1: Assemble the “reads” into a complete sequence
77
Slide78Types of Sequencing Analysis
De Novo
Assembly
Used the first time a gene or genome is ever sequenced
Stitching together short
sequences
Resequencing
“Sequencing again”
Allows for comparison with a
reference
78
Read Assembly Activity
Slide79Why do we need computers?
How long were the sequences we just looked at?
How long did aligning them by hand take?
How long is the human genome?
How long would aligning that by hand take?
Bioinformatics
: use of computers for
analyzing complex biological
data.
79
Slide80Understanding the DNA sequence
Once a sequence is assembled, how do you know where the DNA sequence actually comes from or what it does?
Search DNA sequences using
BLAST
. Like Google, but for DNA.
80
GGTGTGCAGTTTGCAGTGGACAGTTAACTGAGCTTTAACAATGTCTGATCTTTTTTTAAAGATTTTATTCATTCATTCATGACAGACACAGAGAGAGAGAGAGAGAGGCAGAGATACAGGCAGAGGGAGAAGCAGGCCCCATGCAGGGAGCCCACTGTGGGACTCGATCCTGGGACTCCAGGGTGATGTCCTGGGTCGAAGGCAGGCACTCAACTGCTAAGCCACCCAGGCATCCCAACAATGTCTGATCTTAATATCAAAGCTTGCTATATACTTACATATTTCATCTAATGTAGGATGTCAATGTTTACAAAACAAATATTATGTTATGAACTGCTATAAACATGCTGCCACATAAACTGAACTTCTTTTTTTTTAATTTATTTATGATAGTCAGAGAGAGAGAGAGAGGCAGAGACACAGGCAGAGGGAGAAGCAGGCTCCATGCACCGGAAGCCCGACGTGGGATTCGATCCCGGGTCTCCAGGATTGCGCCCCGGGCCAAAGGCAGGCGCTAAACCGCTGCACCACCCAGGGATCCCTAAACTGAACTTCTCAACAAAAGAAAAGCACAACTGATGAGCTCACTTCCCCCAAAGCCAGAAAATTAAATTTTCAATAAATTCTGTTTTGGGTACTCATAAACCTAAACTCATGTTTTCATAAATGTTTTCAAGTTGTCAATATGTTTTTTCAACTGTTAACACTGAAACAACAAAGGACCTTCACAATATCATGAGGGCATCAGAAGGCAGGGACAGCTGGCCTTGCGGCGGCCAAGGGACTAGCCCATCCCTCCACGTGCTAG
Slide81Using BLAST
https://blast.ncbi.nlm.nih.gov/Blast.cgi
81
Just copy in the sequence you want to identify
Then hit BLAST
Slide82Results identify the DNA
82
BLAST
–
l
ike Google but for DNA
Image credit
:
boxercab
https
://www.flickr.com/photos/boxercab
/
286178208/in/set-72157594356190532
/
Slide83Sequence alignment
Reference: 5’ AGTGCTAGCTTAGCTAGCTCAACGAT 3’
Read 1: 5’ AGCTTA 3’
Read 2: 5’ AGCTAA 3’
ATCGCGGATCGATTA
||| |||| |||| |
ATCCCGGAACGATAA
83
Which of these sequences has better alignment:
Read 1
or
Read 2
?
Slide84Sequence alignment
84
Slide85Genetic similarity example
Who is most genetically similar?
Who is least genetically similar?
To determine this, we must align each pair of sequences!
85
#
Student
Sequence
1
Maya
ACGGA
2
Mike
ACCGA
3
Selina
ACGGA
4
Deanne
ACCGT
Slide86Genetic similarity
Align Maya & Mike
Maya:
ACGGA
Mike:
ACCGA
# of matches = 4
Total length = 5
Similarity = 4/5 x 100% = 80%
86
Slide87Genetic similarity
Align Maya &
Selina
Maya:
ACGGA
Selina:
ACGGA
# of matches = 5
Total length = 5
Similarity = 5/5 x 100% = 100%
87
Slide88Genetic similarity
Align Maya & Deanne
Maya:
ACGGA
Deanne:
ACCGT
# of matches = 3
Total length = 5
Similarity = 3/5 x 100% = 60%
88
Slide89Genetic similarity across the whole class
89
Maya
Mike
Selina
Deanne
Maya
100%
80%
100%
60%
Mike
Selina
Deanne
Does 100% match mean that both individuals are the same?
Does a lower score mean that people are definitely not related?
There are lots of limitations to what we can conclude from genetic data!
Slide90Wrap-up
How are short DNA reads pieced together into a complete sequence?
How is genetic similarity determined?
90
Slide91Genetics Of Race
Lesson 5:
Results
Goals:
Review module, research question, and hypotheses
Return and discuss results (including limitations)
Connect project to broader social context
Slide92Anonymity
Please do not reveal people’s results unless you both consent
Use ID code rather than name
Alternate samples are used if your data was not available
92
Slide93Can you predict who you’re most genetically similar to?
Guiding Question
Are people of the same race more genetically similar?
Image Credit: http
://www.pbs.org/race
/
Slide94Experimental Overview
collect samples
extract mitochondrial DNA
Next Gen. Sequencing (at
BioSeq
lab)
Analyze and interpret results
Sample collection: In class
You are most similar to
Mike___
You are
least similar
to
Maya___
Maya
Mike
Selina
Deanne
Hector
Maya
100%
94.44%
94.44%
88.24%
100%
Mike
94.44%
100%
88.89%
82.35%
94.44%
Selina
94.44%
88.89%
100%
82.35%
94.44%
Deanne
88.24%
82.35%
82.35%
100%
88.24%
Hector
100%
94.44%
94.44%
88.24%
100%
Slide95Hypothesis
Write down on the back of your paper your expectations for your most similar peer and your least similar peer.
95
Slide96Were Your Predictions Correct?
Who was most similar to someone they predicted?
Who
was least similar to someone they predicted?
Who was surprised by these results?
96
Slide97Interpreting the Data
What was the range of genetic similarity in this experiment?
“Most similar” typically 99%+
“Least similar”
typically
94% - 99%
Sometimes more than one “most similar”
97
ATCC
G
TCC
ATCG
75% similar
75% similar
Slide98Interpreting the Data
Not all “most similar” and “least similar” peers will be exclusive pairs.
How can I be most similar to someone, but they aren’t most similar to me?
Example
98
3
You
CTCC
2 Mike
ATCT
1 Maya
ATTT
Slide99Interpreting the Data
What if “most similar” is the same race?
What are limitations of our experiment?
Small sample pool
We
only sequenced a relatively small region
Contamination and other
sequencing
errors
Chance – some “most similar” people will be of the same race just due to probability
99
Slide100Ancestry and relatedness
CANNOT conclude that you’re actually related (unless you mean you shared an ancestor thousands of years ago)
Rate of mutation is about 0.01 mutations per generation
This means 1 mutation every 100 generations (~2,000 years!)
100
Slide101Tracking migration
AGTG
AGTG
AGTG
AGTG
AGTG
AGTG
AGTG
A
C
TG
AG
A
T
AGTG
101
Two thousand years pass by…
Slide102Mitochondrial DNA and Ancestry
102
How to interpret this map:
Numbers (black text) refer to years before present day
Letters and numbers (color text) refer to different ancestral lineages
Image from http://www.mitomap.org
Slide103Perspectives on race
American Anthropological Association:
“Evidence
from the analysis of genetics (e.g., DNA) indicates that most physical variation, about 94%, lies
within
so-called racial groups. Conventional geographic "racial" groupings differ from one another only in about 6% of their genes. This means that there is greater variation within "racial" groups than between them.
…These
facts render any attempt to establish lines of division among biological populations both arbitrary and subjective
.”
103
Slide104Perspectives on race
Human Genome
Project:
“DNA studies do not indicate that separate classifiable subspecies (races) exist within modern humans…People who have lived in the same geographic region for many generations may have some alleles in common, but no allele will be found in all members of one population and in no members of any other.”
104
Slide105Is race meaningful…
… genetically?
… in society?
… in the justice system?
… on surveys (like the US census or standardized tests)?
105
Slide106Wrap up
106
Could this experiment have been possible without next generation sequencing? How might it have been different?
What other kinds of experiments could you do with this technology?