

EXHIBIT 1 Users of Pillolaswitch matrix PL BUMO UnawareAware Familiar Qualityperceiver PL BUMOPL BUMOPL BUMOOtherBUMOperceives Pillolaas qualityOther PillolaBUMOPillolaLQBUMOOther BUMO but Pillol ID: 818775
Download Pdf The PPT/PDF document "Exhibit 1Pillola’sbrand architectur..." is the property of its rightful owner. Permission is granted to download and print the materials on this web site for personal, non-commercial use only, and to display it on your personal computer provided you do not modify the materials and that you retain all copyright notices contained in the materials. By downloading content from our website, you accept the terms of this agreement.
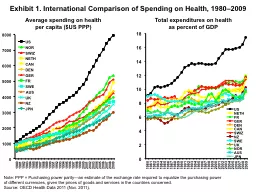


EXHIBIT 1Exhibit 1Pillola’sbrand a
EXHIBIT 1Exhibit 1Pillola’sbrand architectureMutually exclusive populations (one person can reside in only one box)Users of Pillola(switch matrix)PL BUMOUnawareAwareFamiliarQualityperceiverPL BUMOPL BUMOPL BUMOOtherBUMO;perceives Pillolaas qualityOther PillolaBUMOPillolaLQBUMOOther BUMO, but PillolausageNon-users of PillolaOtherBUMO;familiar with PillolaOtherBUMO; aware ofPillolaOtherBUMO;unaware of PillolaPL BUMOPL=Private labelLQ=New formulationNon-PillolaBUMO PL BUMO PillolaBUMOPillolausage non-BUMOResourcesFlowsBUMO=Brand used mo
st oftenKeySource: Market research quest
st oftenKeySource: Market research questionnaire, January 2003; weighted sample population n = 5,241EXHIBIT 2PenetrationRetentionOut-switchingIn-switchingExhibit 2 Switching among PillolausersExiting PillolaResourcesFlowsPillolausersShare of portfolioNew choosers of PillolaEXHIBIT 3Users of Pillola(switch matrix)PL BUMOUnawareAwareFamiliarQuality perceiverPL BUMOPL BUMOPL BUMOOther BUMO;perceives Pillolaas qualityOther PillolaBUMOPillolaLQBUMOOther BUMO, but Pillolausage29.13.740.3Non-users of Pillola1.84.419.710.113.8Other BUMO;familiar
with PillolaOther BUMO;aware of Pillola
with PillolaOther BUMO;aware of PillolaOther BUMO;unaware of PillolaPL BUMO6.99.834.730.1Exhibit 3Consumer residency in Pillola’sbrand architecture Million peopleAll resource populations; General population projectionAdult category consumers = 204 million peopleSource: Market research questionnaire, , n = 5,241, 2002; Vanguard analysisResourcesFlowsEXHIBIT 4Exhibit 4Average residency with brands0%10%20%30%40%50%60%70%80%90%100%0102030405060Residency after x monthsBranded competitor BBranded competitor CPillolaGeneric competitor BGeneric c
ompetitor ABranded competitor ASource:
ompetitor ABranded competitor ASource: Syndicated Tracking Study (June 2000 to May 2001)Total: 5.5 million people per year8%5%9%7%5%9%9%48%PillolaBranded competitor BBranded competitor ABranded competitor EBranded competitor DBranded competitor CPrivate labelOtherSource of in-switching consumersDestination of out-switching consumersTotal: 4.3 million people per year10%17%17%8%2%6%8%32%32.8 million PillolaBUMO usersShare of requirementAverage consumption: 12 pills per monthExhibit 5Consumer switching behaviorAnnual switching to/from PillolaAverag
e consumption: 37.5 pills per monthPillo
e consumption: 37.5 pills per monthPillolaBranded competitor BBranded competitor ABranded competitor EBranded competitor DBranded competitor CPrivate labelOtherSource: Market research, n=5,241, 2002; Vanguard analysisEXHIBIT 5EXHIBIT 6Recommended by physicianLonger lastingReason for switchMore effectiveSafety (net)OtherQuickerCouponsPreferred formNew productFewer side effects*PriceRecommended by friend / familySafety*Fewer pills to takeSource: Market research 2002; Vanguard analysis3.12.10.61.29.53.44.922.85.140.34.82.62.78.75.00.91.51.51.11.387.10.
50.83.40.60.00.00.03.74.54.94.96.68.19.
50.83.40.60.00.00.03.74.54.94.96.68.19.813.214.333.83.43.22.92.615.19.110.14.416.918.52.010.33.53.18.86.40.00.0Switchers from Pillolato Brand B (103)Switchers into Pillolafrom Brand B (345)Switchers into Pillolafrom private label(59)Switchers from Pillolato private label (182)Exhibit 6 Sample profiles of in-and out-switchers* Included within “Safety (net)”EXHIBIT 7Users of Pillola(switch matrix)PL BUMOUnawareAwareFamiliarQuality perceiverPL BUMOPL BUMOPL BUMOOther BUMO;perceives Pillolaas qualityOther PillolaBUMOPillolaLQBUMOOther BUM
O, but Pillolausage7.21.415.4Non-users o
O, but Pillolausage7.21.415.4Non-users of Pillola0.61.77.82.74.0Other BUMO;familiar with PillolaOther BUMO;aware of PillolaOther BUMO;unaware ofPillolaPL BUMO2.63.916.410.2Exhibit 7Chosen segment and PillolaCountry general population, million peopleSource: Market research January 2003; weighted sample populationn=5,241ResourcesFlowsEXHIBIT 88510511075801081051091319410569UnawareAwareFamiliarQualityPillolaportfolio usersPillola BUMOsNew Pillola formulationExhibit 8Comparison of chosen segment and general populationChosen segment indexed to gener
al population (= 100)PL BUMOOther bran
al population (= 100)PL BUMOOther brands BUMOPillolaBUMOSource: Market research January 2003; weighted sample populationn=5,241EXHIBIT 98.5%7.6%7.5%7.3%7.2%7.1%7.1%7.0%6.9%County C or DMultiple indications sufferers 18–28 Female household gatekeepersMales 18–28 headacheFemales 18–28Males 18–28Chronic sufferersPop. aged 29 and overFemales menstrual 18–288.3%6.7%6.5%6.2%4.9%4.7%4.6%4.3%3.8%County C or DPop. aged 29 and overChronic sufferersFemale household gatekeepersMales 18–28 headacheMales 18–28Multiple indicati
ons sufferersFemales 18–28Females m
ons sufferersFemales 18–28Females menstrual 18–28Pillolaquality reserveUsagePL BUMONon-PillolaBUMOOther PillolaBUMOPillolaLQBUMOOther BUMO, but PillolausageShare of requirementPenetrationRetention11.1%11%10.3%10.3%10.2%9.7%9.4%9.4%8.5%Males 18–28 headacheMales 18–28Females menstrual 18–28Multiple indications sufferers 18–28Females 18–28County C or DPop. aged 29 and overChronic sufferersFemale household gatekeepersExhibit 9Leverage-point analysis by segmentSelective examplesSource: Market research, n=5,241, 2002; V
anguard dynamic analysisEXHIBIT 100%5%
anguard dynamic analysisEXHIBIT 100%5%10%15%20%25%30%18-1920-2122-2324-2526-2728-2930-3132-3334-3536-3738-3940-4142-4344-4546-4748-4950-5152-5354-5556-5758-5960-6162-6364-6566-6768-6970-71Exhibit 10Volume share for private-label and Pillola within the same compound Adult males, 1999–2002PL -trendPillola-trend0%5%10%15%20%25%30%18-1920-2122-2324-2526-2728-2930-3132-3334-3536-3738-3940-4142-4344-4546-4748-4950-5152-5354-5556-5758-5960-6162-6364-6566-6768-6970-71AgeSource: Syndicated 2000–2002 averages polynomial trend; Vanguard analysis