
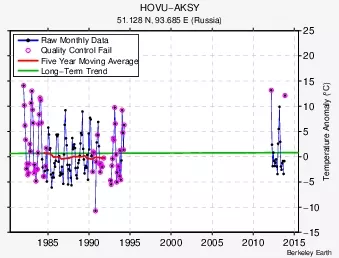
1985199019952000200520102015151050510152025Raw Monthly DataQuality Control FailFive Year Moving AverageLongTerm TrendHOVUAKSY51128 N 93685 E RussiaBerkeley Earth ID: 859114
Download Pdf The PPT/PDF document "Temperature Anomaly C" is the property of its rightful owner. Permission is granted to download and print the materials on this web site for personal, non-commercial use only, and to display it on your personal computer provided you do not modify the materials and that you retain all copyright notices contained in the materials. By downloading content from our website, you accept the terms of this agreement.


1 1985 1990 1995 2000 2005 2010 2015 -15 -
1985 1990 1995 2000 2005 2010 2015 -15 -10 -5 0 5 10 15 20 25 Temperature Anomaly (°C) Raw Monthly Data Quality Control Fail Five Year Moving Average Long-Term Trend HOVU-AKSY51.128 N, 93.685 E (Russia)Berkeley Earth