
Gujer 1996 are popular reasons for promoting urineseparation as an alternative to conventional sanitation systems Irrespective of the toilet design and sourceseparation technology there is a need for managing the transport of urine from its source to a defined target point ID: 787995
Download The PPT/PDF document "Introduction Closing the nutrient loop ..." is the property of its rightful owner. Permission is granted to download and print the materials on this web site for personal, non-commercial use only, and to display it on your personal computer provided you do not modify the materials and that you retain all copyright notices contained in the materials. By downloading content from our website, you accept the terms of this agreement.


Slide1
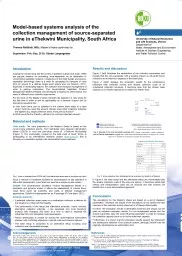
Introduction Closing the nutrient loop and the control of pollution (Larsen and Gujer, 1996) are popular reasons for promoting urine-separation as an alternative to conventional sanitation systems. Irrespective of the toilet design and source-separation technology, there is a need for managing the transport of urine from its source to a defined target point (Rieck and von Muench, 2011). Especially in developing regions, the collection and transport management of urine is gaining importance. The Decentralized Sanitation Product Management Model (DeSaM) was developed to assess the performance and costs of different urine collection approaches.For the work on this Master’s thesis, DeSaM was applied to a case study for the first time in order to test its applicability as a decision support tool by answering questions like:a) How much urine can be collected in the chosen base setup of a case study? And how does this amount change when other collection schemes are applied (e.g. larger collection tanks, more pick-up trucks)?b) What would be the (Pareto-) optimum for cost and collected volume?Material and methodsCase study: The work presented in the Master’s thesis is based on the current urine collection activity from distributed urine diversion dehydration toilets (UDDTs) in rural and peri-urban areas of eThekwini Municipality(Figure 1). The municipality, located on the east coast of South Africa, is participating in an international research project (www.vuna.ch) that is focusing on a sanitation system with decentralized urine treatment. Fig.1 Urine is collected from UDDTs (left); the distributed tanks have to be picked up (right)Since a network of treatment facilities for decentralized on-site operation is still under development, urine tanks are used as a simple on-site system. DeSaM: The Decentralized Sanitation Product Management Model is a stochastic and dynamic model. It allows the assessment of volume flows, mass flows (such as nutrients) and costs of defined management approaches. DeSaM is implemented as an R package (R Core team, 2012).Analysis approach: A potential collection setup based on a centralized collection is defined for the situation in eThekwini Municipality.The performance of the setup and alternative schemes (more vehicles, alternative collection intervals,…) are assessed and local sensitivity analysis with changing one factor at a time is used to separate the influential from non-influential model parameters. Pareto optimization is chosen for solving the multi-objective optimization problem with conflicting objectives: minimal costs and maximal volume. The base setup is compared to an alternative setup including local collection and intermediate storage.
Results and discussionFigure 2 (left) illustrates the sensitivities of the collection parameters and reveals that the only parameter with a positive impact on all performance indicators is the maximum capacity of the toilet tanks. Figure 2 (right) displays the simulation results for the performance indicators total collected volume and relative collection costs of all considered collection schemes. It becomes clear that the chosen base scenario is not Pareto-optimal as it is below the Pareto front.ZAR = South African Rand (1 ZAR ≈ 0.1 EUR)aaaaFig. 2 Results of the local sensitivity analysis (left) + values = improvement, - values = impairment; and of Pareto optimization (right) dots = mean values of 50 parallel simulations, the lower (25 %-) and the aupper (75 %-) quartiles are connected by horizontal and vertical linesFig. 3 Urine collection from distributed urine diversion dry toilets in eThekwiniIn Figure 3, the base setup and the alternative setup are schematized and the relative collection costs of the urine are split-up. It becomes visible that vehicle and transportation costs can be reduced and that workers will benefit from a more decentralized approach.ConclusionsThe simulations for this Master’s thesis are based on a set of idealized parameters. Therefore, the results of the simulations do not confirm the real outcome of the collection activity observed in eThekwini Municipality.However, the simulation results of alternative schemes and setups can be seen as valuable exemplary results. For the investigated setups and the chosen parameter sets, the most influential parameter in order to increase the collection capacity turns out to be the toilet tank capacity.Furthermore, it is shown that the simulation results support the refinement and subsequent selection of an optimum system, although DeSaM was not originally developed as an optimization tool.
Model-based systems analysis of the collection management of source-separated urine in eThekwini Municipality, South Africa
Theresa Roßboth, MSc, Master‘s thesis supervised by Supervisor: Priv.-Doz. DI Dr. Günter Langergraber
Acknowledgements
This Master’s thesis was carried out in the course of the research project “VUNA”. The author wants to thank
Prof. Dr. Max Maurer (head of the Department of Urban Water Management at Eawag
) for the
invitation,
Priv.-Doz. Dr. Günter Langergraber for his enthusiasm for this cooperation and Dr. Kai Udert (project leader of “VUNA”) for the funding of the fieldtrip to Durban. Furthermore, the author is grateful for financial support of the University of Natural Resources and Life Sciences, Vienna (BOKU) and wants to thank the Center for International Relations (ZIB) for the assistance with KUWI-application.
ReferencesLarsen, T.A.; Gujer, W. (1996): Separate management of anthropogenic nutrient solutions (human urine). Water Science and Technology 34(3-4). 87-94.R Core Team (2012): R: A Language and Environment for Statistical Computing. R Foundation for Statistical Computing. Vienna, Austria. ISBN: 3-900051-07-0. http://www.R-project.orgRieck, C.; von Muench, E. (2011): Technology review of urine diversion dehydration toilets (UDDTs). Design principles, urine and faeces management. Deutsche Gesellschaft für International Zusammenarbeit (GIZ) GmbH. Eschborn, Germany.
Toilet tank9.9 %Pick-up90.1 %Fuel35.0 %Vehicle 9.6 %Salaries45.5 %
Toilet tank11.2 %Local pick-up58.8 %Buffer tanks3.8 %Pick-up26.2 %Fuel10.4 %Vehicle 5.7 %Salaries10.1 %
Base20 l-tanks,1 team,7 days interval,1000 l-vehicle capacity
Total amount of collected urine
Relative collection costs (ZAR L-1)Number of households without toilettank overflow
A simulation result is Pareto optimal or non-dominated if none of the objectives described by a particular output variable can be improved without impairment of the other objective.
40 l-tanks,14 days interval
60 l-tanks,14 days interval
40 l-tanks
60 l-tanks,3000 l-vehicle capacity
60 l-tanks,2 teams,3000 l-vehicle capacity
Split-up of the collection costs per liter