
Talking Points Which chemicals should we consider for RSC or at all See white paper distributed by Brock Which chemicals are relevant to Alaska Eg In the US all uses of toxaphene were banned in 1990 ID: 918451
Download Presentation The PPT/PDF document "Contaminant Levels in Alaskan Population..." is the property of its rightful owner. Permission is granted to download and print the materials on this web site for personal, non-commercial use only, and to display it on your personal computer provided you do not modify the materials and that you retain all copyright notices contained in the materials. By downloading content from our website, you accept the terms of this agreement.


Slide1
Contaminant Levels in Alaskan Populations and Marine Mammals
Slide2Talking Points
Which chemicals should we consider for RSC or at all?
See white paper distributed by Brock
Which chemicals are relevant to Alaska?
E.g. In the U.S. all uses of
toxaphene
were banned in 1990
Which ones do not have an
RfD
E.g. p-DDE has an oral cancer slope factor but no
RfD
PCBs have a CSF but
only
some
Aroclor
mixtures have an
RfD
Contaminants’ levels can be elevated in MM tissues
What species/tissues are the most consumed?
Alaska populations consuming marine mammals can show elevated body burdens of contaminants
They may be exposed to levels considered “unsafe”
How does the concept of RSC apply to these populations?
Slide3CONTAMINANTS LEVELS IN MARINE MAMMALS
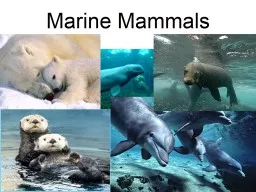
Slide4Contaminants in MM tissues
Many contaminant have been measured in MM tissues:
Cadmium
Mercury
Cis-Chlordane
Oxy-chlordaneHeptachlorHeptachlor epoxide
HCBHCHPFCsPBDEsPCBsDDTs(PAHs in clams?)
Levels are variable depending on
Location/habitat
Species
Age, sex, tissue type
Slide5Concentrations Variations with Animals’ Sex
Male to Female Ratio for some Contaminants Concentrations in Beluga Whale Tissues
Hoguet et al. 2013,
Krahn
et al. 1999
Generally, males seem to accumulate higher contaminant levels
Limitation: No age information
Slide6Concentrations Variations with Animals’ Age
Mercury in Harbor Seal Liver and Heart
Slide7Mercury in Harbor Seal liver and heart
N=80
N=17
N=38
Marino et al. 2011
Heart
Liver2 orders of magnitudeConcentrations Variations with Tissue Type
Seals were from Kodiak and Prince William Sounds
Slide8PCB Residues in Domestic
Raw Foods for Fiscal Years 1969–1976
ATSDR. 2000. PCB Toxicological Profile
Slide9Concentrations Variations with Tissue Type
Median PCB Levels in Bowhead Whale Tissues (n=5)
Hoekstrsa
et al. 2005, O'Hara 2005
FDA’s Tolerance Level in Fish = 2 ppm (0.2-3.0 ppm PCBs for all other foods)
Shellfish from previous slide
Fish from previous slide ~ 900 ppb
Slide10Concentrations Variations with Species
Median PCB Levels in MM from Various Locations
Krahn
et al. 1999, Hoekstra et al. 2003,
o'Hara
et al. 1999,
Seagars et al. 2000, Struntz t al. 2000, Kuckllick et al. 2002N=10,10, 11, 8, 20N=14, 12, 25N= 6, 14, 10N= 5, 3, 20N= 7FDA’s Tolerance Level in Fish
Slide11HUMAN EXPOSURE TO CONTAMINANTS
Slide12Exposure of Arctic Populations
Arctic populations generally show higher levels of persistent contaminants than people from lower latitudes
Contribution of their subsistence diet
Levels vary with age, sex, location
Slide13Subsistence in Alaska
From Alaska Department of Fish and game, Division of Subsistence. 2014. Subsistence in Alaska: A Year 2012 Update
Slide14Mean Pesticide Levels by Age
in 5 Aleutian and Pribilof Villages, AK 1999
NHANES 1999-2000, Geo Mean (ppb)
12-19
y.o
.
>20 y.o.ẞ-HCHND0.087Heptachlor EpoxideNDNDOxychlordaneNDND(12.9 in 01-02)t-NonachlorND20.8
p,p
’-DDE
118
287
Dieldrin
ND
ND
p,p
’-DDT
ND
ND
Mirex
ND
ND
Most pesticides were not detected in NHANES subjects
Sample size ~ 600-700 for each age category
Comparison with NHANES (‘99-’00)
Slide15Blood
Mercury in Alaska Native women* vs. NHANES III
n = 205
n = 1928
*
Berner
2005
Today about 0.7ppb
Slide16Hair Mercury Levels
Subsistence v non-subsistence diet
Rothschild, 2002
Mean hair mercury level in subsistence food users is 7.6-fold the level of their non-subsistence counterpart
1.45 ppm (Range:0.32-4.00 ppm) v 0.19 ppm (Range: 0.03 to 0.43 ppm)
Slide17Aleutian/Pribilof WCBA and AMAP maternal plasma, 1994-1996
Slide18Median PCB Levels by Age and Sex
Slide19Infant Exposure Through Breastmilk
Infants can be a significantly exposed to POPs through breast milk
Hooper et al. 2007
BDE-47 (A) and PCB-153 (B) levels in breast milk collected 6–24 weeks after birth.
Slide20DIETARY INTAKE
(PCBs and Mercury)
Slide21Estimated Daily Dietary Intake
of PCBs in the US
Year
Dietary intake (µg/kg body weight per day)
Adult
Toddler
Infants1986–1991<0.0010.002<0.001
1982–1984
0.0005
0.0008
0.0012
1981–1982
0.003
ND
ND
1980
0.008
ND
ND
1979
0.014
ND
ND
1978
0.027
0.099
0.011
1977
0.016
0.030
0.025
1976
Trace
ND
Trace
ATSDR (2000). Estimated intakes are based on an average "total diet" composition (which varies slightly) and not on individual food items. Average body weights are assumed to be 9 kg for infants, 13 kg for toddlers, and 70 kg for adults. Accordingly, the average dietary intake for 1982–1984 would be 0.0108
μg
, 0.0104
μg
, and 0.035
μg
for the infant, toddler, and adult, respectively.
Slide22Safe PCB Health Criteria
Agency
Value
Comment
FDA
0.2-3.0 ppm (all foods)
2.0 ppm (fish)Tolerance LevelWHO FAO6.0 µg/kg per day12.8 mg/month/personAllowable daily intakeEPA - IRISCSF = 2.0 per (mg/kg)/dayUpper bound of the Oral CSF for high persistence PCBs [Central estimate is 1/(mg/kg/d)]EPA - IRISRfDsDeveloped for Aroclor
1016,
Aroclor
1248, and
Aroclor
1254
ATSDR
Chronic MRL = 0.02
μ
g/kg/d
Aroclor
1254
Slide23Health Risks Associated with
a Consumption of 6
oz
/d?
FDA’s Tolerance Level in Fish
Median PCB Levels
Cancer risk of 10-2For a 6 oz daily consumption (70 kg adult)Cancer risk < 10-4 for a tissue concentration < 20 ppb wwThe MRL will be exceeded for a concentration > 8 ppb (Assuming 100% Aroclor 1254)
Slide24Acceptable Mercury Dose
Acceptable Hg intake: 0.4
μ
g/kg BW/d
For a 70 kg adult
28 μg/dMedian [Hg] in PWS Liver: 8 μg/g Safe consumption 3.5 g/d106 g/month3.7 oz/monthHarbor Seal Liver~ 4 oz/month is likely exceeded
Slide25Conclusion / Questions
In marine mammals, contaminant concentrations
Can be elevated
Vary widely with species, age and especially tissue type
The concept of trophic level is insufficient to characterize accumulation in MM
How to reconciliate
this with the concept of RSC?How to deal with the large variability observed within species?Because of their subsistence life style, Arctic populations tend to be more exposed to contaminants than the general populationThey might be regularly exposed to some chemicals at levels exceeding what is considered safeHow does the RSC apply?