
Figure 41 AgeSpecific Fertility Rates by Residence 1519202425293034353940444549 UrbanRuralTotal NDHS 2003 Fertility Table 42 Fertility by back g round characteristics Total fertility ra ID: 937912
Download Pdf The PPT/PDF document "FertilityThe TFR of 57 computed in the 2..." is the property of its rightful owner. Permission is granted to download and print the materials on this web site for personal, non-commercial use only, and to display it on your personal computer provided you do not modify the materials and that you retain all copyright notices contained in the materials. By downloading content from our website, you accept the terms of this agreement.


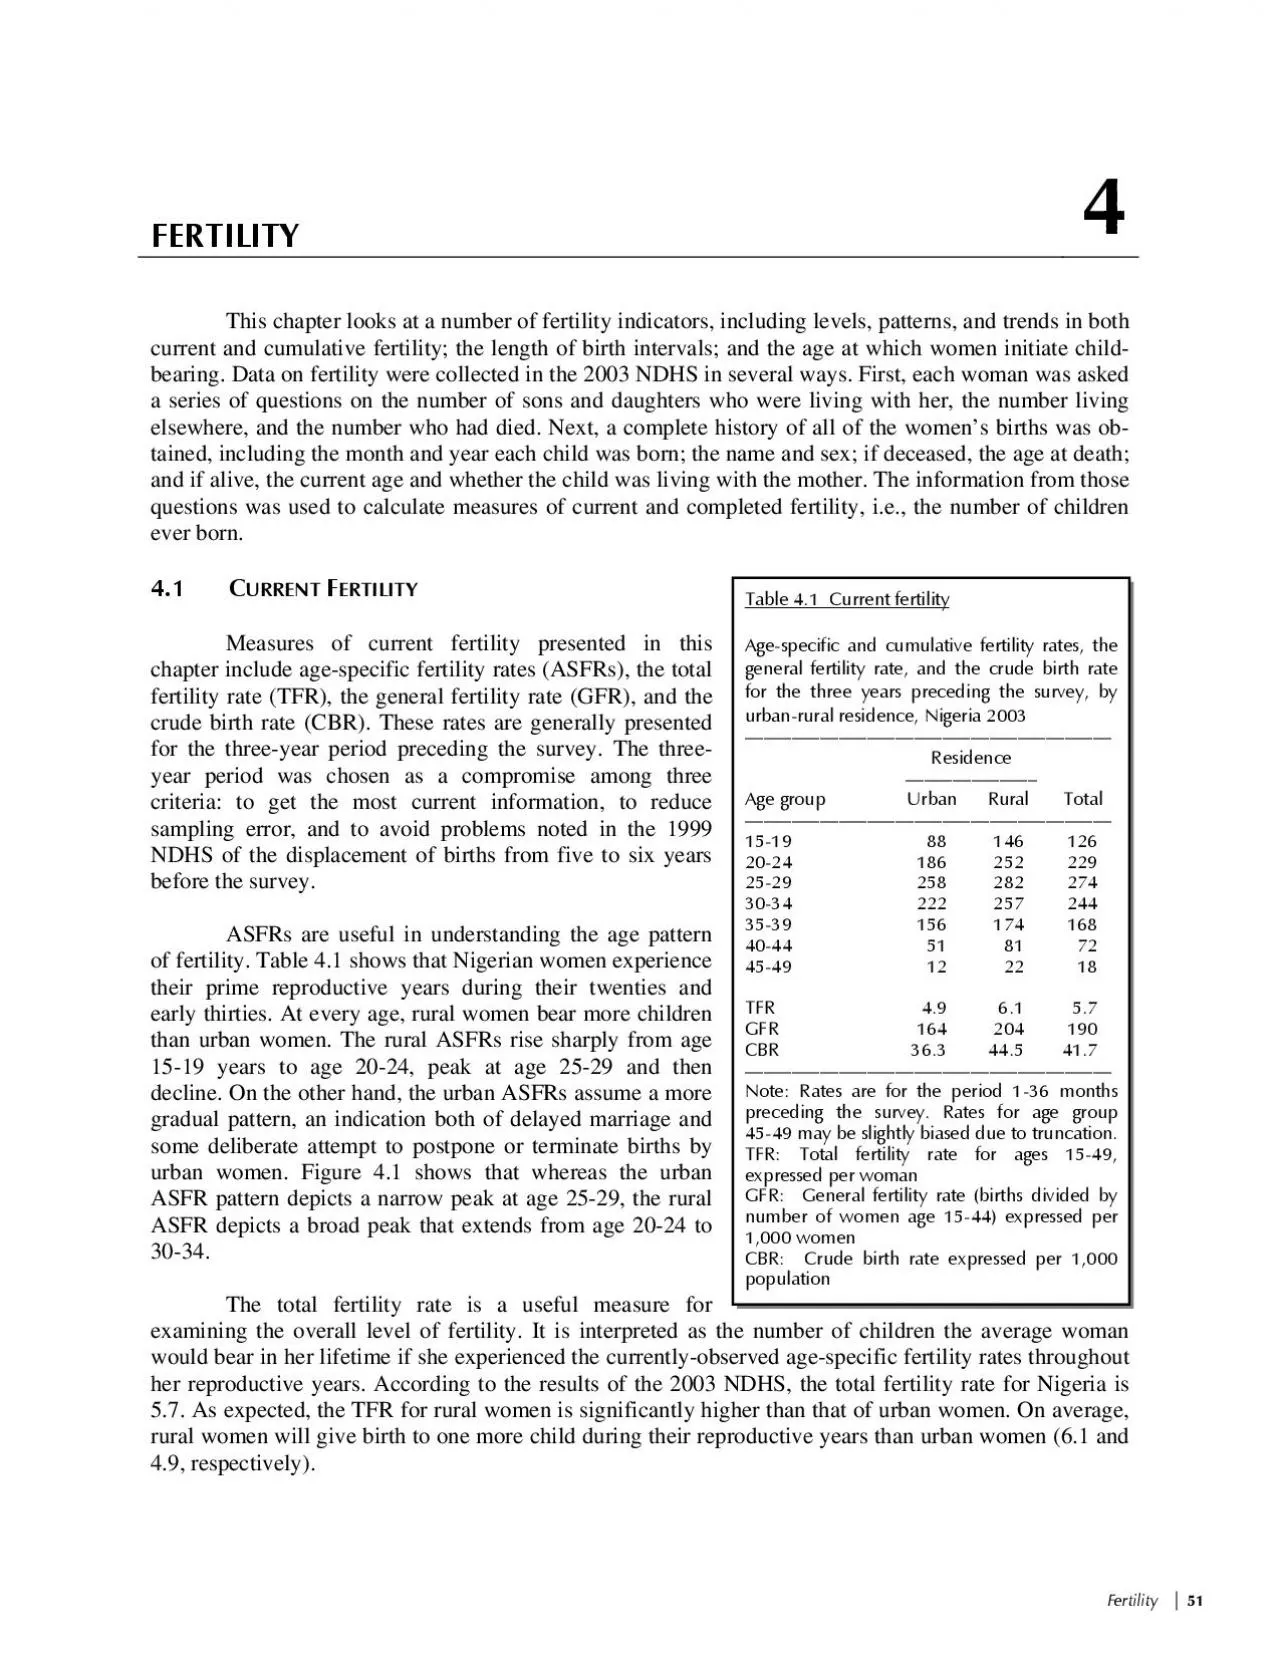
FertilityThe TFR of 5.7 computed in the 2003 NDHS is significantly higher than the 1999 NDHS rate of 5.2. This confirms the analysis in the Data Quality Chapter of the 1999 NDHS final report that detailed evidence of an underreporting of births during the five years preceding the survey. Indeed, the results of that analysis indicated that the TFR was closer to 6.0 (NPC, 2000). On the other hand, there is no evi-dence of omission or transference of births in the 2003 NDHS (see Table C.4). The crude birth rate in Nigeria is 42 births per 1,000 population. As with the TFR, there is a clear differential in this rate by residence: 45 births per 1,000 in rural areas versus 36 births per 1,000 in urban areas. The GFR of 190 indicates that 1,000 women age 15-44 would have 190 live births per year and also indicates a significant urban-rural difference. Higher rural than urban fertility has been explained with respect to the underlying socioeconomic differences and the changing proximate determinants of fertility, especially delayed marriage and higher use of modern contraceptives in urban areas (Isiugo Abanihe, 1996). ERTILITY IFFERENTIALSTable 4.2 shows total fertility rates, the percentage of women who are currently pregnant, and the mean number of children ever born (CEB) to women age 40-49, by residence, region, education, and wealth quintile. The large urban-rural differentials in fertility have already been noted. Region of residence also shows considerable variation in fertility. Table 4.2 shows a pattern of lower rates in the south and higher rates in the north. The TFR is lowest in the South West and South East (4.1), followed closely by the South South (4.6). The North Central shows a rate corresponding to the national average of 5.7. The rates for the North West and North East are significantly higher at 6.7 and 7.0, respectively (Figure 4.2). Figure 4.1 Age-Specific Fertility Rates, by Residence 15-1920-2425-2930-3435-3940-4445-49 UrbanRuralTotal NDHS 2003 Fertility Table 4.2 Fertility by back g round characteristics Total fertility rate for the three years
preceding the survey, per-centage of women 15-49 currently pre g nant, and mean number of children ever born to women age 40-49, by background char-acteristics, Nigeria 2003 Mean number of children Total Percentage ever born Background fertility currently to women characteristic rate pregnant age 40-49 Residence Urban 4.9 9.4 6.2 Rural 6.1 12.4 7.1 Region North Central 5.7 9.4 7.4 North East 7.0 14.2 7.4 North West 6.7 16.2 6.7 South East 4.1 6.8 6.6 South South 4.6 9.0 6.9 South West 4.1 6.0 5.5 Education No education 6.7 14.8 7.1 Primary 6.3 11.0 7.1 Secondary 4.7 8.1 5.5 Higher 2.8 6.2 4.3 Wealth quintile Lowest 6.5 12.8 7.2 Second 6.3 13.8 7.2 Middle 5.7 13.2 6.7 Fourth 5.9 10.2 7.0 Highest 4.2 7.8 5.5 Total 5.7 11.4 6.8 Rate for women age 15-49 years Fertility is also strongly correlated with education and wealth quintile. The higher a womans educational attainment and the more economically advantaged her household, the lower her fertility. There is a monotonic decline in fertility with educational attainment. Eleven percent of the women inter-viewed reported that they were pregnant at the time of the interview. Variations in this proportion follow the same general patterns as the TFRs. Table 4.2 also shows the mean number of live births for women age 40-49. This figure is an indi-cator of completed fertility or cumulative fertility of women approaching the end of their childbearing years. A comparison of the TFR (5.7) and cumulative fertility (6.8) gives an indication of fertility over time. The data indicate fertility decline among women in all groups, with the exception of women in the FertilityERTILITY RENDSOne method of understanding fertility trends is to examine the ASFRs over time. Because women age 50 and older were not interviewed in the survey, the rates are successively truncated as the number of years before the survey increases. The ASFR data shown in Table 4.3 indicate that over the last 20 years there has
been a steady decline in fertility among women of all ages in Nigeria. As has been alluded to previously, the declining fertility observed here can be interpreted in light of rising age at marriage and 5.77.06.74.14.64.1 0.01.02.03.04.05.06.07.08.0 Table 4.3 Trends in a g e-specific fertility rates Age-specific fertility rates for five-year periods precedin g the survey, by mothers age at the time of the birth, Nigeria 2003 Number of years preceding the survey Mothers age at birth 0-4 5-9 10-14 15-19 15-19 126 147 167 197 20-24 246 265 285 307 25-29 272 315 305 312 30-34 237 254 270 [282] 35-39 171 173 [200] - 40-44 69 [89] - - 45-49 [25] - - - Note: Age-specific fertility rates are per 1,000 women. Estimates in brackets are truncated. Fertility Figure 4.3 presents the trend in the TFR over the years from different Nigerian data sets. Overall, these data indicate a modest decline in fertility at the national level over the years, from a TFR of 6.3 in the 1981-82 National Fertility Survey (NFS) to 5.7 in the 2003 NDHS. HILDREN IVINGTable 4.4 shows all women and currently married women by number of children ever born. Data on the number of children ever born reflect the accumulation of births over the past 30 years and therefore have limited relevance to current fertility levels, particularly when the country has experienced a decline in fertility. Approximately seven in ten women reported having given birth. As expected, currently married women have had more births than all women in all age groups; 90 percent of married women report that they have given birth. The reason is undoubtedly that currently married women are more consistently ex-posed to the risk of pregnancy. The percentage of women in their forties who have never had children provides an indicator of the level of primary infertilitythe proportion of women who are unable to bear children at all. Since voluntary childlessness is rare in Nigeria, it is likely that married women with no births are unable to bear children. The 2003 NDHS result
s suggest that primary infertility is low: less than 3 percent of married women age 45-49 report that they have had no children. It should be noted that this estimate of primary infertility does not include women who may have had one or more births but who are unable to have more (secondary infertility). The mean number of children ever born (CEB) for all women is 3.1 and for currently married women is 4.1. As expected the mean CEB increases with age. Comparing the CEB column with that of the mean number of living children reveals substantial experience of child loss among Nigerian women. 6.36.05.95.7 1981-1982NFS1990NDHS1991PES2003NDHS0.01.02.03.04.07.0Figure 4.3 Trends in Total Fertility Rates FertilityNTERVALSA birth interval is defined as the length of time between two successive live births. Information on birth intervals provides insight into birth spacing patterns, which affect fertility as well as infant and childhood mortality. Research has shown that children born too soon after the previous birth are at in-creased risk of dying at an early age. Table 4.5 presents the percent distribution of non-first births in the five years preceding the sur-vey, by number of months since preceding birth. The median birth interval in Nigeria is 31 months. The median number of months since preceding birth increases significantly with age, from a low of 26 among mothers age 15-19 to a high of 39 among mothers age 40-49. Studies have shown that the death of a preceding birth should lead to a shorter birth interval com-pared with when a child survives. Indeed, the table indicates that the death of a preceding birth shortens the birth interval by about six months. According to the 2003 NDHS data, living in a rural or an urban area does not make any differ-ence in birth intervals in Nigeria. There is a ten-month difference between women in the South West, who have the longest birth interval, and those in the South East, who have the shortest birth interval (37 months and 27 months, respectively). Table 4.4 Children ever born and living Percent distribution of all women and curre
ntly married women by number of children ever born, and mean number of children everborn and mean number of living children, according to age group, Nigeria 2003 Mean Mean Number of children ever born Number number number of of children of living Age 0 1 2 3 4 5 6 7 8 9 10+ Total women ever born children ALL WOMEN 15-19 79.0 16.7 3.2 1.0 0.0 0.0 0.0 0.0 0.0 0.0 0.0 100.0 1,716 0.26 0.22 20-24 41.6 24.0 17.6 10.6 4.9 1.1 0.2 0.0 0.0 0.0 0.0 100.0 1,494 1.18 0.97 25-29 16.8 13.5 16.0 17.6 17.0 10.7 5.2 2.1 0.5 0.2 0.2 100.0 1,382 2.74 2.23 30-34 8.0 6.6 9.8 11.5 14.9 15.7 12.8 11.2 5.8 2.4 1.2 100.0 941 4.35 3.41 35-39 2.5 4.1 5.6 8.8 12.2 10.2 12.4 12.4 12.2 9.8 9.8 100.0 816 5.93 4.54 40-44 5.5 3.3 3.7 4.2 6.7 10.9 11.8 12.0 11.1 11.9 18.9 100.0 688 6.62 4.91 45-49 3.3 3.4 4.3 2.6 8.8 9.9 10.4 9.2 11.1 10.9 26.1 100.0 583 7.03 5.05 Total 31.0 12.7 9.6 8.4 8.5 6.9 5.8 4.9 4.0 3.3 4.9 100.0 7,620 3.09 2.38 CURRENTLY MARRIED WOMEN 15-19 44.8 41.9 10.0 3.1 0.1 0.0 0.0 0.0 0.0 0.0 0.0 100.0 545 0.72 0.61 20-24 13.5 32.3 27.4 16.6 8.0 1.8 0.4 0.0 0.0 0.0 0.0 100.0 911 1.80 1.48 25-29 7.1 12.9 17.8 20.2 19.4 12.8 6.1 2.6 0.6 0.2 0.3 100.0 1,146 3.15 2.56 30-34 3.9 6.3 9.2 11.9 15.5 16.8 13.8 12.2 6.4 2.7 1.4 100.0 848 4.63 3.63 35-39 1.5 3.3 5.7 8.6 12.7
10.5 12.1 12.2 12.6 10.4 10.3 100.0 763 6.07 4.63 40-44 5.1 2.8 3.5 3.7 6.9 11.1 12.0 11.3 10.8 12.6 20.2 100.0 619 6.76 5.00 45-49 2.5 2.7 4.2 2.6 8.6 10.3 9.9 9.2 11.4 11.3 27.1 100.0 504 7.17 5.13 Total 10.1 14.6 12.6 11.3 11.4 9.5 7.6 6.4 5.3 4.5 6.7 100.0 5,336 4.12 3.17 Fertility Table 4.5 Birth intervals Percent distribution of non-first births in the five years precedin g the survey by number of months since precedin g birth, according to background characteristics, Nigeria 2003 Median Number number of Number of months since preceding birth of months since Background non-first preceding characteristic 7-17 18-23 24-35 36-47 48+ Total births birth Age 15-19 21.1 22.8 44.1 9.5 2.6 100.0 91 26.1 20-29 10.4 17.8 43.9 18.1 9.8 100.0 2,302 29.1 30-39 7.9 12.7 37.2 20.8 21.4 100.0 1,979 33.3 40-49 8.0 9.0 28.8 19.1 35.0 100.0 564 38.7 Birth order 2-3 9.5 15.6 42.0 18.0 14.9 100.0 1,904 30.5 4-6 8.4 14.7 40.5 19.4 17.0 100.0 1,837 31.3 7+ 10.6 13.8 34.0 20.6 21.0 100.0 1,195 32.4 birth Male 10.1 15.5 39.7 18.5 16.2 100.0 2,468 30.7 Female 8.6 14.2 39.2 19.8 18.2 100.0 2,468 31.9 Survival of preceding birth Living 5.8 13.9 41.5 20.0 18.8 100.0 3,900 32.3 Dead 22.7 18.5 31.7 16.0 11.1 100.0 1,036 26.4 Residence Urban 7.8 14.9 38.1 19.4 19.8 100.0 1,383 31.7 Rural 10.0 14.8 40.0 19.0 16.2 100.0 3,554 31.1 Region North Central 7.4 12.9 37.9 20.4 21.4 100.0 704 33.2 North East 11.0 17.1 42.2 19.1 10.6 100.0 1,220 29.4 North West 9.3 15.2 39.7 20.1 15.7 100.0 1,757 31.3 South East 11.5 23.2 35.5 14.5 15.2 100
.0 282 27.2 South South 10.2 10.5 40.9 15.5 23.0 100.0 591 30.9 South West 5.2 9.8 33.8 21.4 29.9 100.0 383 36.5 Education No education 10.2 15.3 38.9 19.5 16.0 100.0 2,678 31.1 Primary 8.5 13.3 38.9 19.5 19.9 100.0 1,212 32.0 Secondary 8.8 14.7 42.6 18.0 15.9 100.0 888 30.6 Higher 5.9 19.4 36.0 15.8 22.9 100.0 158 32.2 Wealth quintile Lowest 9.8 16.2 38.9 19.4 15.7 100.0 1,163 30.8 Second 11.2 14.0 39.1 19.5 16.3 100.0 1,131 31.1 Middle 10.2 14.3 38.3 21.2 15.9 100.0 991 31.6 Fourth 6.8 13.8 42.7 18.3 18.4 100.0 902 31.2 Highest 7.9 15.8 38.7 16.6 21.0 100.0 749 31.4 Total 9.4 14.8 39.5 19.1 17.2 100.0 4,936 31.2 Note: First-order births are excluded. The interval for multiple births is the number of months since the preceding pregnancythat ended in a live birth. FertilityGE AT IRST The age at which childbearing begins influences the number of children a woman bears through-out her reproductive period in the absence of any active control. Table 4.6 shows the percent distribution of women by age at first birth, according to age at the time of the survey. For women age 25 and older, the median age at first birth is presented in the last column of the table. The data indicate that the age at first birth in Nigeria is increasing. For example, the median age at first birth is 20.3 years for women age 25-29, whereas it is less than 19 years among women 35 years and older. Also the percentage of women who gave birth before age 15 and 18 generally shows some postponement of first births by younger cohorts of mothers. For example, only 3 percent of women 15-19 had given birth by age 15 compared with at least 15 percent of those age 30 or older. Table 4.7 shows the median age at first birth among women age 25-49 by background character-istics. Women in urban areas initiate childbearing almost 2 years later than their counterparts in rural ar-eas. Among the six geopolitical regions, childbearing is started several years later in South East and S
outh West than in the North East and North West. Median age at first birth increases steadily with edu-cational attainment from 18 among women with no education to 25 among women with higher educa-tiona five-year difference. There is also a positive correlation by wealth quintile. Table 4.6 A g e at first birth Percentage of women who gave birth by specific exact ages, and median age at first birth, by current age, Nigeria 2003 Percentage Median Percentage who gave birth by exact age: who have Number age at never of first Current age 15 18 20 22 25 given birth women birth 15-19 3.4 na na na na 79.0 1,716 a 20-24 6.6 28.0 45.7 na na 41.6 1,494 a 25-29 8.3 31.5 47.4 61.9 77.0 16.8 1,382 20.3 30-34 15.1 39.2 57.5 70.9 82.2 8.0 941 19.2 35-39 15.6 46.6 61.6 74.3 86.3 2.5 816 18.4 40-44 16.2 43.1 59.1 71.2 82.1 5.5 688 18.8 45-49 15.0 46.7 62.0 73.6 83.7 3.3 583 18.5 na = Not applicable Omitted because less than 50 percent of women had a birth before reaching the beginning of the age group Fertility EENAGE REGNANCY AND OTHERHOODEarly childbearing, particularly among teenagers (those under 20 years of age) has negative demographic, socioeconomic, and sociocultural consequences. Teenage mothers are more likely to suffer from severe complications during delivery, which result in higher morbidity and mortality for both them-selves and their children. In addition, the socioeconomic advancement of teenage mothers in the areas of educational attainment and accessibility to job opportunities may be curtailed. Table 4.8 shows the percentage of women age 15-19 who are mothers or pregnant with their first child by background characteristics. One in five teenage women in Nigeria is a mother and another 4 per-cent are pregnant with their first child. Thus, 25 percent of teenage women have begun childbearing. As expected, the percentage who have begun childbearing increases with age from 8 percent of women age 15 to 40 percent of women age 19. Clearly, early childbearing is more of a rural
phenomenon, with 30 percent of rural women age 15-19 having begun childbearing compared with 17 percent of urban women. Adolescent fertility is low-est in the South West and South East, high in the South South and North Central, and highest in the North East and North West. This pattern follows the educational attainment gradient among the regions, with regions having the lowest levels of schooling among adolescents also having the highest levels of child-bearing among them. Table 4.7 Median a g e at first birth by back g round characteristics Median age at first birth among women age 20-49, by current age and background characteristics, Nigeria 2003 Current age Women Women Background age age characteristic 20-24 25-29 30-34 35-39 40-44 45-49 20-49 25-49 Urban a 22.1 20.2 18.9 20.0 18.8 a 20.4 Rural 19.6 19.3 18.8 18.3 18.4 18.1 19.0 18.7 Region North Central a 20.4 19.8 18.9 18.9 18.9 20.0 19.7 North East 18.3 18.1 17.3 18.0 17.2 18.2 18.0 17.8 North West 18.0 18.3 17.5 16.9 18.1 17.8 17.9 17.8 South East a a 22.5 22.0 20.8 19.5 a 22.7 South South a 22.2 20.2 17.9 18.4 17.2 a 19.8 South West a 23.7 22.4 21.4 21.0 20.5 a 22.1 Education No education 17.7 18.0 17.4 17.4 17.7 18.3 17.7 17.8 Primary 19.2 19.5 19.0 18.6 19.1 17.6 19.0 18.9 Secondary a 22.9 21.7 21.2 21.3 23.4 a 22.3 Higher a a 26.1 22.7 23.3 20.4 a 24.9 Wealth quintile Lowest 18.4 17.7 18.5 17.6 17.1 18.8 18.0 17.9 Second 19.0 18.5 17.5 18.0 18.5 17.9 18.4 18.2 Middle 19.4 18.8 18.4 18.1 19.0 17.8 18.7 18.5 Fourth a 21.2 19.7 17.3 19.2 18.6 19.9 19.5 Highest a 24.4 22.1 21.9 20.5 19.6 a 22.5 Total a 20.3 19.2 18.4 18.8 18.5 19.6 19.3 Omitted because less than 50 percent of the women had a birth before the beginning of the age group FertilityTable 4.8 shows that whereas more than half of women age 15-19 who h
ave no formal education have begun childbearing (54 percent), 9 percent of those with secondary education have done so. Thus, initiation of childbearing is delayed among those who stay in school. The wealth index shows that as the socioeconomic status of households increases, the likelihood of teenage childbearing decreases. That is, women living in less advantaged households are more likely to initiate childbearing before age 20 than those living in relatively more advantaged households. Table 4.8 Teena g e pre g nancy and motherhood Percentage of women age 15-19 who are mothers or pregnant with their first child, by background characteristics, Nigeria 2003 Percentage who are: Percentage who have Pregnant begun Number Background with first child- of characteristic Mothers child bearing womenAge 15 3.8 3.7 7.5 391 16 9.4 4.6 13.9 273 17 26.9 4.2 31.1 324 18 29.2 5.0 34.2 429 19 35.8 3.7 39.5 299Residence Urban 13.6 3.1 16.7 580 Rural 24.8 4.8 29.6 1,136Region North Central 13.8 2.6 16.4 242 North East 38.1 6.3 44.4 294 North West 36.9 8.3 45.2 420 South East 5.3 0.8 6.2 180 South South 11.3 3.0 14.3 362 South West 4.1 0.6 4.7 218Education No education 44.5 9.5 53.9 501 Primary 20.5 3.0 23.5 360 Secondary 7.6 1.8 9.4 831 Higher * * * 23Wealth quintile Lowest 27.4 4.8 32.2 270 Second 30.2 5.4 35.6 299 Middle 22.8 5.6 28.4 375 Fourth 18.0 4.7 22.8 404 Highest 10.1 1.0 11.2 367 Total 21.0 4.3 25.2 1,716 Note: An asterisk indicates that a figure is based on fewer than 25 un-weighted cases and has been suppressed. Fertility Table 4.1 Current fertility Age-specific and cumulative fertility rates, the g eneral fertility rate, and the crude birth rate for the three years precedin g the survey, by g e roup 45-49 may be slightly biased due to truncation.TFR: Total fertility rate for ages 15-49, GFR: General fertility rate (births divided by number of women age 15-44) expressed per CBR: Crude birth rate expressed per