
Figure S2 Heat map of genetic correlations and scree plot for regional cortical thickness Figure S3 SAderived GIBN1 includes inferior temporal isthmus cingulate postcentral precuneus superior parietal supramarginal and temporal pole regions a Manhattan plot b QQ plot λ 112 ID: 1042052
Download Presentation The PPT/PDF document "Figure S1. Heat map of genetic correlat..." is the property of its rightful owner. Permission is granted to download and print the materials on this web site for personal, non-commercial use only, and to display it on your personal computer provided you do not modify the materials and that you retain all copyright notices contained in the materials. By downloading content from our website, you accept the terms of this agreement.

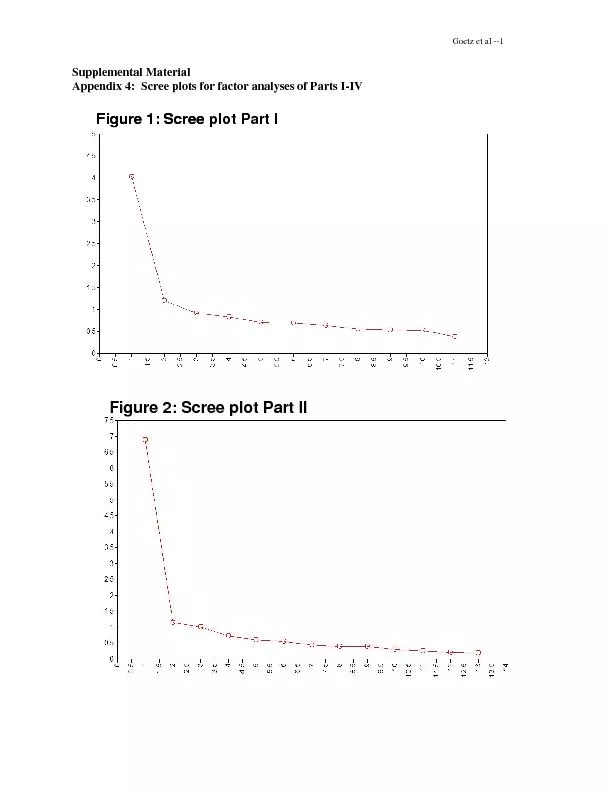


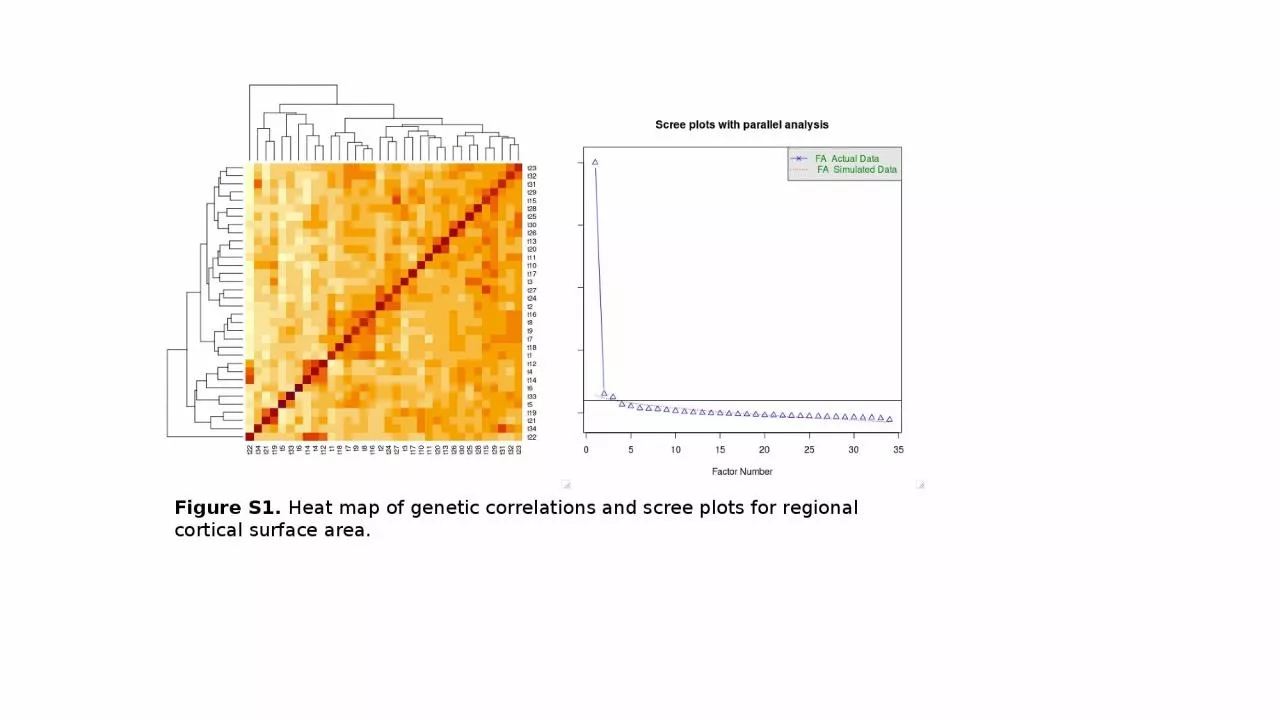
1. Figure S1. Heat map of genetic correlations and scree plots for regional cortical surface area.
2. Figure S2. Heat map of genetic correlations and scree plot for regional cortical thickness.
3. Figure S3. SA-derived GIBN-1 includes inferior temporal, isthmus cingulate, postcentral, precuneus, superior parietal, supramarginal, and temporal pole regions. (a) Manhattan plot (b) QQ plot, λ = 1.129 2 3 4 5 6 7 8 9 10 11 12 13 14 15 16 17 18 19 20 22 chromosome -log10(P) 1 5 10 15 200 1 2 3 4 5 6 7 QQ
4. 2 3 4 5 6 7 8 9 10 11 12 13 14 15 16 17 18 19 20 22 chromosome -log10(P) 1 5 10 15 200 1 2 3 4 5 6 7 QQFigure S4. SA-derived GIBN-2 includes caudal anterior cingulate, caudal middle frontal, medial orbitofrontal, paracentral, and rostral anterior cingulate regions. (a) Manhattan plot (b) QQ plot, λ = 1.41
5. 2 3 4 5 6 7 8 9 10 11 12 13 14 15 16 17 18 19 20 22 chromosome -log10(P) 1 5 10 15 0 1 2 3 4 5 6 7 QQFigure S5. SA-derived GIBN-3 includes banks superior temporal sulcus (STS), inferior parietal, and middle temporal regions. (a) Manhattan plot (b) QQ plot, λ = 1.13
6. 2 3 4 5 6 7 8 9 10 11 12 13 14 15 16 17 18 19 20 22 chromosome -log10(P) 0 2 4 6 8 10 120 1 2 3 4 5 6 7 QQFigure S6. SA-derived GIBN-4 includes pars opercularis, pars orbitalis, and pars triangularis regions. (a) Manhattan plot (b) QQ plot, λ = 1.119
7. 2 3 4 5 6 7 8 9 10 11 12 13 14 15 16 17 18 19 20 22 chromosome -log10(P) 1 5 10 15 200 1 2 3 4 5 6 7 QQFigure S7. SA-derived GIBN-5 includes cuneus, lateral occipital, lingual, and pericalcarine regions. (a) Manhattan plot (b) QQ plot, λ = 1.117
8. Figure S8. SA-derived GIBN-6 includes superior temporal, and transverse temporal regions. (a) Manhattan plot (b) QQ plot, λ = 1.157 2 3 4 5 6 7 8 9 10 11 12 13 14 15 16 17 18 19 20 22 chromosome -log10(P) 0 2 4 6 8 10 12 140 1 2 3 4 5 6 7 QQ
9. 2 3 4 5 6 7 8 9 10 11 12 13 14 15 16 17 18 19 20 22 chromosome -log10(P) 0 2 4 6 8 10 0 1 2 3 4 5 6 7 QQFigure S9. CT-derived GIBN-1 includes banks STS, caudal middle frontal, inferior parietal, paracentral, pars opercularis, post-central, pre-central, precuneus, rostral middle frontal, superior frontal, superior parietal, and supramarginal regions. (a) Manhattan plot (b) QQ plot, λ = 1.108
10. 2 3 4 5 6 7 8 9 10 11 12 13 14 15 16 17 18 19 20 22 chromosome -log10(P) 1 5 10 15 200 1 2 3 4 5 6 7 QQFigure S10. CT-derived GIBN-2 includes caudal anterior cingulate, frontal pole, insula, lateral orbitofrontal, medial orbitofrontal, pars orbitalis, rostral anterior cingulate, and rostral middle frontal regions. (a) Manhattan plot (b) QQ plot, λ = 1.091
11. 2 3 4 5 6 7 8 9 10 11 12 13 14 15 16 17 18 19 20 22 chromosome -log10(P) 0 2 4 6 8 10 0 1 2 3 4 5 6 7 QQFigure S11. SA-derived GIBN-3 includes banks STS, superior temporal, and temporal pole regions. (a) Manhattan plot (b) QQ plot, λ = 1.105.
12. 2 3 4 5 6 7 8 9 10 11 12 13 14 15 16 17 18 19 20 22 chromosomeFigure S12. CT-derived GIBN-4 includes cuneus, lateral occipital, parahippocampal, and pericalcarine regions. (a) Manhattan plot (b) QQ plot, λ = 1.063 -log10(P) 0 2 4 6 8 10 120 1 2 3 4 5 6 7 QQ