
Jeffrey Heer Stanford University Joe Hellerstein UC Berkeley TexPoint fonts used in EMF Read the TexPoint manual before you delete this box A A A Visualization Reference Model ID: 1030513
Download Presentation The PPT/PDF document "Scalable Data Visualization and Social D..." is the property of its rightful owner. Permission is granted to download and print the materials on this web site for personal, non-commercial use only, and to display it on your personal computer provided you do not modify the materials and that you retain all copyright notices contained in the materials. By downloading content from our website, you accept the terms of this agreement.


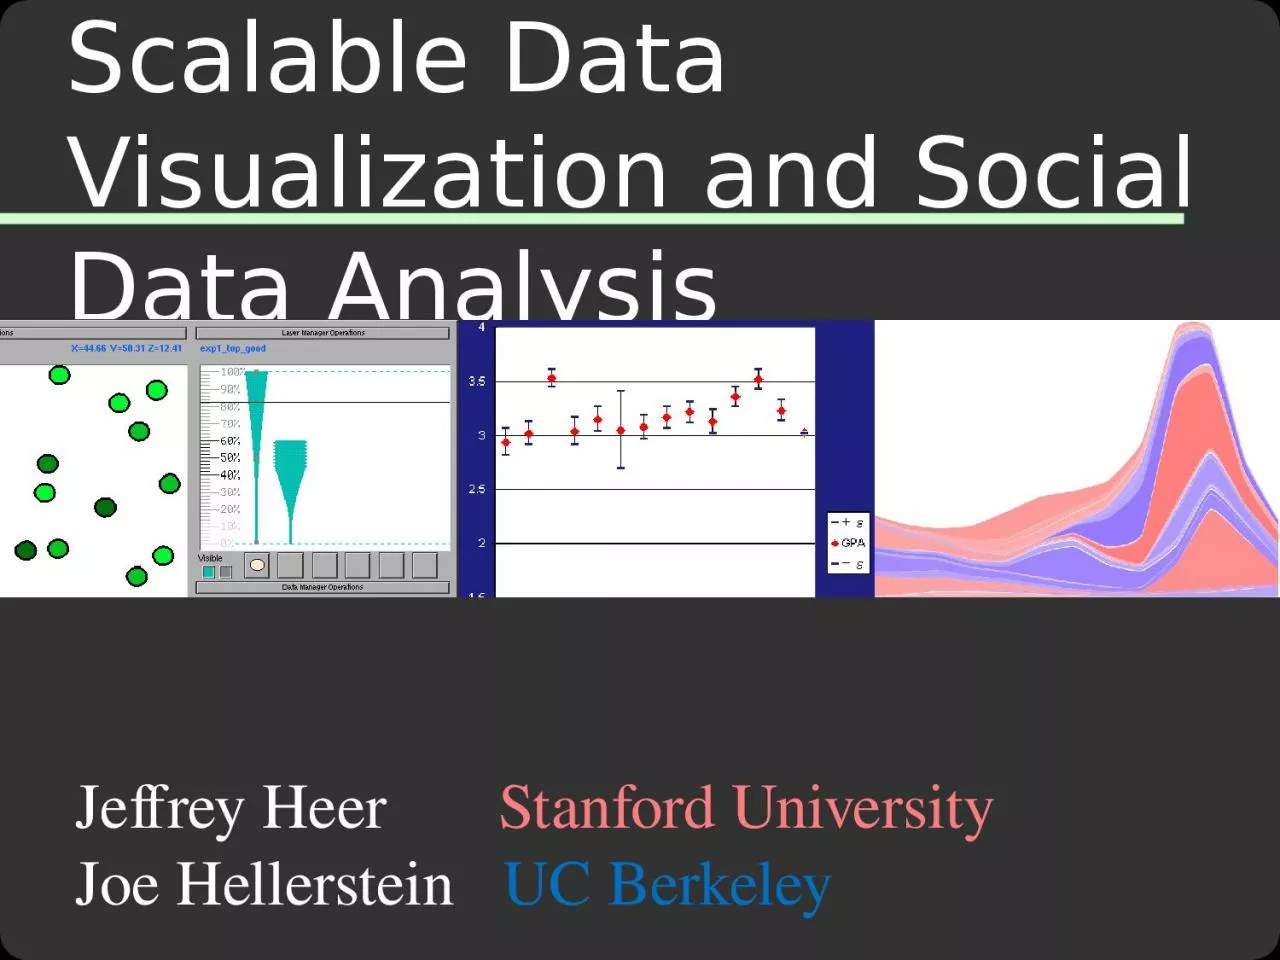
1. Scalable Data Visualization and Social Data AnalysisJeffrey Heer Stanford UniversityJoe Hellerstein UC BerkeleyTexPoint fonts used in EMF. Read the TexPoint manual before you delete this box.: AAA
2. Visualization Reference ModelRaw DataData TablesVisual StructuresViews Data TransformationsVisual EncodingsView TransformationsTask1010101….
3. Interactivity and ScaleVisualization as query specificationLeave Big Data in the database2 DB research tools: Datasplash and DEVise
4. Visualization Reference ModelRaw DataData TablesVisual StructuresViews Data TransformationsVisual EncodingsView TransformationsTask1010101….
5. Interactivity and ScaleVisualization as query specificationLeave Big Data in the database2 DB research tools: Datasplash and DEViseInteractivity via precomputationOLAPSketches, synopses
6. Visualization Reference ModelRaw DataData TablesVisual StructuresViews Data TransformationsVisual EncodingsView TransformationsTask1010101….
7. Interactivity and ScaleVisualization as query specificationLeave Big Data in the databasePeek at 2 research tools: Datasplash and DEViseInteractivity via precomputationOLAPSketches, synopsesInteractivity via online methodsCONTROL: Online Aggregation and moreintegration of vis, DB and stat!
8. Visualization Reference ModelRaw DataData TablesVisual StructuresViews Data TransformationsVisual EncodingsView Transformations1010101….
9. Interactivity and ScaleVisualization as query specificationLeave Big Data in the databasePeek at 2 research tools: Datasplash and DEViseInteractivity via precomputationOLAPSketches, synopsesInteractivity via online methodsCONTROL: Online Aggregation and moreintegration of vis, DB and stat!
10. Datasplash2 Query builders:Tioga box-and-arrow relational+UDFVIQING direct-manipulation interface for composite visualizationsVisual mappings: one “mark” per row of outputRow attributes mark attributes via “paint” interface x, y, height, width, color, rotation, picture, etc.Pan in x/y space, semantic zoom in zLayer manager for overlays generalizes drill-down/roll-upAids for designer to maintain Constant Information DensityVariety of links/navigation between visualizationsSee Olston/Woodruff InfoVis2000, Baldonado, etal. AVI2000Influenced commercial products at Illustra/InformixWoodruff, Olston, et al. J. Vis Lang & Comp 2001
11. Datasplash: Semantic Zoomdatasplash.cs.berkeley.edu
12. Datasplash: Semantic Zoomdatasplash.cs.berkeley.edu
13. Datasplash: Information Densitydatasplash.cs.berkeley.edu
14. DEViseVisual relational query builderMapping: one “mark” per row of outputRow attributes mark attributes x, y, height, width, color, rotation, picture, etc.Visual filters map back to relational input queryFocus on multiple linked visualizationsVarious linking modelsProposed collaboration facilities (!!)Active Reports: a vis definition and relevant dataCollaborate by shipping visual specs between multiple Active ReportsDistributed queries & optimizationStill in use by Wisconsin BioMagResBankLivny, Ramakrishnan, Bayer, et al. SIGMOD‘97
15. Typical DEVise PresentationMultipleviewsMultiplewindowspages.cs.wisc.edu/~devise
16. rankingvs. documentdocuments with same category and yeardocuments with samecategory sourceselected documentcategory vs.yearcategory vs.sourceRankingvsyearRankingvssourceselectedcourtesy Raghu Ramakrishnan
17. Common ThemesVisual query specificationVariety of ideas, convergence only on basicsShip query to DB, ship (small) results to UIVisualization defined by row mark mapScales with visual densityBrowser selections push down into queryMultiple views and linked navigation
18. Scaling Data VisualizationVisualization as query specificationLeave Big Data in the databasePeek at 2 research tools: Datasplash and DEViseInteractivity via precomputationOLAPSketches, synopsesInteractivity via online methodsCONTROL: Online Aggregation and moreintegration of vis, DB and stat
19. Precomputation: OLAPSpecifically, Multidimensional OLAP (MOLAP)Complete results for sub-cubesMuch work on which sub-cubes to precomputeLittle documentation on interface decisionsSignificant design theme here:Provide UI affordances only for the fast stuffAlso manifest in desktop tools like Excel
20. Precomputation: SketchingAlso known as synopsis data structuresExtensive family of algorithmic workNot a visual metaphorBell Labs AQUA projectSee Garofalakis tutorialsA few system integrationsE.g. Reiss’ Data Triage in Telegraph [ICDE 2006]Essentially no interface discussions
21. Scaling Data VisualizationVisualization as query specificationLeave Big Data in the databasePeek at 2 research tools: Datasplash and DEViseInteractivity via precomputationOLAPSketches, synopsesInteractivity via online methodsCONTROL: Online Aggregation and moreintegration of vis, DB and stat!
22. Interactivity and Big DataBackgroundCONTROL examplesOnline aggregationDensity plots for Datasplash (Clouds)Potter’s Wheel spreadsheet for data cleaningBasic query processing supportSamplingOnline reordering
23. High Tech Batch Interfaces IMicrosoft Query
24. High Tech Batch Interfaces IIInformix Metacube
25. High Tech Batch Interfaces IIIHadoop
26. Typical ApproachesOnly final, exact answers made available“HCI solution”: interactivity trumps scaleE.g. MS Excel, Multidimensional OLAP“Systems solution”: scale trumps interactivityE.g. HadoopCan’t we all just get along?
27. CONTROL“Of all men's miseries, the bitterest is this:to know so much and have control over nothing”-- HerodotusRequirements for CONTROL systemsEarly answersRefinement over timeInteraction and ad-hoc control“Crystal Ball” vs. Black Boxvs. “Lucite Watch”Hellerstein, Avnur, Chou et al. IEEE Computer 1999Continuous Output, Navigation andTransformation with Refinement On-Line
28. Goals for Online Processing“Greedy” performance regimeMaximize 1st derivative of the “mirth index”Or batch at some suitable “animation rate”Mirth defined on-the-fly Therefore need FEEDBACK and CONTROLTime100%OnlineTraditional
29. Online AggregationSELECT AVG(temp) FROM t GROUP BY site330K rows in table (synthetic data)the exact answer:Courtesy Peter Haas, IBM
30. Online Aggregation, cont’dA simple online aggregation interface (after 74 rows)Courtesy Peter Haas, IBM
31. Online Aggregation, cont’dAfter 834 rows:Courtesy Peter Haas, IBM
32. Example: Online AggregationControlsper Group: Speed up Slow down Terminate
33. Online Visual AggregationCLOUDS [Chris Olston, undergraduate]
34. Potter’s Wheel [Raman/Hellerstein VLDB 2001]Scalable spreadsheetA fraction of data is materialized in GUI widgetScrolling = preference for delivering quantiles to widgetEasy visual query modificationInteractive data cleaningVisual transformation algebraTransformation by exampleOnline structure and discrepancy detectionMinimum Description Length methods meet ADTs
35. Scalable Spreadsheets
36. Visual Transformation Shot
37.
38. Some Building BlocksFocus on some generally useful toolsData access, data deliveryMuch more in the literatureJoin algorithmsAggregate estimatorsSubqueriesQuery processing frameworks(Citations below)
39. Sampling w/o ReplacementWe want i.i.d. samples w/o replacementAt any time, the input to the query is a sampleInput grows over timeCan pre-sort tables randomlyRe-randomize incrementally in the backgroundSee [Jermaine, TKDE 2007] and [Joshi/Jermaine, TKDE 2008]Techniques for random sampling in DBs well studiedBoth from files and from indexesSome tricks hereOlken’s Ph.D. thesis
40. Preferential Data DeliveryWhy neededSpeedup/slowdown arrowsSpreadsheet scrollbarsPipeline quasi-sortOnline Reordering [Raman2/Hellerstein, VLDB ‘99]Excellent in most cases, general purposeWe’ll focus on this, but…If index pre-exists, can play other gamesIndex stride [Hellerstein/Haas/Wang, SIGMOD ‘97]High I/O costs, good for frequency outliers Can “mix and match” techniques adaptively! [Raman/Hellerstein, ICDE ‘03]
41. Online Reordering Deliver “interesting” items first“Interesting” determined on the flyExploit rate gap between produce and process/consumeprocessconsumejointransmitproducedisk[Raman2/Hellerstein, VLDB ‘99]
42. Online ReorderingDeliver “interesting” items first“Interesting” determined on the flyExploit rate gap between produce and process/consumereorderprocessconsumejointransmitproducedisk
43. MechanismTwo threadsprefetch from inputspool/enrich from auxiliary side diskJuggle data between buffer and side diskkeep buffer full of “interesting” itemsgetNext chooses best item currently on buffergetNext, enrich/spool decisions -- based on reordering policySide disk managementhash index, populated in a way that postpones random I/Oplay both sides of sort/hash dualitybufferspoolprefetchenrichgetNextside diskproduceprocess/consume
44. Policies“good” permutation of items t1 … tn to t1…tnquality of feedback for a prefix t1t2…tkQOF(UP(t1), UP(t2), … UP(tk )), UP = user preference determined by applicationgoodness of reordering: dQOF/dtimplication for juggle mechanism process gets item from buffer that maximizes dQOF/dtjuggle tries to maintain buffer with such itemsQOF
45. Example: Online AggregationMetric: avg weighted confidence intervalPreference acts as weight on confidence intervalQOF = UPi / (ni)1/2ni = number of tuples processed from groupprocess pulls items from group with max UPi / ni3/2desired ratio of group i in buffer = UPi2/3/j UPj2/3 juggle tries to maintain this by enrich/spoolSimilar derivations for other preferencese.g. explicit rates, explicit ranking, etc.
46. More Online Query ProcessingJoins & EstimatorsRipple Joins [Haas/Hellerstein SIGMOD ‘99]DBO’s “one-level step” [Jermaine, et al. SIGMOD ’07]Correlated Subqueries [Joshi/Jermaine VLDBJ ‘09]Distributed Online Aggregation [Wu, et al. VLDB ‘09]