
Earths gravitational force Atmospheric Pressure As the atmosphere is held down by gravity it exerts a force upon every surface pressure force per unit area At sea level the force is the weight of 1 kg of air that lies above each square centimeter of the surface around 15 lbs per in ID: 1001041
Download Presentation The PPT/PDF document "Measuring air pressure Modern Barometers" is the property of its rightful owner. Permission is granted to download and print the materials on this web site for personal, non-commercial use only, and to display it on your personal computer provided you do not modify the materials and that you retain all copyright notices contained in the materials. By downloading content from our website, you accept the terms of this agreement.


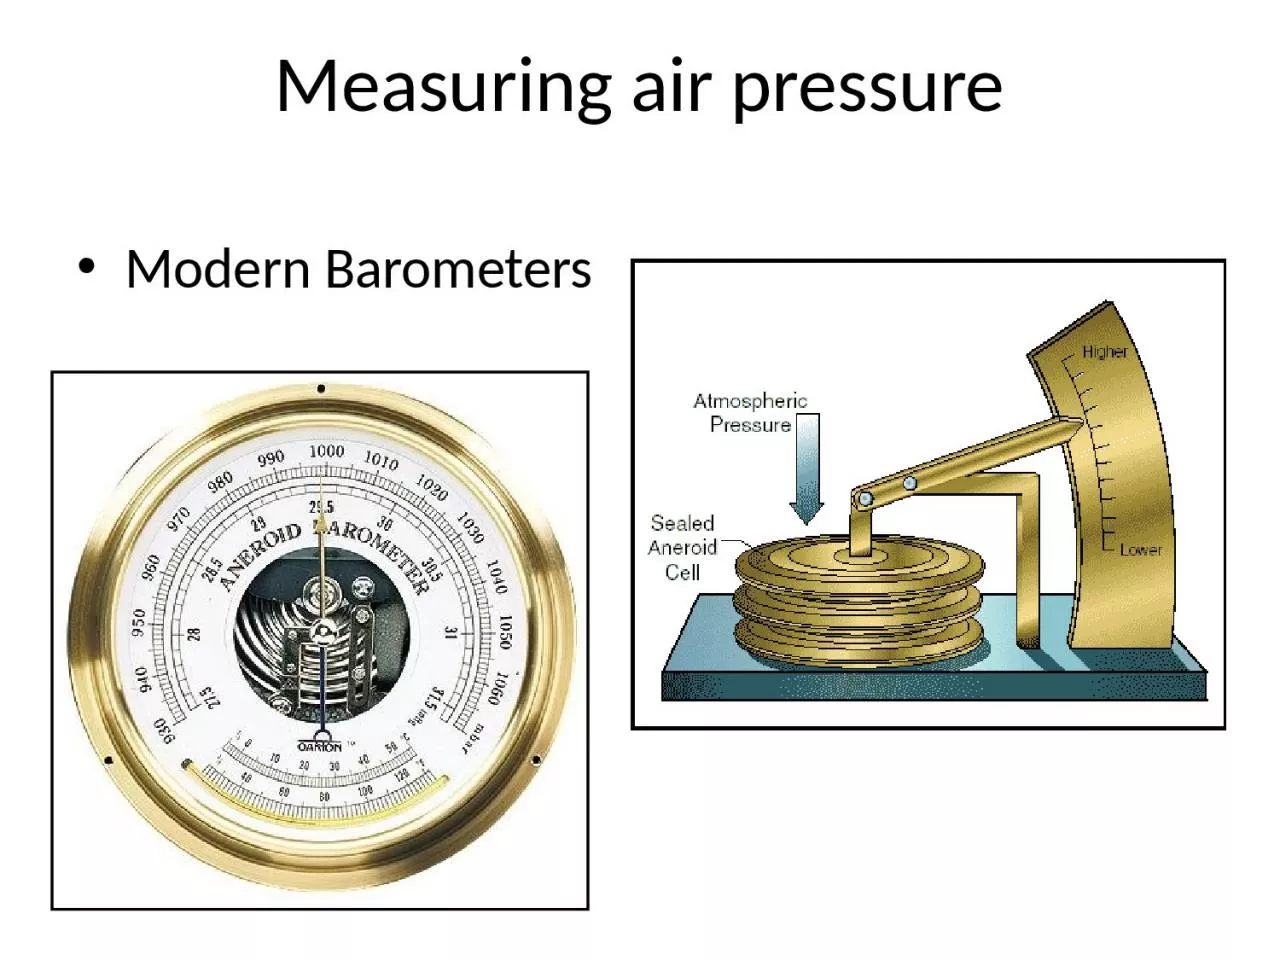
1. Measuring air pressureModern Barometers
2. Earth’s gravitational forceAtmospheric PressureAs the atmosphere is held down by gravity, it exerts a force upon every surface (pressure = force per unit area)At sea level the force is the weight of 1 kg of air that lies above each square centimeter of the surface (around 15 lbs per in2)
3.
4. weak pressure gradientThe pressure gradient force acts at right angles to the isobars (90 degrees)This exists because the earth is unevenly heatedstrong pressure gradient820830840850860870880890820830840850860Differences in air pressure = a pressure gradient
5. Wind: Description and MovementWindAnemometerWind vanehttp://www.daviddarling.info/encyclopedia/A/AE_anemometer.html
6. Naming WindFigure 6.5
7. Pressure Gradient ForceFigure 6.6a
8.
9.
10.
11. Upper air pressure gradient andgeostrophic wind
12. SUNWarmLow PressureColdHigh PressureBut heat is transported from the Equator to the Poles - how?0o30oN60oN30oS60oS90oN90oNEarth
13. warm air rises at the equator producing low pressure (Intertropical Convergence Zone, ITCZ) and flows towards the polesL0o30oN60oN30oS60oS90oN90oN
14. Cold air sinks at 30oN and S latitude Creating high pressure(subtropical high pressure, STH)L0o30oN60oN30oS60oS90oN90oNHH
15. Northeasterly and southeasterly surface winds flow from the subtropical high pressure belts (30o N and S) to the low pressure belt (ITCZ) at the equator (calm winds: doldrums) westerly surface winds flow from the subtropical high pressure belts towards higher latitudes L0o30oN60oN30oS60oS90oN90oNHH
16. westerly surface winds are forced to rise around 60o N and S latitude when they encounter cold polar easterly winds from the poles resulting in Subpolar Low pressure (SPL) beltsL0o30oN60oN30oS60oS90oN90oNHHLL
17. cold air sinks at the poles producing polar high (PH) pressure regionsL0o30oN60oN30oS60oS90oN90oNHHLLHH
18. Figure 5.17, p. 163
19. Jet streams are streams of fast moving air aloft that occur where atmospheric temperature gradients are strongL0o30oN60oN30oS60oS90oN90oNHHLLHHpolar jet streampolar jet streamsubtropicaljet streams
20.
21.
22.
23.
24.
25.
26.
27.
28.
29. Schematic view of the molecular structure of water in its three physical states and heat-energy exchange among those states. The latent heat-exchange numbers between the arrows are explained in the text (values are for 0°C). Phase Changes of Water, Latent HeatHeat is consumed in evaporation, melting; heat is released in condensation, freezing (sublimation).
30. Variation of saturation vapor pressure (mb) with temperature (C). The curve is nearly a pure exponential. At temperatures below 0C saturation values over supercooled water are greater than over ice.Measurements of water vaporVapor pressure is the pressure exerted by water vapor moleculesSaturated vapor pressure is maximum pressure of water vapor at that temperatureDew point is the temperature the air must be cooled to reach saturationRelative humidity is ratio of water vapor in air to maximum the air can hold at that temperature. RH is usually highest when daily temp-erature is lowest.Specific humidity is the mass of waterVapor in the air per unit mass of air.Mixing ratio is the mass of water vapor in The air to the mass of dry air containing the Water vapor.
31.
32.
33. “The Mountain Problem”Effect of orographic liftingThink of the Cascades as an example;Relationship between humidity, saturation, DALR, SALR (or WALR), and Lifting Condensation Level
34. Hydrologic cycle. The numbers attached to the stages express each value as the volume of water divided by Earth surface area. Thus the values shown represent the depth of water (centimeters per year) associated with each mass transfer. All can be directly compared to the global average precipitation rate, which is about 100 cm/year. Fig 12.2
35. Distribution of water in the hydrosphere. The middle and lower bars show the percentage distribution of the 2.8 percent of total hydrospheric water that is fresh. Of that freshwater component, only about one-tenth is easily available to humans. Water in the HydrosphereMost of the water is salt water in the oceanMost of the fresh water is locked up in ice sheets and glaciersMost of the liquid fresh water is in the groundFig 12.3
36. Total water withdrawals (millions gallons per day) for the United States in 2005.Water Usage in the United States, 2005Which states use the most water?
37. Condensation near the ground forms fog, a cloud in contact with the ground.As the ground and surface air cools to the dewpoint, water vapor condenses into a radiation fog (cooling by longwave radiation overnight) here in East Africa.
38. Schematic diagram of the different cloud types – stratus, cumulus, and cirrus, arranged by their typical altitude.Cloud Types
39. Precipitation ProcessesThe Ice-Crystal Process-requires the coexistence of ice and super-cooled water droplets in the cloud. Ice grows at the expense of water droplets that evaporate water molecules which adhere to the ice until they are large enough to fall as snow. If the air is warm enough, the snow melts and rain occurs.The Coalescence Process-requires different sizes of water droplets within warm clouds. Larger droplets grow by falling faster and sweeping up smaller droplets by coalescing until they are large enough to fall as rain.Source: http://collider.com/singin-in-the-rain-60th-anniversary-blu-ray-review/191992/
40. Four major forms of precipitation. (A) A rainstorm douses the Ponderosa Pine Forest near Flagstaff, Arizona. (B) Falling snow accumulates in south-central Alaska. (C) Freezing rain forms an icy coating on pine needles on a golf course in Wawona, near Yosemite National Park, California. (D) Golf-ball-sized hailstones litter the countryside following a storm in northern Texas.Besides rain and snow, there is: Sleet-melting ice that refreezes before reaching groundFreezing rain-melting ice that freezes on contact with a frozen surfaceHail-ice particles that grow within clouds that have strong updraftsGraupel-soft, partially melted hailSource: http://climate.met.psu.edu/features/Hail/PEMA_hail.phpTypes of Precipitation
41. Four Forms of PrecipitationABCDA-rainstorm B-snowC-freezing rainD-hail
42. Range of water balance conditions found at the surface of Earth. (A) Baghdad, Iraq, experiences a constant deficit because potential evapotranspiration normally exceeds precipitation. (B) At Tokyo, Japan, the situation is reversed, and a constant water surplus is recorded. (C) At Faro, Portugal, the intermediate situation occurs, with a combination of surplus and deficit at different times of the year.Water Balance for Different Climates
43. Water Balance Averages by LatitudeAverage annual latitudinal distribution of precipitation, evapotranspiration, and runoff in cm per year. The arrows show the direction of the water vapor flux by the atmospheric circulation.
44. Global distribution of annual evaporation and evapotranspiration in centimeters, with land elevations adjusted to sea level. Red isolines show the pattern over land; blue isolines over the oceans. Global Distribution of Annual Evaporation, EvapotranspirationFig 12.10?
45. Global Distribution of Annual PrecipitationGlobal distribution of annual precipitation in millimeters/day.Source: http://www-das.uwyo.edu/~geerts/cwx/notes/chap10/global_precip.html
46. Air MassesAn air mass is a large body of air with relatively homogeneous character of temperature and humidity.Classification by latitude, moisture mT, mP, cA, cP, cTMovement and transitions-character of air masses can change as moves over different land surfaces, or crosses mountains, ie mP can become cP after crossing the Rockies, cP can become mT when moving over warm water.Source: https://www.meted.ucar.edu/sign_in.php?go_back_to=http%253A%252F%252Fwww.meted.ucar.edu%252Ffire%252Fs290%252Funit7%252Fprint_3.htm
47. Source regions and common paths of the principal air masses that affect the continental United States. North American Air Masses & Sources
48. Lifting Mechanisms That Produce PrecipitationConvergence-when similar air masses converge, they are forced to rise, forming cloudsConvection-surface heating causes warm air parcel to rise and form cloudsOrographic-mountains and large obstacles force air to rise, forming cloudsFrontal-when warm and cold air masses meet, cold air lifts warmer air forming cloudsSource: http://keithrogershome.com/Chap7CldsPcpnFog.html
49. Lifting by ConvergenceAlong the ITCZ warm trades meet and rise. Precipitation along the ITCZ shifts with season, into the summer hemisphere.Average daily rainfall rates (mm/day) for January and July based upon measurements from the Tropical Rainfall Measuring Mission (TRMM) satellite for the years 1998-2007.
50. Vertical cross-section through a warm front (top) and cold front (bottom). The vertical scale is greatly exaggerated. Warm fronts typically have a 1:200 vertical-to-horizontal ratio; the ratio for cold fronts is approximately 1:70.Frontal Precipitation
51. Convectional PrecipitationConvection often leads to isolated showers from building cumulus clouds. Occasionally, these clouds grow large enough to form thunderstorms. Each thunderstorm cloud, cumulonimbus, has a life cycle of 3 stages.The three stages of the life cycle of an air mass thunderstorm: cumulus, mature, and dissipating. Updrafts dominate the developing stage, both updrafts and downdrafts are found during the mature stage, while only downdrafts are found during the dissipating stage. The approximate width at each stage of the thunderstorm is shown at the bottom.
52. Cumulonimbus grows near the Canadian Rockies in an afternoon thunderstorm. Source: http://www.physicalgeography.net/fundamentals/7t.html
53. Severe ThunderstormsConceptual model of a severe thunderstorm producing sizeable hailstones. The red dashed lines represent the warm updrafts, the blue lines show the cold downdrafts, and the green lines represent the movement of hailstones. The thunderstorm is moving from left to right.
54. Orographic precipitation on the upper windward slope of the Cascade Mountains in west-central Oregon. Note the significant temperature and moisture differences between the windward and leeward sides of this major mountain barrier. (Vertical scale is greatly exaggerated.)Orographic PrecipitationFig 13.7
55. Oregon’s precipitation pattern, with the distribution of isohyets exhibiting the results of the orographic effect as westerly winds off the Pacific are forced across the north-south-trending Cascade Mountains. The transect across the Cascades between Eugene and Bend, diagrammed in Fig. 12.10, is marked by a red line. Fig 13.8