

University of Vienna Austria TARC Master Class London 2014 Tax Psychology 3 Decisions under uncertainty risk 2 2 2 2 2 2 Economics Ideas of humankind Homo Oeconomicus Utility maximization ID: 276862
Download Presentation The PPT/PDF document "Erich Kirchler" is the property of its rightful owner. Permission is granted to download and print the materials on this web site for personal, non-commercial use only, and to display it on your personal computer provided you do not modify the materials and that you retain all copyright notices contained in the materials. By downloading content from our website, you accept the terms of this agreement.


Slide1
Erich Kirchler
University of Vienna, AustriaTARC Master ClassLondon - 2014
Tax Psychology (3)
Decisions under uncertainty (risk)Slide2
2
22
2
2
2
Economics
Ideas of humankind:
Homo
Oeconomicus
Utility maximization
Rationality (consistent, goal-oriented
behaviour
)Slide3
3
333
3
Economics
Utility maximization
Rationality assumptions: Axioms
C
ompleteness (a > b; b = c; c > d; ...)
T
ransitivity (if a > b and b > c, then a > c)Reflexivity (a = a)
N
on-satiation (a + 1 > a)
C
ontinuity (a, b) = (a – x, b + y)
C
onvexity (Law of Saturation)Slide4
Paying
taxes as outcome of a decision
under
riskSlide5
Tax rate
Income
Audit probability
Fines
Tax compliance 1
Tax evasion
1 - p
p
No audit
Audit
Net income
Net income + evaded amount
Net income - fine
How
to
increase
and
guarantee
tax
compliance
?
Decision
under
risk
Allingham
&
Sandmo
(1972); Srinivasan (1973)
Becker, G. S. (1968). Crime and punishment: An economic approach. Journal of Political Economy, 76, 169-217.
Sure
option
Risky
optionSlide6
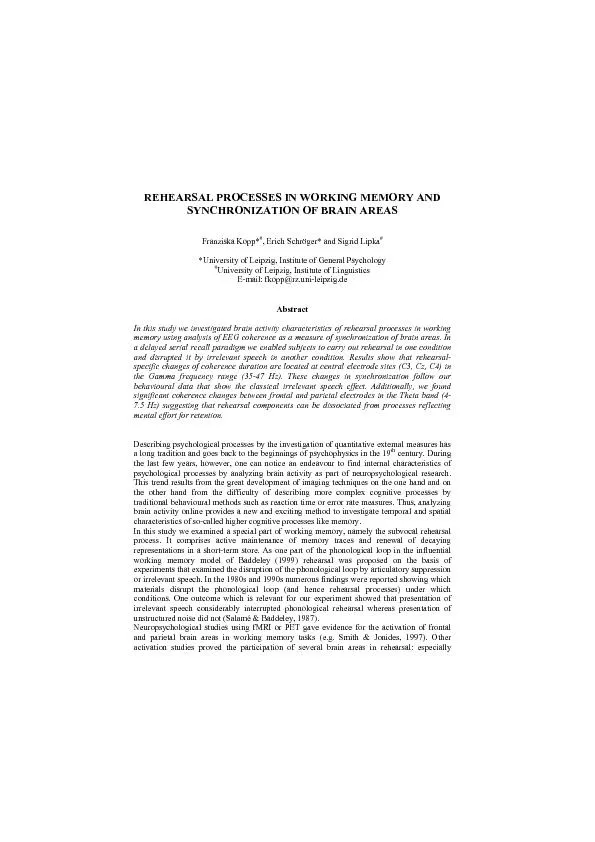
Average compliance rate by fine rate and audit probability (standard deviations in parentheses;
Alm et al., 1995, p. 11)
Audit Fine rate
probability 1 2 4
-----------------------------------------------------------------------------
0.05
9.0 ( 4.0)
6.9 ( 3.2) 12.2 ( 4.2)
0.30 10.9 ( 6.0)
21.4 ( 4.4)
39.8 ( 7.4)
0.60 9.8 ( 8.0) 54.8 (10.6)
70.3 ( 7.5)Slide7
What does the theory say
about what motivates tax compliance ?The standard theory of human behaviour is based on several
assumptions
:
Individuals
are rational,
Individuals have unlimited willpower,Individuals
are self-interested.From
James Alm, 2014, Tulane University, USA.Slide8
What does the theory say
about what motivates tax compliance ?The starting point: Economics-of-crime modelA rational individual weights
the
expected
benefits of successful cheating
against the risky prospect of detection and punishment.
The individual pays taxes because he or she
is afraid of getting caught
and
penalized
.
Indeed
,
the
individual
pays
taxes
because
– and
only
because
– of
the
fear of detection and punishment.Compliance depends upon enforcement.From James Alm, 2014, Tulane University, USA.Slide9
What does the theory say
about what motivates tax compliance ?However, …Individuals face limits of their ability
to
compute
(e.g., bounded rationality)
They systematically misperceive, or do not perceive
at all, the true cost of their actions
(e.g., fiscal illusion, saliency
,
overweighting
of (
low
)
probabilities
)
They
face
limits
of
their
self-control
(e.g.,
hyperboic
discounting; Christmas club savings)They are affected by the
ways in which choices are framed (e.g., reference points, gains versus losses, loss aversion
, risk-seeing behavior)They
are affected by the social
context in which, and the process
by which, decisions are made
They are motivated
by notions of fairness, altruism, trust
, guilt, shame, morality, alienation,
emotions, patriotism, social customs,
social norms, tax morale, …From
James Alm, 2014, Tulane University, USA.Slide10
What does the theory say
about what motivates tax compliance ?Behavioral economics suggests several main conclusions about
what
motivates
tax compliance
:Enforcement matters – but many other factors matter in
the tax compliance decision beyond enforcement.
An individual does not always behave
as
assumed
in
the
standard
economic
appraoch
.
Individuals
are
social
creatures and are influenced by group considerations.From James Alm, 2014, Tulane University, USA.
Dan Arieli Cheating16 minSlide11
Metaanalyses
Andreoni, J., Erard, B., & Feinstein, J. S. (1998). Tax compliance. Journal of Economic Literature, 36(2), 818-860.Kirchler, E., Muehlbacher, S., Kastlunger, B. & Wahl, I. (2010). Why pay taxes? A review of tax compliance decisions. In J.
Alm
, J. Martinez-
Vazques
& B. Torgler (eds.).
Developing Alternative Frameworks for Explaining Tax Compliance
(pp. 15-31). London: Routledge
.
Most people are honest !Slide12
Correlations between tax evasion and measures of psychological instigations and constraints (Elffers et al.,
1987)
Behavioural outcome measures
Psychological variables
2-year self-report
Documented status
Documented amount of tax evaded
Dissatisfaction
Dissatisfaction
with
tax
authorities
Comprehensibility
of
rules
Personality
Competitiveness
Alienation
Tolerance
of
deviance
Fear of
punishment
Social
control
Personal
control
(
attitudes
)
0
+
+
0
+
+-00
-0
0
+
00Slide13
Deterrence
To protect honest taxpayers from free riders, controls are necessary. Negative sanctions
are necessary at an adequate level and in the proper form, depending on the ability of the tax offender to pay.
Tax authorities need to cooperate intensively with legislators, judges, and international authorities
.
The
effect
of
deterrence
measures
is
weak
and
sometimes
oppostite
to
the
intended
effect
…
Enforcing
tax
complianceSlide14
Enforcing
tax
compliance
What
effect
have
fines
?
What
effect
have
repeated
audits
?Slide15
A fine
is a price !
Gneezy
, U. &
Rustichini
, A. (2000). A
fine
is a
price.
Journal of Legal Studies
29(1) 1-18.
Experimental
group
: Managements of 6
day
care
centers
introduce
d a
fine
for
late
pick
up
of
children
;
Control
group
: 4 day
care
centers did
not introduce
a fine.Slide16
Reducing undesirable behavior by special taxes
Australia’s National Tobacco Campaign% of smokers classified as heavy smokers (25+)
Harmonization of fees
in different states
(to end cross-border
Evasion of cigarette taxes)
Shift from
a weight
to
a stick
based
system
Extra
tax on
tobacco
products
Scollo
,
Younie
,
Wakefield
, Freeman, &
Icasiano
, 2003Slide17
Potential side effects of special taxes 1
Australia’s National Tobacco Campaign
% of smokers using Roll Your Own Tobacco
Scollo
,
Younie
,
Wakefield
, Freeman, &
Icasiano, 2003
Shift towards unhealthy form of tobacco consumption Slide18
Potential side effects of special taxes 2
Cigarette sales & consumption in Washington State (USA)
Tax
rise
from
25c
to 75c per pack
Stehr, 2005
Consumption remains stable
Presumably due to smugglingSlide19
Summary for the discussionTwo sets of measures for regulation
Exerting powerTrust building measuresRegulating undesirable behavior by taxes At least in combination with other measures, it seems to workUnwanted side effects:Switching to alternatives that are even worseSmuggling increases“Feeling guilty” may have a stronger impact on behavior than a priceConsumption may become affordable only for privileged citizensMaybe “nudging” would be a better way for regulating (un)wanted behavior (because it leaves freedom of choice)Slide20
Tax
compliance(Kirchler, Maciejovsky & Schwarzenberger, 2005)
20
0 1 2 3
4
Base-
line
Periods
following
audit
.6
.5
.4
.3
.2
.1
0
Compliance
Audit
probability
30
%
Misperceived
probability
&
Loss
repairSlide21
Robust
phenomena
:
the
“bomb
crater
effect
“ and
the
„echo
effect
“
(
Guala
& Mittone, 2005; Mittone 2006; Kastlunger et al. 2009;
Maciejovsky
et al. 2007)
Slide22Slide23
0
100
200
300
400
500
1
7
13
19
25
31
37
43
49
55
4
10
16
22
28
34
40
46
52
58
Tax payments (averages, first group)
Value (Italian Liras)
Tax due
Average tax paid
Audit
Round
“Echo” effect in experiments with audits in the first and second half of 60
business periods, respectively
Guala
and Mittone (2002, p. 12 and 13)Slide24
“Echo” effect in experiments with audits in the first and second half of 60
business periods, respectively
Guala
and Mittone (2002, p. 12 and 13)
0
100
200
300
400
500
1
7
13
19
25
31
37
43
49
55
4
10
16
22
28
34
40
46
52
58
Tax payments (averages, first group)
Value (Italian Liras)
Tax due
Average tax paid
Audit
RoundSlide25
Impact of immediate versus delayed
audits on tax compliance and perceived
fairness
of
authorities
Kogler, C., Mittone, L. & Kirchler, E. (2014)
Timing of
feedback
of
tax
audits
matters
Uncertainty
resolution
in
tax
experiments
:
waiting
for an
audit
increases
tax
compliance
(Muehlbacher et al.,
2012)Problem:
audits
directly after filing
taxes in most
tax experiments
, but in reality often
years after filing
a tax
report (e.g., Austria 5-10 years)Feedback related to trust, trust related to complianceIn other contexts
(e.g., organizational psychology; Sapienza & Korsgaard
, 1996)
timeliness of feedback
was identified to increase
trust
and acceptance of
decisions
In
tax
literature
trust
in
state
/
authorities
was
identified
as an important
determinant
of
tax
compliance
and
tax
morale
(e.g.,
Torgler
& Schneider, 2004; Braithwaite & Wenzel, 2007; Kirchler et al., 2008)Slide26
Experimental Design
22 rounds of taxpaying in a laboratory
experiment
Regular
income
3000 ECU,
tax
rate: 900 ECU
Pay-off
determined
at the end (
one
round
randomly
chosen
)
Audit
probability
: 15%
Rounds
3, 12, 21
for
all
participants
to
keep
effects of
audits
constant
Fine in case of
detection
2 x evaded
amount (paying
back + fine
equal to
evaded amount
) Feedback
After each round vs. only at the end (summary after the last round) Rounds of reduced
earnings Rounds of reduced earnings
: R8-10, R17-18
Reduced
income of 2500 ECU vs. additional tax of 500 ECU (compulsory
)
Questionnaire
:
Items:
perceived
fairness
of
tax
authorities
,
voluntary
compliance
,
subjective
audit
probability
,
perceived
severity
of
fine
,
perceived
fairness
of
timing
of
feedback
,
general
tax
morale
,
socio-demographic
data
, etc.Slide27
Results I – Feedback x
Compulsory Tax
Audit
Reduced
Earnings
Mean
immediate
feedback
= 50.75%,
Mean
delated
feedback
= 69.29%
F (1, 122) = 11.30,
p < .01
Covariate
Gender:
Mean
females
= 69.49%
Mean
males
= 50.60%
F(1, 121) = 7.44, p < .01Slide28
In experiments, uncertainty if tax report is audited is resolved immediately, whereas in real life it can take up to 7 years to know if your audited or not (
Zeigarnik-Effect; unfinished businesses)
5 minutes
3 weeks
Compliance decision
(pay 0-6 € tax)
Control group
Experimental group
Compliance
Rates:
28%
59%
Muehlbacher
,
Mittone
,
Kastlunger
, &
Kirchler
, 2012
Immediate
vs
delayed
auditsSlide29
There
is more
than
audits
and
fines
, …situational and personal characteristics
; social
norms
,
fairness
, …
and
perhaps
the
perception
of
taxpayers
as
cheaters
is short-sighted.Slide30
Diffusion of
income tax evasion
Porcano
(1988), the U.S.
IRS estimated
10-15% of underreported income in 1983. Five years later the tax gap was about 17% of true liability.
Andreoni
and colleagues (1998) estimate that over 25% of all U.S. taxpayers underpaid their taxes in 1988. In developed countries, tax evasion is
estimated
to reach 20% of the level of tax revenues, while in developing countries the percentages are even higher (
Orviska
& Hudson, 2002
).
Slemrod
et al. (2001)
explain that the detected
rate of non-compliance is 7.3%, but varies widely across types of gross income and deductions. In 1988, voluntary reporting was 99.5% for wages and salaries, but only 41.4% for self-employed income.
In
2002, King &
Sheffrin
report that according to the U.S. IRS, 99% of wage income is correctly reported, but less than 70% of income from unincorporated businesses is correctly
reported
.
There is little
doubt that non-compliance should be contained and evasion, in particular, needs to be combated. It is, however, wrong to assume that the majority of people try to evade or avoid paying taxes
.
Long
and
Swingen
(1991) write that some taxpayers are not predisposed to evade and do not search for ways to cheat.
Survey
studies and
experiments on
income tax behaviour show that honesty characterises a majority of participants (e.g., V. Braithwaite, 2003d; James & Alley, 2002; Kirchler, Muehlbacher,
Hoelzl, &
Webley, 2005).
Antonides and
Robben found that 4.2% of participants in their study corrected their tax files to their disadvantage, whereas 23.8% corrected them to their advantage (Antonides &
Robben, 1995). Assuming that those negatively correcting their files made unintentional mistakes, and an equal percentage of those who positively corrected their files did so also undeliberately
, then less than 20% were intending to cheat. On the basis of 1982 U.S. IRS audit data, Alexander and Feinstein (1987) report that approximately one quarter of all taxpayers make accurate tax reports. According to their analysis, 13.5% overstate their taxes, presumably due to errors in completing tax returns. If the same percentage understates their taxes due to errors, then more than half of taxpayers tend to be honest. Hessing, Elffers, and Weigel (1988) estimate that more than two thirds of taxpayers declare their income honestly. The assumption that taxpayers are generally compliant is challenged by the wide use of tax preparers and studies contending that taxpayers generally demand aggressive advice (Duncan, LaRue, &
Reckers, 1989; Jackson, Milliron, & Toy, 1988; Milliron, 1988). These studies were conducted from tax preparers’ view, but investigations from taxpayers’ perspectives reveal a different picture. The use of a tax practitioner does not seem primarily driven by the desire to avoid paying taxes, but by the uncertainty about the tax law and the motivation to report correctly.
10-15% of underreported income
25
% underpaid
7.3% non-compliance, wide variation
across types of
income and deductions
voluntary reporting
99.5
% for wages and salaries, but only 41.4% for self-employed
4.2%
corrected
their tax files to their disadvantage,
23.8
% corrected them to their
advantage.
Assuming that those negatively correcting their files made unintentional mistakes, and an equal percentage of those who positively corrected their files did so also
undeliberately
, then less than 20%
intend to
cheat.
¼ make
accurate
reports
.
13.5
% overstate their taxes, presumably due to
errors.
If the same percentage understates their taxes due to errors, then more than half of taxpayers tend to be honest.
2/3 declare
their income honestly
The
use of a tax practitioner does not seem primarily driven by the desire to avoid paying taxes, but by the uncertainty about the tax law and the motivation to report correctly.
Elffers (2000)
writes, “[…]
the gloomy picture of massive tax evasion is a phantom
”.Slide31
Economic Psychology AgendaSelf-Conception Ideas of Mankind
Objectivity & Intentions Methods(Psycho-) Logics Economic DecisionsRituals of Adults Lay Economic TheoriesThe Invisible Hand MarketsMental Accounting Consumption, Saving, LoansTrick & Treat Marketing Policy
Courage & Risk Businessmen/women
20 US Cents Work & Satisfaction
Invulnerability Financial Markets
Whatever you want! Currency & Inflation
In the Shadow Counter-Productivity
Nudges State: Power and Trust
75.000 US$ Prosperity and Happiness
31Slide32
32
3232
32
32
32
Cognitive scrooges:
Reality is subjectively construed and interpreted
Estimation of the diameter of coins
Optical
illusions
Decision
Anomalies:
Perception of informationSlide33
Paying
back loans
33
You
have
lended 3.000 € and
need to pay
it back with
12%
annual
interest
rate.
Each
month
you
pay
30 €.
How
long
does
it
take to pay the credit back?
less
than 5 years
5 to 10
years11 to
15 years16
to 20 years
for ever
15%
31%
18%
10%26%Slide34
34
34
34
34
34
Emotions Probabilities are ignored
or low probabilities are overestimated
The willingness to pay to avoid electric shocks barely depends on the probability of being exposed to electric shocks (
Rottenstreich
&
Hsee
: Money, Kisses, and Electric Shock: On the Affective Psychology Risk. Psychological Science, 2001)
1 %
99 %
Probability
Shock
Money
0
2
4
6
8
10
12
14
16
18
Prices paid to avoid electric shock and $20 penalty
Risk and emotionsSlide35
35
3535
35
35
Risk-aversion
Daniel Bernoulli (18th century): Human beings are
risk averse!
A sure gain of € 8.000 is
preferred to a possible gain (p = .85) of € 10.000.Slide36
36
3636
36
36
Risk-aversion and -inclination
Sure win of € 240
or
25 % chance of winning € 1.000
and 75 % chance of winning 0
Sure loss of € 750
or
75 % chance of loosing € 1.000 &
25 % chance of loosing 0Slide37
37
3737
37
37
Prospect Theory
Descriptive decision theory explaining a number of decision anomalies in decision making under risk.
Phase 1: Editing
Simplification of the decision problem
Phase 2: Evaluation
Assessment of the alternativesSlide38
38
3838
38
38
Prospect Theory
Phase 1: Editing
Simplification of the decision problem
Coding: What is an event related to (reference point)?
Combination: Independent events are often seen combined.
Segregation: Safe events are often separated from risky ones.
Cancellation: Identical aspects of two alternatives are ignored whereas disparities are weighted heavily in judgments. Slide39
39
3939
39
39
Prospect Theory
Phase 1: Editing
Simplification of the decision problem
Simplification: e.g. odd numbers are rounded. In the case of very low or very high probabilities this process is fundamental.
Detection of dominance: Salient alternatives are discarded in the beginning and are not taken into account any further. Slide40
40
4040
40
40
Phase 2: Evaluation
Assessment of alternatives
Assessment is guided by two principles
The value is estimated in relation to a reference point.
Probabilities are taken into account.
Prospect TheorySlide41
Subjective
value
+
-
A B
-A -B
convex
concave
41
Prospect
-Theorie
Reference
point
Loss
GainSlide42
42
4242
0
0
0.5
1
0.5
1
Probability
p
Decision weight
Prospect Theory: Weighting functionSlide43
43
43Neuropsychology / NeuroeconomicsSupport for the assumptions of the prospect theory comes from neuroeconomics
, examining the brain activity while decisions are made.
Neuroscientific
methods allow the analysis of the activities of the human brain (e.g. Prince &
Pawelzik
, 2008). In addition to imaging and psychophysiological methods, the measurement of individual neurons, the electrical brain stimulation or the elimination of brain regions can be counted among the methodological tools of neuroscience and, more recently, of
neuroeconomics. First and foremost imaging and psychophysiological methods are used. Apart from the electroencephalogram (EEG), positron emission tomography (PET) is used, which allows the creation of cross-sectional images of the brains of humans and mapping biochemical and physiological processes. Currently, functional magnetic resonance imaging (fMRI) is most popular. This method allows the representation of metabolic activity in the brain by measuring the magnetic properties of oxygenated and deoxygenated blood.
Using psychophysiological methods, different physiological responses to a stimulus, such as blood pressure, heart rate, sweating, dilated pupils or muscle tone, can be measured (Sanfey, 2007). Many studies have shown that economic decisions are correlated with neurophysiological processes (e.g., Delgado, Locke, Stenger, &
Fiez, 2003; Knutson, Taylor, Kaufman, Peterson, & Glover, 2005). Sanfey,
Rilling
, Aronson, Nystrom, and Cohen (2003) examined fMRI responses of the players to fair and unfair offers in the ultimatum game and found out that in the case of rejected, unfair offers other brain regions are activated, as in the case of accepted, unfair offers.Slide44
44
5
25
1.
Choose
5
or
25
3.
Result
:
25
gain
&
correct
5
gain
&
incorrect
25
loss
&
incorrect
5
loss
&
correct
2.
Outcome
:
gain
or
loss
4. Brain
activity
:
265
milliseconds after the information about a win or loss
=> higher
amplitude of a potential springing
from the frontal area of the Cerebrum Medium in the event of a loss. ExperimentSlide45
Libertarian Paternalism
Asymmetric (libertarian) paternalism:Does not affect rational decision makers;Works to the advantage of biased decision makers.Policy applicationsProviding information;Framing;Changing status quo;Format effects;Motivational effects.Slide46
46
100
95
90
85
80
75
70
65
Compliance
rate in
percent
<-1.000
<- 500
<- 100
<- 0
>- 0
>- 100
>- 500
>-1.000
refund
balance
due
Size of
refund
or
balance
due (US $)
business income
wages/salaries
Tax compliance of people who are liable to wage tax and of self-employed persons as a function of the refund amount or balance due
(Cox &
Plumley
, 1988; as cited in
Webley
et al., 1991)