
State Results National Center for HIVAIDS Viral Hepatitis STD and TB Prevention Division of Adolescent and School Health What is the School Health Profiles Profiles Profiles is a system of surveys assessing school health policies and practices in states territories and large urban scho ID: 675182
Download Presentation The PPT/PDF document "School Health Profiles 2014" is the property of its rightful owner. Permission is granted to download and print the materials on this web site for personal, non-commercial use only, and to display it on your personal computer provided you do not modify the materials and that you retain all copyright notices contained in the materials. By downloading content from our website, you accept the terms of this agreement.


Slide1
School Health Profiles2014State Results
National Center for HIV/AIDS, Viral Hepatitis, STD, and TB Prevention
Division of Adolescent and School HealthSlide2
What is the School Health Profiles (Profiles)?
Profiles is a system of surveys assessing school health policies and practices in states, territories, and large urban school districtsProfiles surveys are conducted biennially (during even-numbered years) by state, territorial, and local education and health agencies with technical assistance from CDCProfiles questionnaires are administered to middle and high school principals and lead health education teachersSlide3
Topics Monitored by Profiles
School health education requirements and contentPhysical education and physical activityPractices related to bullying and sexual harassmentSchool health policies related to tobacco-use prevention and nutritionSchool-based health servicesFamily engagement and community involvementSchool health coordinationSlide4
1998
2000
2002
2004
2006
2008
2010
2012
2014# of states383843414450504950# of large urban school districts101314131621201921# of territories----------5653# of tribal governments----------222--Total # of sites485157546078787574Total % of sites with weighted data77%75%77%70%82%94%99%92%96%
Profiles Participation, 1998 – 2014Slide5
State and District Participation, Profiles 2014
11/30/2015Slide6
Uses of Profiles Data
Education and health officials use Profiles data toDescribe school health policies and practices and compare them across jurisdictionsIdentify professional development needsPlan and monitor programsSupport health-related policies and legislationSeek fundingGarner support for future surveysSlide7
Examples of Uses of Profiles Data
MontanaUsed Profiles results to develop customized technical assistance plans for selected schools to increase attention towards nutrition physical activity, and employee wellnessFloridaUsed Profiles results to develop the agenda for their Healthy Schools Summer Academy professional development eventAlaskaUse Profiles data to help write a grant to support rural school health servicesSlide8
Profiles Informationhttp://
www.cdc.gov/schoolhealthprofilesOverview of the School Health ProfilesQuestionnaires and item rationalesComprehensive resultsFact sheetPublications and journal articlesParticipation historyFrequently asked questions about requesting data filesData file request formSlide9
HIV, STD, and Pregnancy PreventionSlide10
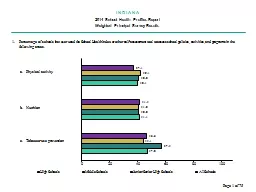
Percentage of secondary schools that taught 11 key HIV, STD, and pregnancy prevention topics in a required course during grades 6, 7, or 8 and during grades 9, 10, 11, or 12
No Data
0% - 24%
25% - 49%
50% - 74%
75% - 100%
School Health Profiles, 2014Slide11
No Data
0% - 24%
25% - 49%
50% - 74%
75% - 100%
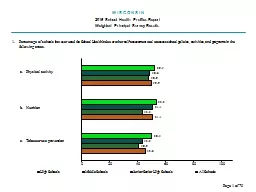
Percentage of secondary schools that assessed the ability of students to do 7 skills in a required course during grades 6, 7, or 8 and during grades 9, 10, 11, or 12
School Health Profiles, 2014Slide12
No Data
0% - 24%
25% - 49%
50% - 74%
75% - 100%
Percentage of secondary schools in which those who teach sexual health education are provided with key materials for teaching sexual health education
School Health Profiles, 2014Slide13
No Data
0% - 24%
25% - 49%
50% - 74%
75% - 100%
Percentage of secondary schools in which the lead health education teacher received professional development during the 2 years before the survey on 10 key HIV prevention topics
School Health Profiles, 2014Slide14
No Data
0% - 24%
25% - 49%
50% - 74%
75% - 100%
Percentage of secondary schools that taught about 7 contraceptives in a required course during grades 9, 10, 11, or 12
School Health Profiles, 2014Slide15
No Data
0% - 24%
25% - 49%
50% - 74%
75% - 100%
Percentage of secondary schools that tried to increase student knowledge on HIV prevention in a required course
School Health Profiles, 2014Slide16
No Data
0% - 24%
25% - 49%
50% - 74%
75% - 100%
Percentage of secondary schools that tried to increase student knowledge on human sexuality in a required course
School Health Profiles, 2014Slide17
No Data
0% - 24%
25% - 49%
50% - 74%
75% - 100%
Percentage of secondary schools that tried to increase student knowledge on pregnancy prevention in a required course
School Health Profiles, 2014Slide18
No Data
0% - 24%
25% - 49%
50% - 74%
75% - 100%
Percentage of secondary schools that tried to increase student knowledge on STD prevention in a required course
School Health Profiles, 2014Slide19
No Data
0% - 24%
25% - 49%
50% - 74%
75% - 100%
Percentage of secondary schools that taught how HIV and other STDs are transmitted in a required course
School Health Profiles, 2014Slide20
No Data
0% - 24%
25% - 49%
50% - 74%
75% - 100%
Percentage of secondary schools that taught health consequences of HIV, other STDs, and pregnancy in a required course
School Health Profiles, 2014Slide21
No Data
0% - 24%
25% - 49%
50% - 74%
75% - 100%
Percentage of secondary schools that taught the benefits of being sexually abstinent in a required course
School Health Profiles, 2014Slide22
No Data
0% - 24%
25% - 49%
50% - 74%
75% - 100%
Percentage of secondary schools that taught how to access valid and reliable health information, products, or services related to HIV, other STDs, and pregnancy in a required course
School Health Profiles, 2014Slide23
No Data
0% - 24%
25% - 49%
50% - 74%
75% - 100%
Percentage of secondary schools that taught the influences of family, peers, media, technology, and other factors on sexual risk behaviors in a required course
School Health Profiles, 2014Slide24
No Data
0% - 24%
25% - 49%
50% - 74%
75% - 100%
Percentage of secondary schools that taught communication and negotiation skills related to eliminating or reducing risk for HIV, other STDs, and pregnancy in a required course
School Health Profiles, 2014Slide25
No Data
0% - 24%
25% - 49%
50% - 74%
75% - 100%
Percentage of secondary schools that taught goal-setting and decision-making skills related to eliminating or reducing risk for HIV, other STDs, and pregnancy in a required course
School Health Profiles, 2014Slide26
No Data
0% - 24%
25% - 49%
50% - 74%
75% - 100%
Percentage of secondary schools that taught influencing and supporting others to avoid or reduce sexual risk behaviors in a required course
School Health Profiles, 2014Slide27
No Data
0% - 24%
25% - 49%
50% - 74%
75% - 100%
Percentage of secondary schools that taught efficacy of condoms in a required course
School Health Profiles, 2014Slide28
No Data
0% - 24%
25% - 49%
50% - 74%
75% - 100%
Percentage of secondary schools that taught the importance of using condoms consistently and correctly in a required course
School Health Profiles, 2014Slide29
No Data
0% - 24%
25% - 49%
50% - 74%
75% - 100%
Percentage of secondary schools that taught how to obtain condoms in a required course
School Health Profiles, 2014Slide30
No Data
0% - 24%
25% - 49%
50% - 74%
75% - 100%
Percentage of secondary schools that taught how to correctly use a condom in a required course
School Health Profiles, 2014Slide31
No Data
0% - 24%
25% - 49%
50% - 74%
75% - 100%
Percentage of secondary schools that taught the importance of using a condom at the same time as another form of contraception to prevent both STDs and pregnancy in a required course
School Health Profiles, 2014Slide32
No Data
0% - 24%
25% - 49%
50% - 74%
75% - 100%
Percentage of secondary schools that taught how to create and sustain healthy and respectful relationships in a required course
School Health Profiles, 2014Slide33
No Data
0% - 24%
25% - 49%
50% - 74%
75% - 100%
Percentage of secondary schools that taught the importance of limiting the number of sexual partners in a required course
School Health Profiles, 2014Slide34
No Data
0% - 24%
25% - 49%
50% - 74%
75% - 100%
Percentage of secondary schools that taught preventive care that is necessary to maintain reproductive and sexual health in a required course
School Health Profiles, 2014Slide35
No Data
0% - 24%
25% - 49%
50% - 74%
75% - 100%
Percentage of secondary schools with a policy on students or staff who have HIV infection or AIDS that addresses attendance of students with HIV infection, procedures to protect HIV-infected students and staff from discrimination, and maintaining confidentiality of HIV-infected students and staff
School Health Profiles, 2014Slide36
No Data
0% - 24%
25% - 49%
50% - 74%
75% - 100%
Percentage of secondary schools in which the lead health education teacher received professional development during the 2 years before the survey on HIV prevention
School Health Profiles, 2014Slide37
No Data
0% - 24%
25% - 49%
50% - 74%
75% - 100%
Percentage of secondary schools in which the lead health education teacher received professional development during the 2 years before the survey on human sexuality
School Health Profiles, 2014Slide38
No Data
0% - 24%
25% - 49%
50% - 74%
75% - 100%
Percentage of secondary schools in which the lead health education teacher received professional development during the 2 years before the survey on pregnancy prevention
School Health Profiles, 2014Slide39
No Data
0% - 24%
25% - 49%
50% - 74%
75% - 100%
Percentage of secondary schools in which the lead health education teacher received professional development during the 2 years before the survey on STD prevention
School Health Profiles, 2014Slide40
Practices Related to Safe and Supportive EnvironmentsSlide41
No Data
0% - 24%
25% - 49%
50% - 74%
75% - 100%
Percentage of secondary schools that provide curricula or supplementary materials that include HIV, STD, or pregnancy prevention information that is relevant to LGBTQ youth
School Health Profiles, 2014Slide42
No Data
0% - 24%
25% - 49%
50% - 74%
75% - 100%
Percentage of secondary schools in which the lead health education teacher received professional development during the 2 years before the survey on teaching students of different sexual orientations or gender identities
School Health Profiles, 2014Slide43
No Data
0% - 24%
25% - 49%
50% - 74%
75% - 100%
Percentage of secondary schools with a gay/straight alliance or similar club
School Health Profiles, 2014Slide44
No Data
0% - 24%
25% - 49%
50% - 74%
75% - 100%
Percentage of secondary schools that implement parent engagement strategies for all students
School Health Profiles, 2014Slide45
No Data
0% - 24%
25% - 49%
50% - 74%
75% - 100%
Percentage of secondary schools that implement school connectedness strategies
School Health Profiles, 2014Slide46
No Data
0% - 24%
25% - 49%
50% - 74%
75% - 100%
Percentage of secondary schools that prevent bullying and sexual harassment, including electronic aggression, among all students
School Health Profiles, 2014Slide47
No Data
0% - 24%
25% - 49%
50% - 74%
75% - 100%
Percentage of secondary schools that provide curricula or supplementary materials and engage in 5 practices related to LGBTQ youth
School Health Profiles, 2014Slide48
No Data
0% - 24%
25% - 49%
50% - 74%
75% - 100%
Percentage of secondary schools that identify “safe spaces” where LGBTQ youth can receive support from administrators, teachers, or other school staff
School Health Profiles, 2014Slide49
No Data
0% - 24%
25% - 49%
50% - 74%
75% - 100%
Percentage of secondary schools that prohibit harassment based on a student’s perceived or actual sexual orientation or gender identity
School Health Profiles, 2014Slide50
No Data
0% - 24%
25% - 49%
50% - 74%
75% - 100%
Percentage of secondary schools that encourage staff to attend professional development on safe and supportive school environments for all students, regardless of sexual orientation or gender identity
School Health Profiles, 2014Slide51
No Data
0% - 24%
25% - 49%
50% - 74%
75% - 100%
Percentage of secondary schools that facilitate access to providers not on school property who have experience in providing health services to LGBTQ youth
School Health Profiles, 2014Slide52
No Data
0% - 24%
25% - 49%
50% - 74%
75% - 100%
Percentage of secondary schools that facilitate access to providers not on school property who have experience in providing social and psychological services to LGBTQ youth
School Health Profiles, 2014Slide53
School Health ServicesSlide54
No Data
0% - 24%
25% - 49%
50% - 74%
75% - 100%
Percentage of secondary schools that provide students with on-site services or referrals to healthcare providers for 7 sexual health services
School Health Profiles, 2014Slide55
No Data
0% - 24%
25% - 49%
50% - 74%
75% - 100%
Percentage of secondary schools that provide HIV testing to students
School Health Profiles, 2014Slide56
No Data
0% - 24%
25% - 49%
50% - 74%
75% - 100%
Percentage of secondary schools that provide HIV treatment to students
School Health Profiles, 2014Slide57
No Data
0% - 24%
25% - 49%
50% - 74%
75% - 100%
Percentage of secondary schools that provide STD testing to students
School Health Profiles, 2014Slide58
No Data
0% - 24%
25% - 49%
50% - 74%
75% - 100%
Percentage of secondary schools that provide STD treatment to students
School Health Profiles, 2014Slide59
No Data
0% - 24%
25% - 49%
50% - 74%
75% - 100%
Percentage of secondary schools that provide pregnancy testing to students
School Health Profiles, 2014Slide60
No Data
0% - 24%
25% - 49%
50% - 74%
75% - 100%
Percentage of secondary schools that provide condoms to students
School Health Profiles, 2014Slide61
No Data
0% - 24%
25% - 49%
50% - 74%
75% - 100%
Percentage of secondary schools that provide condom-compatible lubricants to students
School Health Profiles, 2014Slide62
No Data
0% - 24%
25% - 49%
50% - 74%
75% - 100%
Percentage of secondary schools that provide contraceptives other than condoms to students
School Health Profiles, 2014Slide63
No Data
0% - 24%
25% - 49%
50% - 74%
75% - 100%
Percentage of secondary schools that provide prenatal care to students
School Health Profiles, 2014Slide64
No Data
0% - 24%
25% - 49%
50% - 74%
75% - 100%
Percentage of secondary schools that provide HPV vaccine administration to students
School Health Profiles, 2014Slide65
No Data
0% - 24%
25% - 49%
50% - 74%
75% - 100%
Percentage of secondary schools that provide students with referrals* for HIV testing
*To any organizations or health care professionals not on school property.
School Health Profiles, 2014Slide66
No Data
0% - 24%
25% - 49%
50% - 74%
75% - 100%
Percentage of secondary schools that provide students with referrals* for HIV treatment
*To any organizations or health care professionals not on school property.
School Health Profiles, 2014Slide67
No Data
0% - 24%
25% - 49%
50% - 74%
75% - 100%
Percentage of secondary schools that provide students with referrals* for STD testing
*To any organizations or health care professionals not on school property.
School Health Profiles, 2014Slide68
No Data
0% - 24%
25% - 49%
50% - 74%
75% - 100%
Percentage of secondary schools that provide students with referrals* for STD treatment
*To any organizations or health care professionals not on school property.
School Health Profiles, 2014Slide69
No Data
0% - 24%
25% - 49%
50% - 74%
75% - 100%
Percentage of secondary schools that provide students with referrals* for pregnancy testing
*To any organizations or health care professionals not on school property.
School Health Profiles, 2014Slide70
No Data
0% - 24%
25% - 49%
50% - 74%
75% - 100%
Percentage of secondary schools that provide students with referrals* for condoms
*To any organizations or health care professionals not on school property.
School Health Profiles, 2014Slide71
No Data
0% - 24%
25% - 49%
50% - 74%
75% - 100%
Percentage of secondary schools that provide students with referrals* for condom-compatible lubricants
*To any organizations or health care professionals not on school property.
School Health Profiles, 2014Slide72
No Data
0% - 24%
25% - 49%
50% - 74%
75% - 100%
Percentage of secondary schools that provide students with referrals* for contraceptives other than condoms
*To any organizations or health care professionals not on school property.
School Health Profiles, 2014Slide73
No Data
0% - 24%
25% - 49%
50% - 74%
75% - 100%
Percentage of secondary schools that provide students with referrals* for prenatal care
*To any organizations or health care professionals not on school property.
School Health Profiles, 2014Slide74
No Data
0% - 24%
25% - 49%
50% - 74%
75% - 100%
Percentage of secondary schools that provide students with referrals* for HPV vaccine administration
*To any organizations or health care professionals not on school property.
School Health Profiles, 2014Slide75
No Data
0% - 24%
25% - 49%
50% - 74%
75% - 100%
Percentage of secondary schools that identify and track students with chronic conditions* that may require daily or emergency management
*For example, asthma or food allergies.
School Health Profiles, 2014Slide76
No Data
0% - 24%
25% - 49%
50% - 74%
75% - 100%
Percentage of secondary schools that have protocols that ensure students with a chronic condition that may require daily or emergency management are enrolled into private, state, or federally funded insurance programs if eligible
School Health Profiles, 2014Slide77
No Data
0% - 24%
25% - 49%
50% - 74%
75% - 100%
Percentage of secondary schools that provide referrals to community-based medical care providers for students identified with chronic conditions or at risk for activity, diet, and weight-related chronic conditions
School Health Profiles, 2014Slide78
School Health CoordinationSlide79
No Data
0% - 24%
25% - 49%
50% - 74%
75% - 100%
Percentage of secondary schools that had a school health council, committee, or team that offers guidance on the development of policies or coordinates activities on health topics
School Health Profiles, 2014Slide80
No Data
0% - 24%
25% - 49%
50% - 74%
75% - 100%
Percentage of secondary schools that have a school health council, committee, or team with representation from at least 6 of 8 groups
School Health Profiles, 2014Slide81
No Data
0% - 24%
25% - 49%
50% - 74%
75% - 100%
Percentage of secondary schools that used the School Health Index or other self-assessment tool to assess their policies, activities, and programs in HIV, STD, and teen pregnancy prevention; physical activity; nutrition; and tobacco-use prevention
School Health Profiles, 2014Slide82
No Data
0% - 24%
25% - 49%
50% - 74%
75% - 100%
Percentage of secondary schools that include at least 1 health and safety objective in their school improvement plan and have completed a self-assessment of school health policies and practices and have reviewed health and safety data during the past year as part of their school improvement planning process
School Health Profiles, 2014Slide83
No Data
0% - 24%
25% - 49%
50% - 74%
75% - 100%
Percentage of secondary schools that have a school health team that performs 5 actions to help plan and implement school health programs
School Health Profiles, 2014Slide84
Health EducationSlide85
No Data
0% - 24%
25% - 49%
50% - 74%
75% - 100%
Percentage of secondary schools with a health education curriculum that addresses all 8 national standards for health education
School Health Profiles, 2014Slide86
No Data
0% - 24%
25% - 49%
50% - 74%
75% - 100%
Percentage of secondary schools that required students to take 2 or more health education courses
School Health Profiles, 2014Slide87
No Data
0% - 24%
25% - 49%
50% - 74%
75% - 100%
Among secondary schools that required a health education course, percentage that required students who fail the course to repeat it
School Health Profiles, 2014Slide88
No Data
0% - 24%
25% - 49%
50% - 74%
75% - 100%
Percentage of secondary schools in which the lead health education teacher had professional preparation in health education or in health and physical education combined
School Health Profiles, 2014Slide89
Tobacco-Use PreventionSlide90
No Data
0% - 24%
25% - 49%
50% - 74%
75% - 100%
Percentage of secondary schools that prohibited all tobacco use at all times in all locations*
*Prohibited the use of all tobacco, including cigarettes, smokeless tobacco, cigars, and pipes, by students, faculty and school staff, and visitors, in school buildings, outside on school grounds, on school buses or other vehicles used to transport students, and at off-campus, school-sponsored events, during school hours and non-school hours.
School Health Profiles, 2014Slide91
No Data
0% - 24%
25% - 49%
50% - 74%
75% - 100%
Percentage of secondary schools that taught 18 key tobacco-use prevention topics in a required course
School Health Profiles, 2014Slide92
No Data
0% - 24%
25% - 49%
50% - 74%
75% - 100%
Percentage of secondary schools that provided tobacco cessation services for students, faculty, and staff at school or through arrangements with providers not on school property
School Health Profiles, 2014Slide93
No Data
0% - 24%
25% - 49%
50% - 74%
75% - 100%
Percentage of secondary schools in which the lead health education teacher received professional development during the 2 years before the survey on tobacco-use prevention
School Health Profiles, 2014Slide94
No Data
0% - 24%
25% - 49%
50% - 74%
75% - 100%
Percentage of secondary schools that posted signs marking a tobacco-free school zone
School Health Profiles, 2014Slide95
NutritionSlide96
No Data
0% - 24%
25% - 49%
50% - 74%
75% - 100%
Percentage of secondary schools that did not sell less healthy foods and beverages* in vending machines or at the school store, canteen, or snack bar
*Baked goods not low in fat, salty snacks not low in fat, chocolate candy, other kinds of candy, soda pop or fruit drinks that are not 100% juice, and sports drinks.
School Health Profiles, 2014Slide97
No Data
0% - 24%
25% - 49%
50% - 74%
75% - 100%
Percentage of secondary schools in which students could not purchase chocolate candy from vending machines or at the school store, canteen, or snack bar
School Health Profiles, 2014Slide98
No Data
0% - 24%
25% - 49%
50% - 74%
75% - 100%
Percentage of secondary schools in which students could not purchase other kinds of candy from vending machines or at the school store, canteen, or snack bar
School Health Profiles, 2014Slide99
No Data
0% - 24%
25% - 49%
50% - 74%
75% - 100%
Percentage of secondary schools in which students could not purchase salty snacks that are not low in fat* from vending machines or at the school store, canteen, or snack bar
*Such as regular potato chips.
School Health Profiles, 2014Slide100
No Data
0% - 24%
25% - 49%
50% - 74%
75% - 100%
Percentage of secondary schools in which students could not purchase cookies, crackers, cakes, pastries, or other baked goods that are not low in fat from vending machines or at the school store, canteen, or snack bar
School Health Profiles, 2014Slide101
No Data
0% - 24%
25% - 49%
50% - 74%
75% - 100%
Percentage of secondary schools in which students could not purchase 2% or whole milk from vending machines or at the school store, canteen, or snack bar
School Health Profiles, 2014Slide102
No Data
0% - 24%
25% - 49%
50% - 74%
75% - 100%
Percentage of secondary schools in which students could not purchase soda pop or fruit drinks that are not 100% juice from vending machines or at the school store, canteen, or snack bar
School Health Profiles, 2014Slide103
No Data
0% - 24%
25% - 49%
50% - 74%
75% - 100%
Percentage of secondary schools in which students could not purchase sports drinks* from vending machines or at the school store, canteen, or snack bar
*Such as Gatorade.
School Health Profiles, 2014Slide104
No Data
0% - 24%
25% - 49%
50% - 74%
75% - 100%
Percentage of secondary schools in which students could not purchase energy drinks* from vending machines or at the school store, canteen, or snack bar
*Such as Red Bull or Monster.
School Health Profiles, 2014Slide105
No Data
0% - 24%
25% - 49%
50% - 74%
75% - 100%
Percentage of secondary schools in which students could not purchase foods or beverages containing caffeine from vending machines or at the school store, canteen, or snack bar
School Health Profiles, 2014Slide106
No Data
0% - 24%
25% - 49%
50% - 74%
75% - 100%
Percentage of secondary schools that allowed students to purchase fruits and vegetables from vending machines or at the school store, canteen, or snack bar
School Health Profiles, 2014Slide107
No Data
0% - 24%
25% - 49%
50% - 74%
75% - 100%
Percentage of secondary schools that prohibited all forms of advertising and promotion of candy, fast food restaurants, or soft drinks in all locations*
*In school buildings; on school grounds, including on the outside of the school building, on playing fields, or other areas of the campus; on school buses or other vehicles used to transport students; and in school publications.
School Health Profiles, 2014Slide108
No Data
0% - 24%
25% - 49%
50% - 74%
75% - 100%
Percentage of secondary schools that priced nutritious foods and beverages at a lower cost while increasing the price of less nutritious foods and beverages
School Health Profiles, 2014Slide109
No Data
0% - 24%
25% - 49%
50% - 74%
75% - 100%
Percentage of secondary schools that provided information to students or families on the nutrition and caloric content of foods available
School Health Profiles, 2014Slide110
No Data
0% - 24%
25% - 49%
50% - 74%
75% - 100%
Percentage of secondary schools that placed fruits and vegetables near the cafeteria cashier, where they are easy to access
School Health Profiles, 2014Slide111
No Data
0% - 24%
25% - 49%
50% - 74%
75% - 100%
Percentage of secondary schools that allowed students to have access to drinking water
School Health Profiles, 2014Slide112
No Data
0% - 24%
25% - 49%
50% - 74%
75% - 100%
Percentage of secondary schools that offer fruits or non-fried vegetables when foods or beverages are offered at school celebrations
School Health Profiles, 2014Slide113
No Data
0% - 24%
25% - 49%
50% - 74%
75% - 100%
Percentage of secondary schools that prohibited school staff from giving students food or food coupons as a reward for good behavior or good academic performance
School Health Profiles, 2014Slide114
No Data
0% - 24%
25% - 49%
50% - 74%
75% - 100%
Percentage of secondary schools that prohibited less nutritious foods and beverages from being sold for fundraising purposes
School Health Profiles, 2014Slide115
No Data
0% - 24%
25% - 49%
50% - 74%
75% - 100%
Percentage of secondary schools in which the lead health education teacher received professional development during the 2 years before the survey on nutrition and dietary behavior
School Health Profiles, 2014Slide116
No Data
0% - 24%
25% - 49%
50% - 74%
75% - 100%
Percentage of secondary schools that taught 20 key nutrition and dietary behavior topics in a required course
School Health Profiles, 2014Slide117
Physical Education And Physical ActivitySlide118
No Data
0% - 24%
25% - 49%
50% - 74%
75% - 100%
Percentage of secondary schools that have established, implemented, or evaluated a Comprehensive School Physical Activity Program
School Health Profiles, 2014Slide119
No Data
0% - 24%
25% - 49%
50% - 74%
75% - 100%
Percentage of secondary schools in which a required physical education course is taught in 6th grade*
*Among schools with students in that grade.
School Health Profiles, 2014Slide120
No Data
0% - 24%
25% - 49%
50% - 74%
75% - 100%
Percentage of secondary schools in which a required physical education course is taught in 7th grade*
*Among schools with students in that grade.
School Health Profiles, 2014Slide121
No Data
0% - 24%
25% - 49%
50% - 74%
75% - 100%
Percentage of secondary schools in which a required physical education course is taught in 8th grade*
*Among schools with students in that grade.
School Health Profiles, 2014Slide122
No Data
0% - 24%
25% - 49%
50% - 74%
75% - 100%
Percentage of secondary schools in which a required physical education course is taught in 9th grade*
*Among schools with students in that grade.
School Health Profiles, 2014Slide123
No Data
0% - 24%
25% - 49%
50% - 74%
75% - 100%
Percentage of secondary schools in which a required physical education course is taught in 10th grade*
*Among schools with students in that grade.
School Health Profiles, 2014Slide124
No Data
0% - 24%
25% - 49%
50% - 74%
75% - 100%
Percentage of secondary schools in which a required physical education course is taught in 11th grade*
*Among schools with students in that grade.
School Health Profiles, 2014Slide125
No Data
0% - 24%
25% - 49%
50% - 74%
75% - 100%
Percentage of secondary schools in which a required physical education course is taught in 12th grade*
*Among schools with students in that grade.
School Health Profiles, 2014Slide126
No Data
0% - 24%
25% - 49%
50% - 74%
75% - 100%
Percentage of secondary schools in which at least 1 physical education teacher or specialist received professional development on physical education*
*During the year before the survey.
School Health Profiles, 2014Slide127
No Data
0% - 24%
25% - 49%
50% - 74%
75% - 100%
Percentage of secondary schools in which students participate in physical activity breaks in classrooms during the school day*
*Outside of physical education.
School Health Profiles, 2014Slide128
No Data
0% - 24%
25% - 49%
50% - 74%
75% - 100%
Percentage of secondary schools that offered opportunities for all students to participate in intramural sports programs or physical activity clubs
School Health Profiles, 2014Slide129
No Data
0% - 24%
25% - 49%
50% - 74%
75% - 100%
Percentage of secondary schools that offer interscholastic sports to students
School Health Profiles, 2014Slide130
No Data
0% - 24%
25% - 49%
50% - 74%
75% - 100%
Percentage of secondary schools that offer opportunities for students to participate in physical activity before the school day*
*Through organized physical activities or access to facilities or equipment for physical activity.
School Health Profiles, 2014Slide131
No Data
0% - 24%
25% - 49%
50% - 74%
75% - 100%
Percentage of secondary schools that taught 13 key physical activity topics in a required course
School Health Profiles, 2014Slide132
No Data
0% - 24%
25% - 49%
50% - 74%
75% - 100%
Percentage of secondary schools that have a joint use agreement for shared use of physical activity facilities
School Health Profiles, 2014