
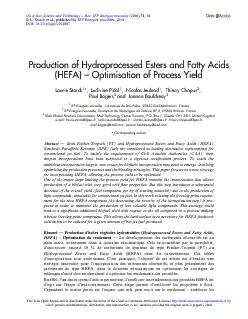
Product distributionJet rangeDiesel rangeNaphtha and lightends Figure4ImpactofcoldowpropertiesonkeroseneyieldofHEFAsourceIFPEnergiesnouvelles TABLE3CharacteristicsoftheJetA1fuelsusedinthisworkA ID: 855804
Download The PPT/PDF document "Figure4belowshowsthetypicalevolutionofyi..." is the property of its rightful owner. Permission is granted to download and print the materials on this web site for personal, non-commercial use only, and to display it on your personal computer provided you do not modify the materials and that you retain all copyright notices contained in the materials. By downloading content from our website, you accept the terms of this agreement.
