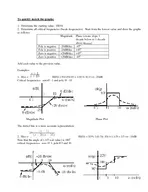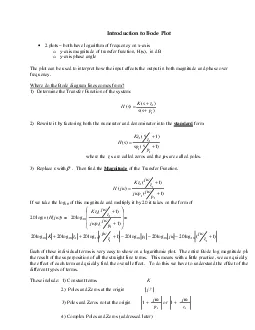
1 Determine the Transfer Function of the system 1szs 2 Rewrite it by factoring both the numerator and denominator into the standardform 111s where the ID: 870350
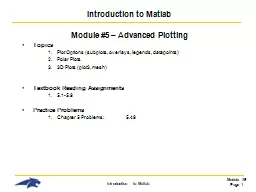
Download The PPT/PDF document "Introduction to Bode Plot 2 plots 150 ..." is the property of its rightful owner. Permission is granted to download and print the materials on this web site for personal, non-commercial use only, and to display it on your personal computer provided you do not modify the materials and that you retain all copyright notices contained in the materials. By downloading content from our website, you accept the terms of this agreement.