
End of Project Evaluation for Isoko y’Ubuzima:
OM
Published · 26 slides · 0 views

1 / 1
Description
End of Project Evaluation for Isoko yUbuzima: Final Report Prepared and presented by Athena Infonomics and Greenwise Consult Ltd 21st July 2026 Contents 1 Introduction to the Project 2 Evaluation Objectives 3 Evaluation Methodology 4 Key
Related Topics
Share
Embed code
Download this presentation From Below
"End of Project Evaluation for Isoko y’Ubuzima:" is the property of its rightful owner. Permission is granted to download and print the materials on this website for personal, non-commercial use only, and to display it on your personal computer provided you do not modify the materials and that you retain all copyright notices contained in the materials. By downloading content from our website, you accept the terms of this agreement.
Presentation Transcript
01
End of Project Evaluation for Isoko y’Ubuzima: Final Report Prepared and presented by Athena Infonomics and Greenwise Consult Ltd
21st July 2026<br>
21st July 2026<br>
02
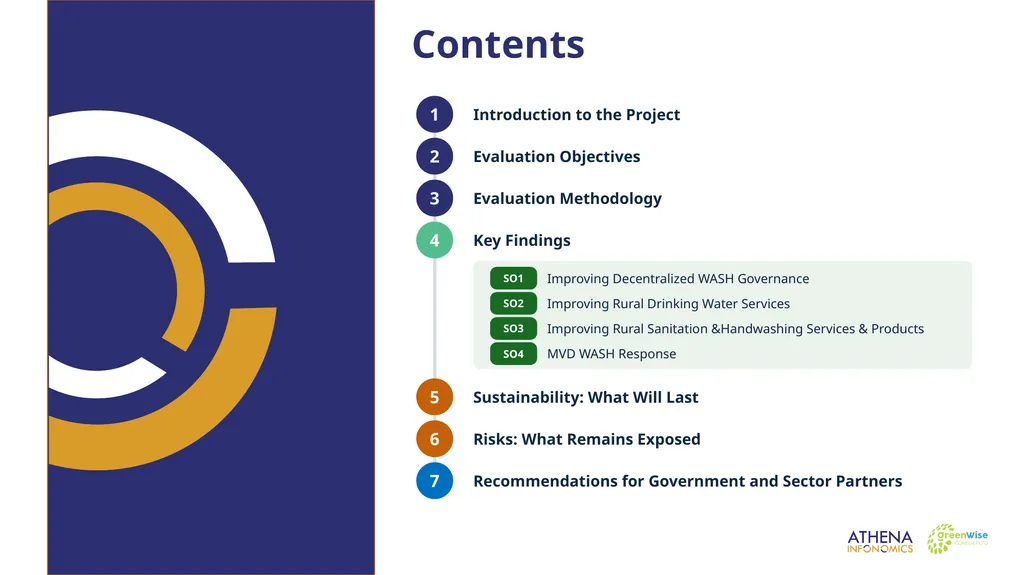
Contents 1 Introduction to the Project 2 Evaluation Objectives 3 Evaluation Methodology 4 Key Findings 5 Sustainability: What Will Last 6 Risks: What Remains Exposed 7 Recommendations for Government and Sector Partners SO1 Improving Decentralized WASH Governance SO2 Improving Rural Drinking Water Services SO3 Improving Rural Sanitation &Handwashing Services & Products SO4 MVD WASH Response<br>
03
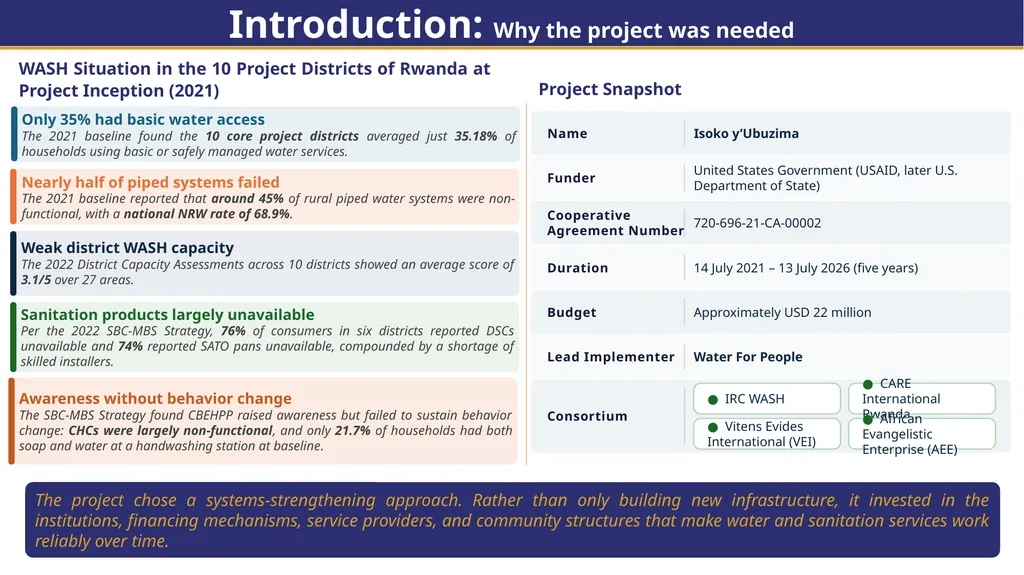
The project chose a systems-strengthening approach. Rather than only building new infrastructure, it invested in the institutions, financing mechanisms, service providers, and community structures that make water and sanitation services work reliably over time. Introduction: Why the project was needed WASH Situation in the 10 Project Districts of Rwanda at Project Inception (2021) Project Snapshot<br>
04
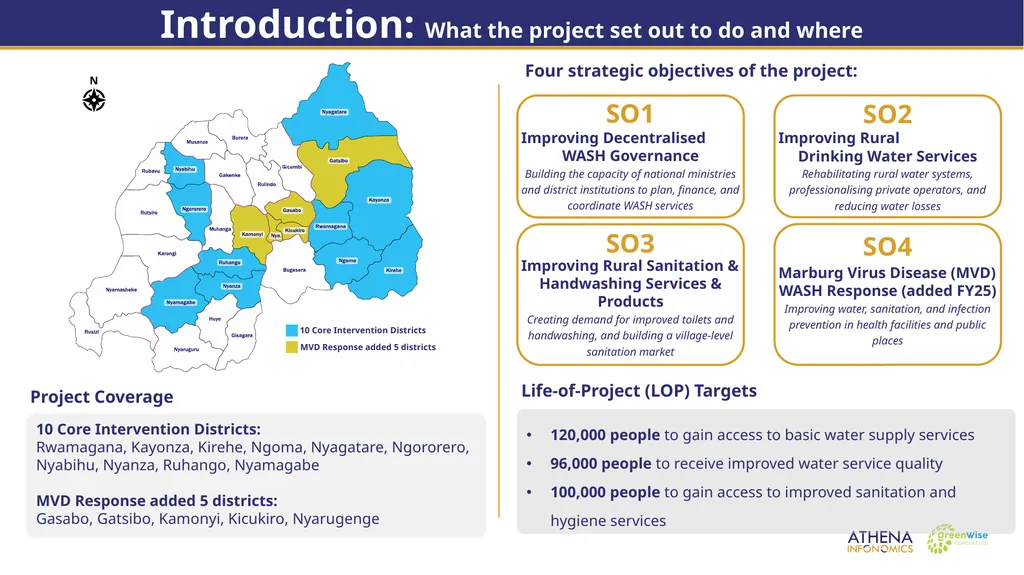
Project Coverage 10 Core Intervention Districts:
Rwamagana, Kayonza, Kirehe, Ngoma, Nyagatare, Ngororero, Nyabihu, Nyanza, Ruhango, Nyamagabe
MVD Response added 5 districts:
Gasabo, Gatsibo, Kamonyi, Kicukiro, Nyarugenge Life-of-Project (LOP) Targets Introduction: What the project set out to do and where Four strategic objectives of the project: 120,000 people to gain access to basic water supply services
96,000 people to receive improved water service quality
100,000 people to gain access to improved sanitation and hygiene services<br>
05
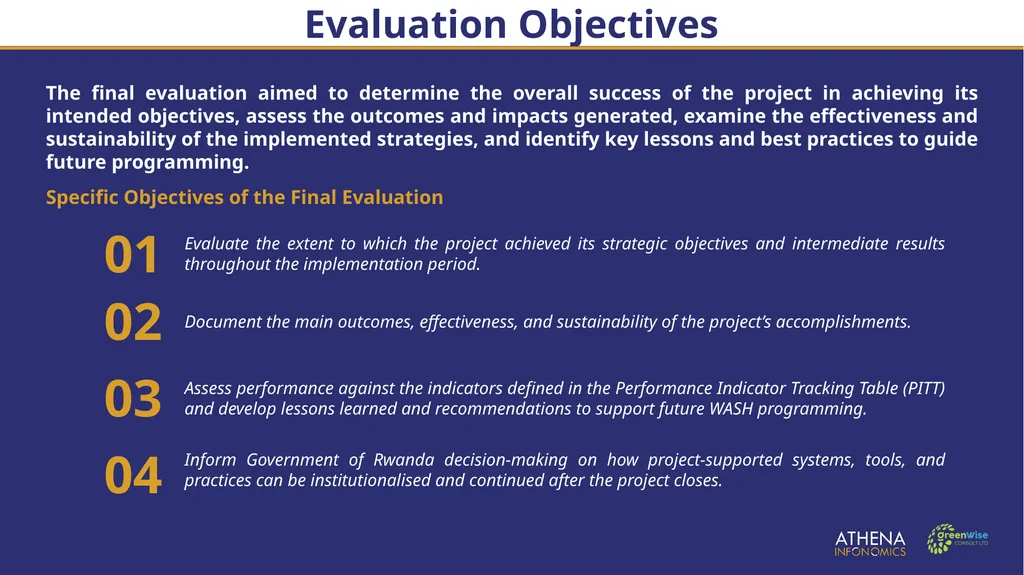
Evaluation Objectives The final evaluation aimed to determine the overall success of the project in achieving its intended objectives, assess the outcomes and impacts generated, examine the effectiveness and sustainability of the implemented strategies, and identify key lessons and best practices to guide future programming. 04 Specific Objectives of the Final Evaluation Inform Government of Rwanda decision-making on how project-supported systems, tools, and practices can be institutionalised and continued after the project closes.<br>
06
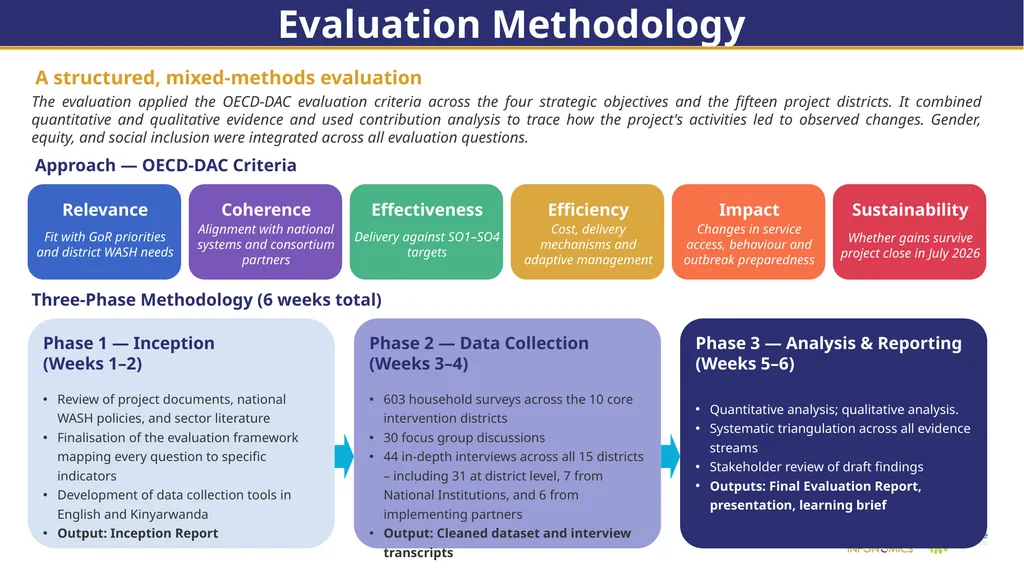
Evaluation Methodology Approach — OECD-DAC Criteria The evaluation applied the OECD-DAC evaluation criteria across the four strategic objectives and the fifteen project districts. It combined quantitative and qualitative evidence and used contribution analysis to trace how the project's activities led to observed changes. Gender, equity, and social inclusion were integrated across all evaluation questions. Three-Phase Methodology (6 weeks total) Phase 1 — Inception
(Weeks 1–2) Review of project documents, national WASH policies, and sector literature
Finalisation of the evaluation framework mapping every question to specific indicators
Development of data collection tools in English and Kinyarwanda
Output: Inception Report Phase 2 — Data Collection
(Weeks 3–4) 603 household surveys across the 10 core intervention districts
30 focus group discussions
44 in-depth interviews across all 15 districts – including 31 at district level, 7 from National Institutions, and 6 from implementing partners
Output: Cleaned dataset and interview transcripts Phase 3 — Analysis & Reporting
(Weeks 5–6) Quantitative analysis; qualitative analysis.
Systematic triangulation across all evidence streams
Stakeholder review of draft findings
Outputs: Final Evaluation Report, presentation, learning brief A structured, mixed-methods evaluation<br>
07
Key Findings<br>
08
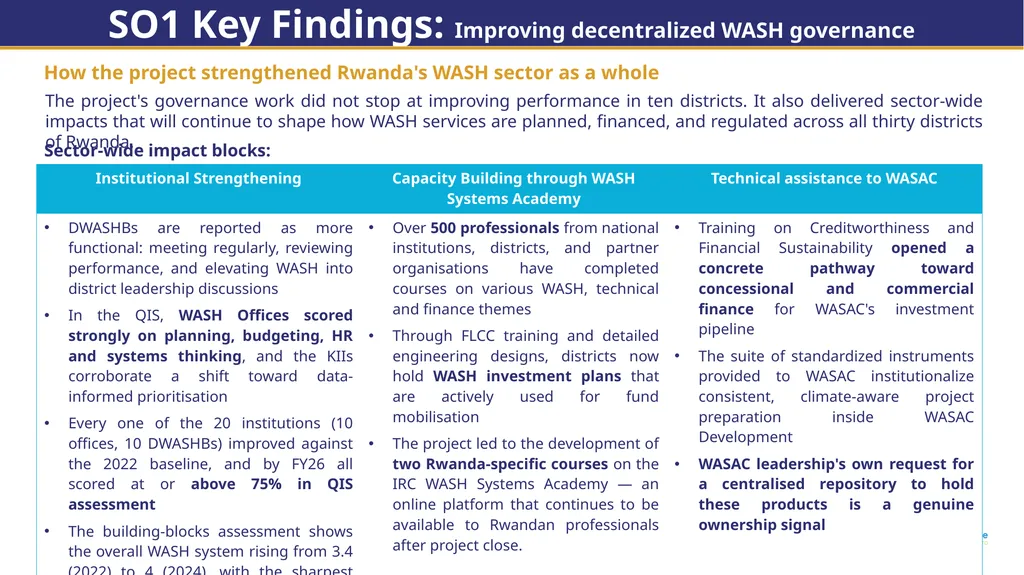
SO1 Key Findings: Improving decentralized WASH governance How the project strengthened Rwanda's WASH sector as a whole The project's governance work did not stop at improving performance in ten districts. It also delivered sector-wide impacts that will continue to shape how WASH services are planned, financed, and regulated across all thirty districts of Rwanda. Sector-wide impact blocks:<br>
09
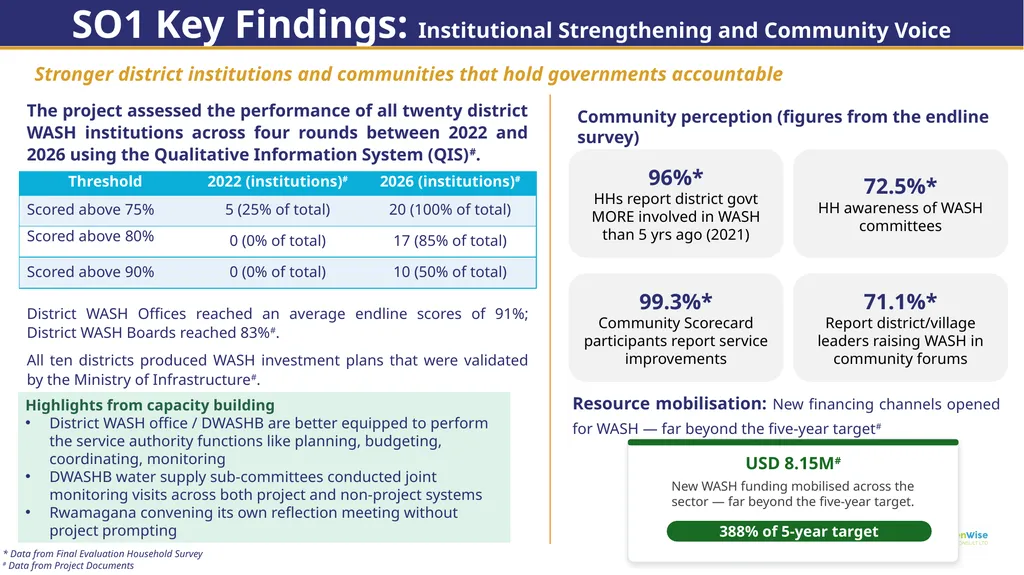
SO1 Key Findings: Institutional Strengthening and Community Voice Stronger district institutions and communities that hold governments accountable Community perception (figures from the endline survey) Resource mobilisation: New financing channels opened for WASH — far beyond the five-year target# District WASH Offices reached an average endline scores of 91%; District WASH Boards reached 83%#.
All ten districts produced WASH investment plans that were validated by the Ministry of Infrastructure#. The project assessed the performance of all twenty district WASH institutions across four rounds between 2022 and 2026 using the Qualitative Information System (QIS)#. * Data from Final Evaluation Household Survey
# Data from Project Documents Highlights from capacity building
District WASH office / DWASHB are better equipped to perform the service authority functions like planning, budgeting, coordinating, monitoring
DWASHB water supply sub-committees conducted joint monitoring visits across both project and non-project systems
Rwamagana convening its own reflection meeting without project prompting<br>
10
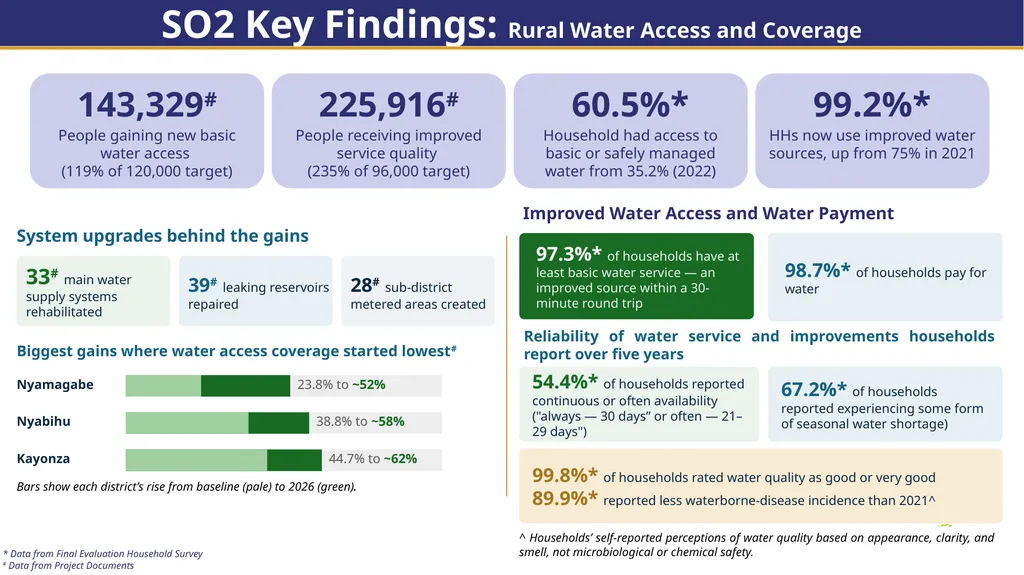
SO2 Key Findings: Rural Water Access and Coverage Improved Water Access and Water Payment 97.3%* of households have at least basic water service — an improved source within a 30-minute round trip 98.7%* of households pay for water Reliability of water service and improvements households report over five years 54.4%* of households reported continuous or often availability ("always — 30 days” or often — 21–29 days") 67.2%* of households reported experiencing some form of seasonal water shortage) * Data from Final Evaluation Household Survey
# Data from Project Documents 99.8%* of households rated water quality as good or very good
89.9%* reported less waterborne-disease incidence than 2021^ ^ Households’ self-reported perceptions of water quality based on appearance, clarity, and smell, not microbiological or chemical safety.<br>
# Data from Project Documents 99.8%* of households rated water quality as good or very good
89.9%* reported less waterborne-disease incidence than 2021^ ^ Households’ self-reported perceptions of water quality based on appearance, clarity, and smell, not microbiological or chemical safety.<br>
11
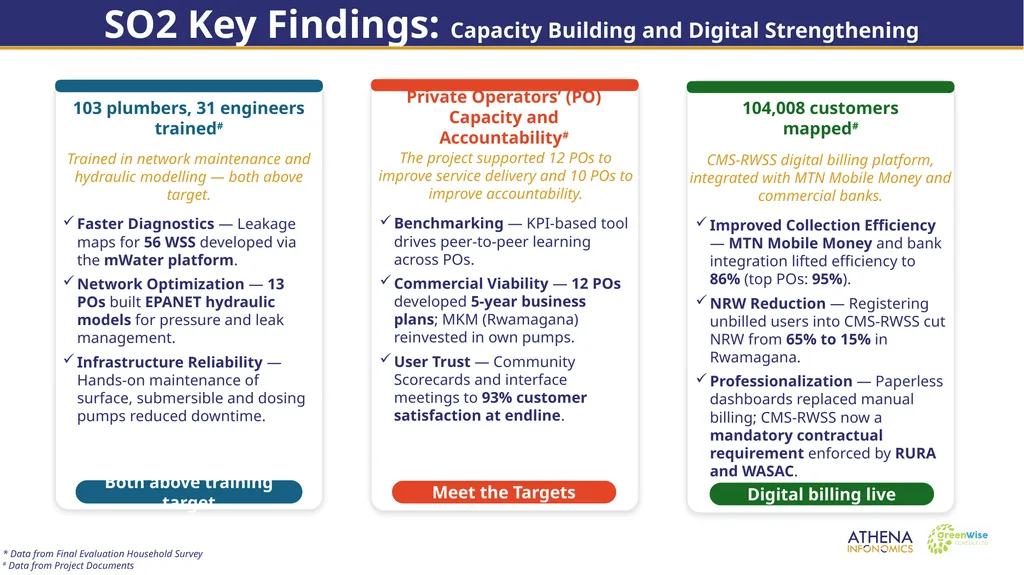
SO2 Key Findings: Capacity Building and Digital Strengthening * Data from Final Evaluation Household Survey
# Data from Project Documents<br>
# Data from Project Documents<br>
12
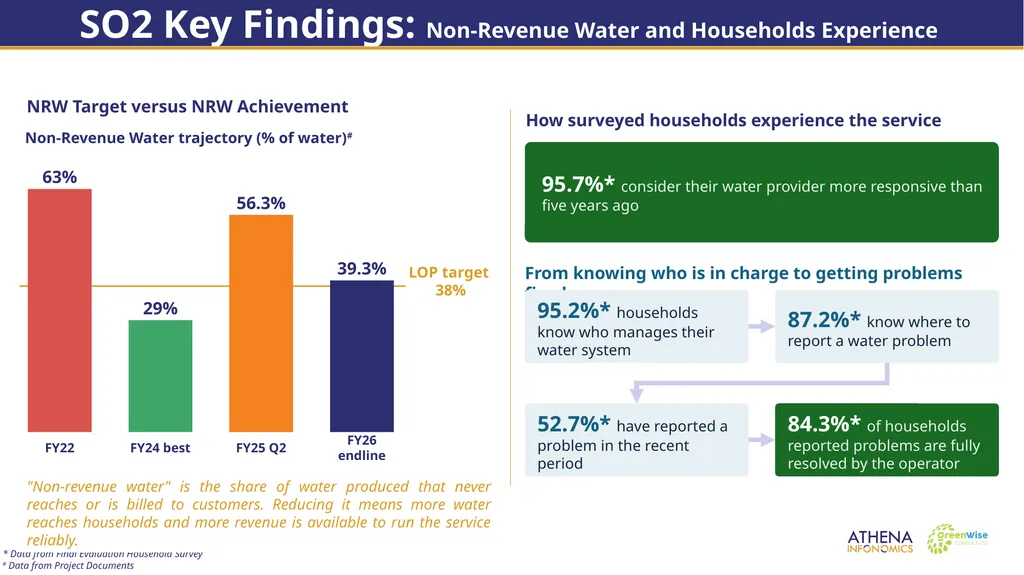
SO2 Key Findings: Non-Revenue Water and Households Experience * Data from Final Evaluation Household Survey
# Data from Project Documents NRW Target versus NRW Achievement "Non-revenue water" is the share of water produced that never reaches or is billed to customers. Reducing it means more water reaches households and more revenue is available to run the service reliably. How surveyed households experience the service 95.7%* consider their water provider more responsive than five years ago From knowing who is in charge to getting problems fixed<br>
# Data from Project Documents NRW Target versus NRW Achievement "Non-revenue water" is the share of water produced that never reaches or is billed to customers. Reducing it means more water reaches households and more revenue is available to run the service reliably. How surveyed households experience the service 95.7%* consider their water provider more responsive than five years ago From knowing who is in charge to getting problems fixed<br>
13
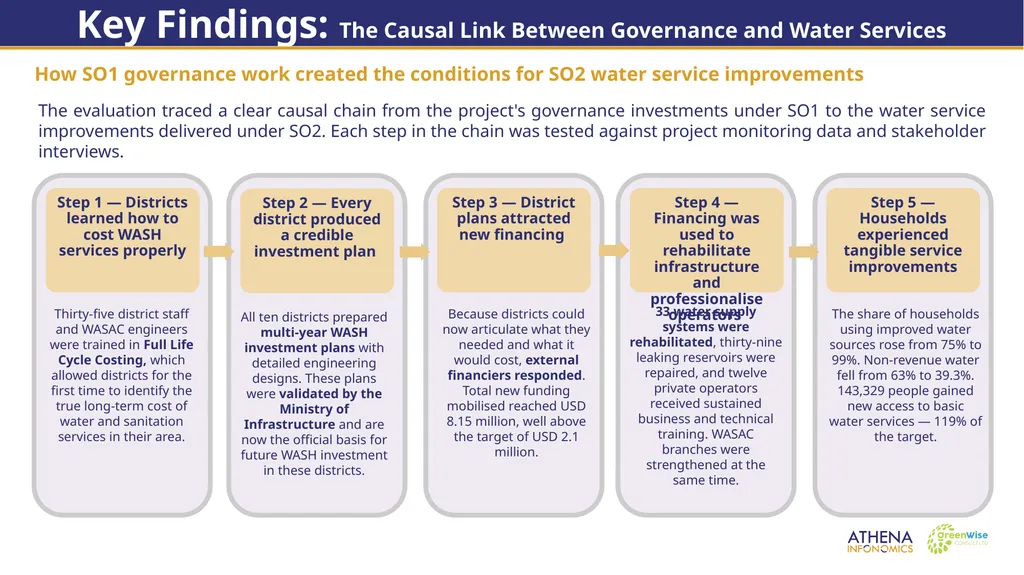
Key Findings: The Causal Link Between Governance and Water Services How SO1 governance work created the conditions for SO2 water service improvements The evaluation traced a clear causal chain from the project's governance investments under SO1 to the water service improvements delivered under SO2. Each step in the chain was tested against project monitoring data and stakeholder interviews.<br>
14
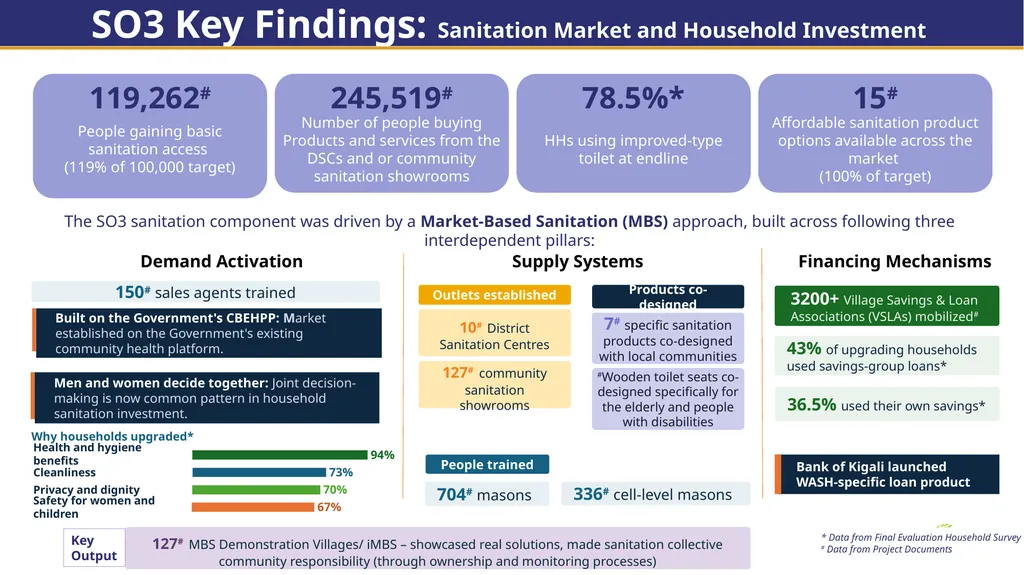
SO3 Key Findings: Sanitation Market and Household Investment 119,262# People gaining basic sanitation access
(119% of 100,000 target) 245,519# Number of people buying Products and services from the DSCs and or community sanitation showrooms 78.5%* HHs using improved-type toilet at endline 15# Affordable sanitation product options available across the market
(100% of target) Demand Activation 3200+ Village Savings & Loan Associations (VSLAs) mobilized# 43% of upgrading households used savings-group loans* 36.5% used their own savings* The SO3 sanitation component was driven by a Market-Based Sanitation (MBS) approach, built across following three interdependent pillars: * Data from Final Evaluation Household Survey
# Data from Project Documents Supply Systems Financing Mechanisms 150# sales agents trained 127# MBS Demonstration Villages/ iMBS – showcased real solutions, made sanitation collective community responsibility (through ownership and monitoring processes) Key
Output<br>
15
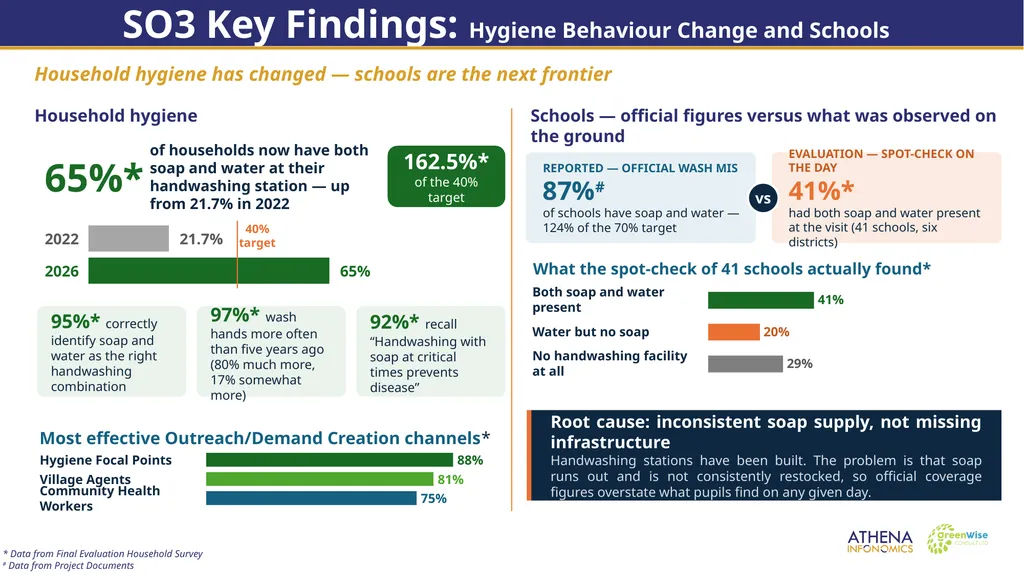
SO3 Key Findings: Hygiene Behaviour Change and Schools Household hygiene has changed — schools are the next frontier Household hygiene Schools — official figures versus what was observed on the ground 65%* of households now have both soap and water at their handwashing station — up from 21.7% in 2022 162.5%*
of the 40% target 2022 21.7% 2026 65% 40% target 95%* correctly identify soap and water as the right handwashing combination 97%* wash hands more often than five years ago (80% much more, 17% somewhat more) 92%* recall “Handwashing with soap at critical times prevents disease” Most effective Outreach/Demand Creation channels* Hygiene Focal Points 88% Village Agents 81% Community Health Workers 75% * Data from Final Evaluation Household Survey
# Data from Project Documents<br>
16
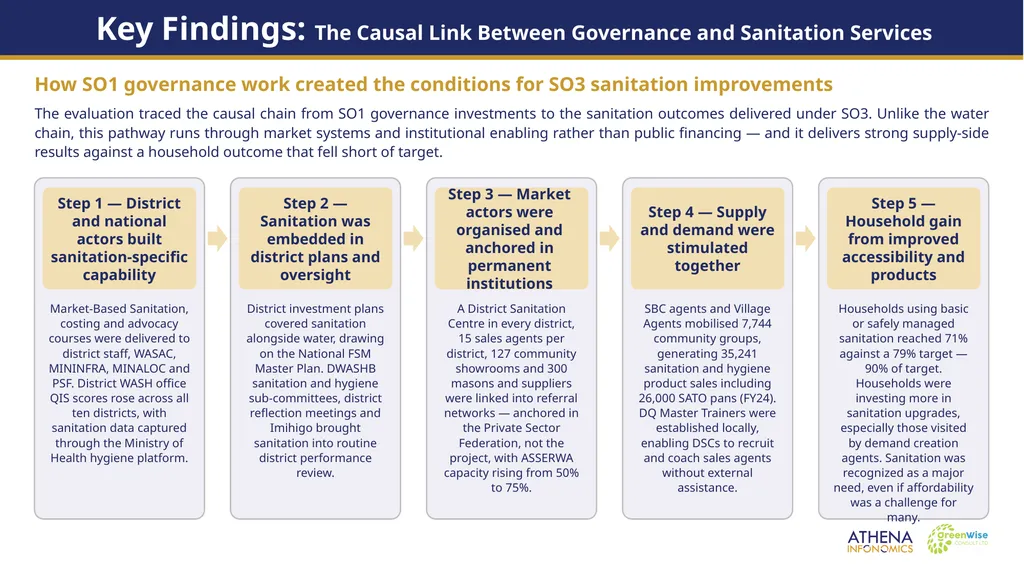
Key Findings: The Causal Link Between Governance and Sanitation Services How SO1 governance work created the conditions for SO3 sanitation improvements The evaluation traced the causal chain from SO1 governance investments to the sanitation outcomes delivered under SO3. Unlike the water chain, this pathway runs through market systems and institutional enabling rather than public financing — and it delivers strong supply-side results against a household outcome that fell short of target. Step 1 — District and national actors built sanitation-specific capability Market-Based Sanitation, costing and advocacy courses were delivered to district staff, WASAC, MININFRA, MINALOC and PSF. District WASH office QIS scores rose across all ten districts, with sanitation data captured through the Ministry of Health hygiene platform. Step 2 — Sanitation was embedded in district plans and oversight District investment plans covered sanitation alongside water, drawing on the National FSM Master Plan. DWASHB sanitation and hygiene sub-committees, district reflection meetings and Imihigo brought sanitation into routine district performance review. Step 3 — Market actors were organised and anchored in permanent institutions A District Sanitation Centre in every district, 15 sales agents per district, 127 community showrooms and 300 masons and suppliers were linked into referral networks — anchored in the Private Sector Federation, not the project, with ASSERWA capacity rising from 50% to 75%. Step 4 — Supply and demand were stimulated together SBC agents and Village Agents mobilised 7,744 community groups, generating 35,241 sanitation and hygiene product sales including 26,000 SATO pans (FY24). DQ Master Trainers were established locally, enabling DSCs to recruit and coach sales agents without external assistance. Step 5 — Household gain from improved accessibility and products Households using basic or safely managed sanitation reached 71% against a 79% target — 90% of target. Households were investing more in sanitation upgrades, especially those visited by demand creation agents. Sanitation was recognized as a major need, even if affordability was a challenge for many.<br>
17
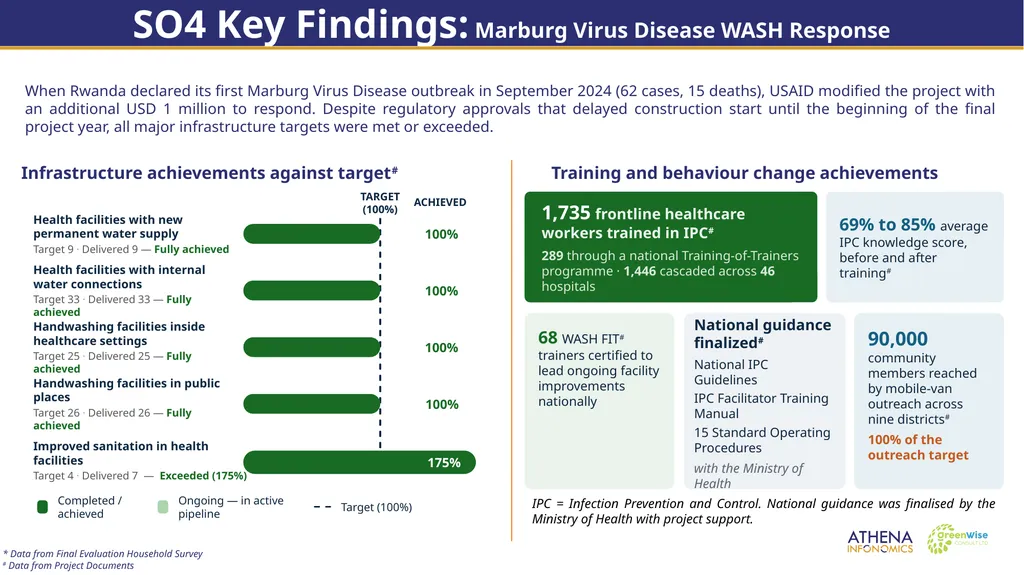
SO4 Key Findings: Marburg Virus Disease WASH Response Infrastructure achievements against target# Training and behaviour change achievements When Rwanda declared its first Marburg Virus Disease outbreak in September 2024 (62 cases, 15 deaths), USAID modified the project with an additional USD 1 million to respond. Despite regulatory approvals that delayed construction start until the beginning of the final project year, all major infrastructure targets were met or exceeded. TARGET (100%) Health facilities with new permanent water supply
Target 9 · Delivered 9 — Fully achieved 100% Health facilities with internal water connections
Target 33 · Delivered 33 — Fully achieved 100% Handwashing facilities inside healthcare settings
Target 25 · Delivered 25 — Fully achieved 100% Handwashing facilities in public places
Target 26 · Delivered 26 — Fully achieved 100% Improved sanitation in health facilities
Target 4 · Delivered 7 — Exceeded (175%) 175% Completed / achieved Ongoing — in active pipeline Target (100%) ACHIEVED * Data from Final Evaluation Household Survey
# Data from Project Documents<br>
18
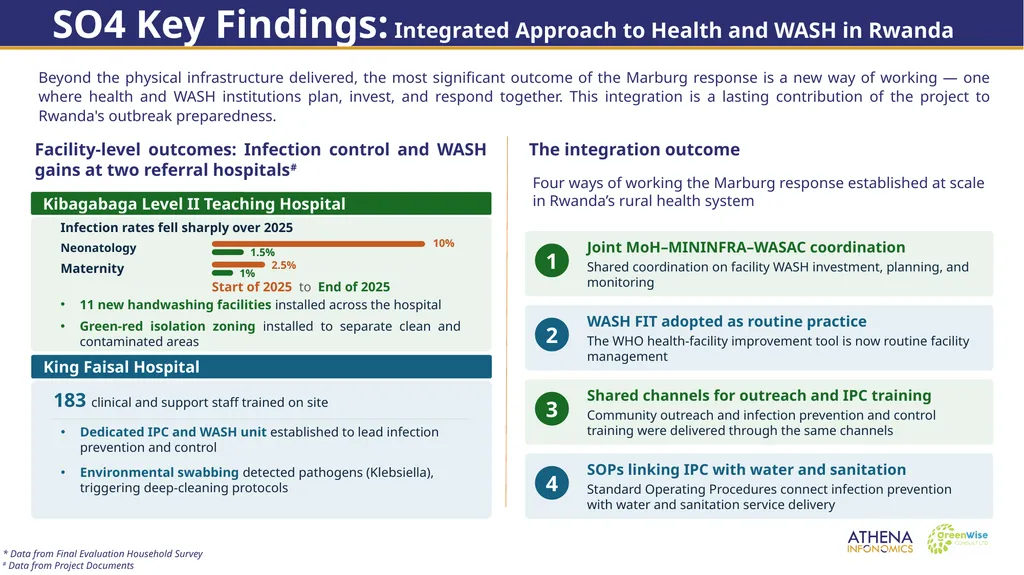
SO4 Key Findings: Integrated Approach to Health and WASH in Rwanda Beyond the physical infrastructure delivered, the most significant outcome of the Marburg response is a new way of working — one where health and WASH institutions plan, invest, and respond together. This integration is a lasting contribution of the project to Rwanda's outbreak preparedness. Facility-level outcomes: Infection control and WASH gains at two referral hospitals# The integration outcome 10% * Data from Final Evaluation Household Survey
# Data from Project Documents<br>
# Data from Project Documents<br>
19
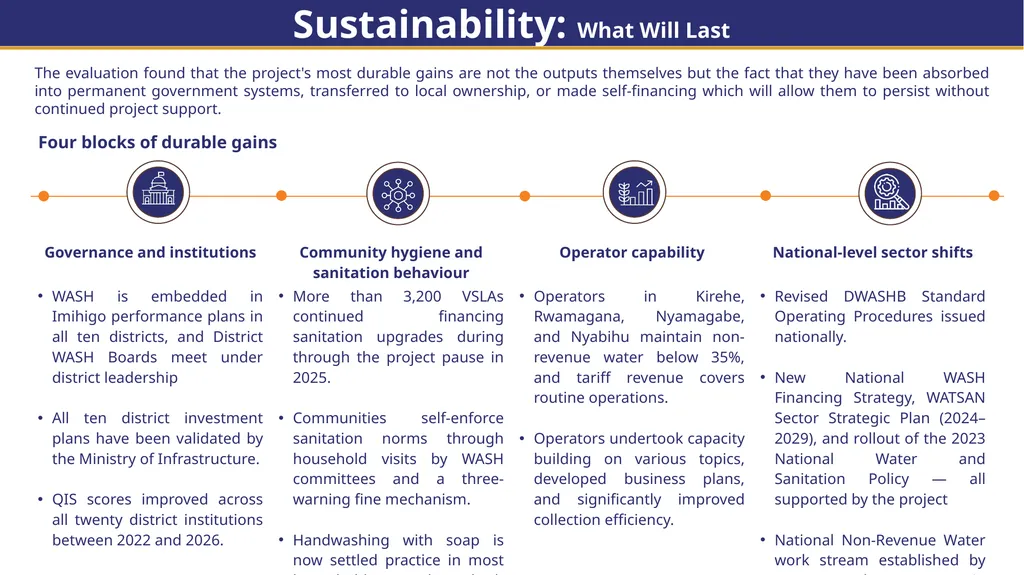
Sustainability: What Will Last The evaluation found that the project's most durable gains are not the outputs themselves but the fact that they have been absorbed into permanent government systems, transferred to local ownership, or made self-financing which will allow them to persist without continued project support. Four blocks of durable gains<br>
20
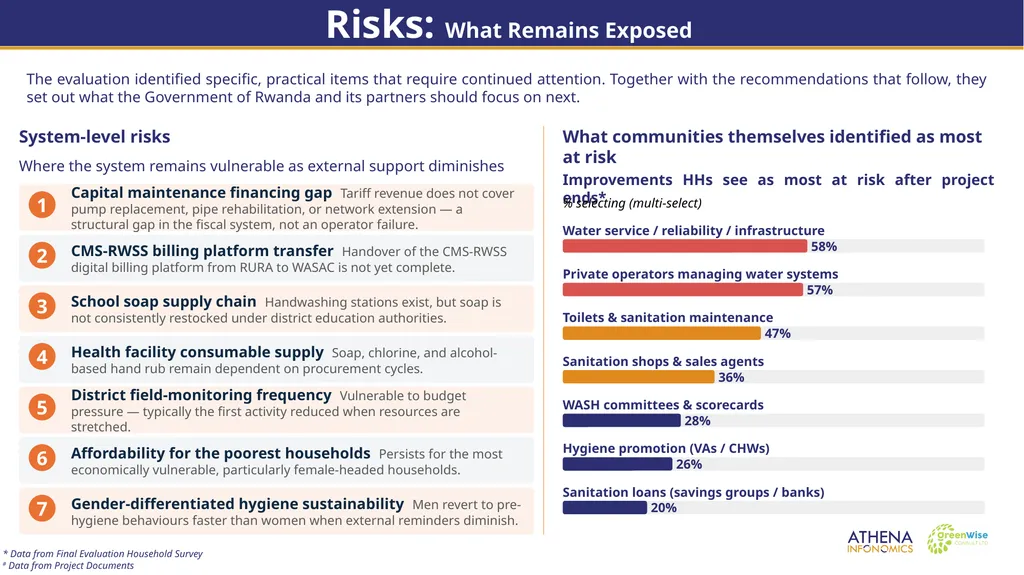
Risks: What Remains Exposed System-level risks The evaluation identified specific, practical items that require continued attention. Together with the recommendations that follow, they set out what the Government of Rwanda and its partners should focus on next. What communities themselves identified as most at risk * Data from Final Evaluation Household Survey
# Data from Project Documents<br>
# Data from Project Documents<br>
21
Recommendations: Ministry of Infrastructure (MININFRA) R-01 — Immediate (0–6 months) — 🟦 Sustainability: Finalise and formally issue the revised DWASHB Standard Operating Procedures, accompanied by a ministerial circular clarifying District WASH Board funding sources under the delegated rural water management model.
R-02 — Within 1 year — 🟦 Sustainability: Create a dedicated district budget line for District WASH Board operationalisation covering sitting allowances, monitoring visits, and reflection meetings, separate from general WASH or district-office budget lines.
R-03 — Within 1 year — 🟦 Sustainability: Design hygiene promotion reinforcement cycles with gender-differentiated approaches, sustaining male-targeted reinforcement sessions beyond the initial behaviour-change period rather than concentrating reinforcement on women alone.
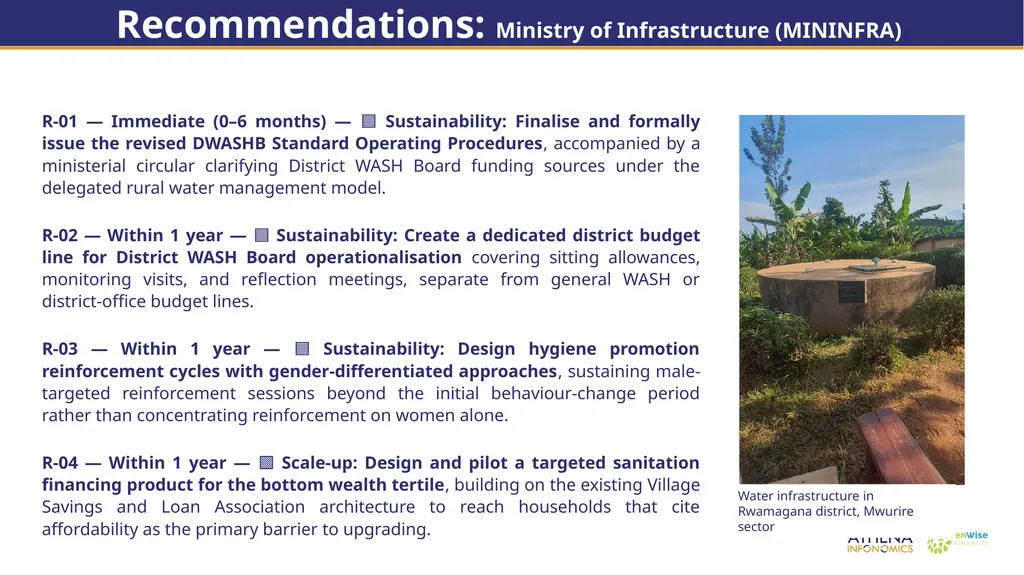
R-04 — Within 1 year — 🟩 Scale-up: Design and pilot a targeted sanitation financing product for the bottom wealth tertile, building on the existing Village Savings and Loan Association architecture to reach households that cite affordability as the primary barrier to upgrading. Water infrastructure in Rwamagana district, Mwurire sector<br>
22
Recommendations: RURA and WASAC Recommendations for RURA (regulator) and WASAC (utility) — the sector's oversight and delivery institutions R-05 — Within 1 year — 🟦 Sustainability: Set a binding transition date for the CMS-RWSS platform handover to WASAC, or formalise a co-hosting arrangement with clearly defined responsibilities.
R-06 — Medium-term (2–3 years) — 🟩 Scale-up Opportunity: Introduce periodic independent verification of non-revenue water and district metered area functionality for rural and private-operator systems.
R-07 — Medium-term (2–3 years) — 🟪 Future Programming: Design a distinct tariff and licensing sub-model for small, decentralised private and youth-led rural water operators, recognising their financial viability constraints.
R-08 — Medium-term (2–3 years) — 🟨 Institutional Reform: Develop a regulatory response to the risk of private-connection exit from communal water point governance, addressing the risk that wealthier households withdrawing into private connections erodes the fee base and citizen-oversight layer that communal systems depend on. R-09 — Within 1 year — 🟩 Scale-up Opportunity: Replicate the district metered area zoning, meter testing, and mWater leak-tracking practices across all remaining WASAC branches, and institutionalise quarterly non-revenue water task-force meetings as standing practice.
R-10 — Medium-term (2–3 years) — 🟪 Future Programming: Treat supply-continuity improvement (storage and transmission capacity) as a capital investment priority distinct from non-revenue water reduction, sequenced by branch using updated district investment plans. For RURA: For WASAC:<br>
23
Recommendations: District WASH Boards Three recommendations for District WASH Boards — the sector's district-level coordination structure R-11 — Immediate (0–6 months) — 🟦 Sustainability: Formally constitute District WASH Board roles and budget responsibility under the revised SOPs on issuance, and institutionalise semi-annual reflection meetings as a standing, district-chaired item on the governance calendar.
R-12 — Annual cycle — 🟨 Institutional Reform: Use updated, full-life-cycle-costed district WASH investment plans as the actual basis for each district's annual WASH budget submission, rather than as a parallel planning exercise.
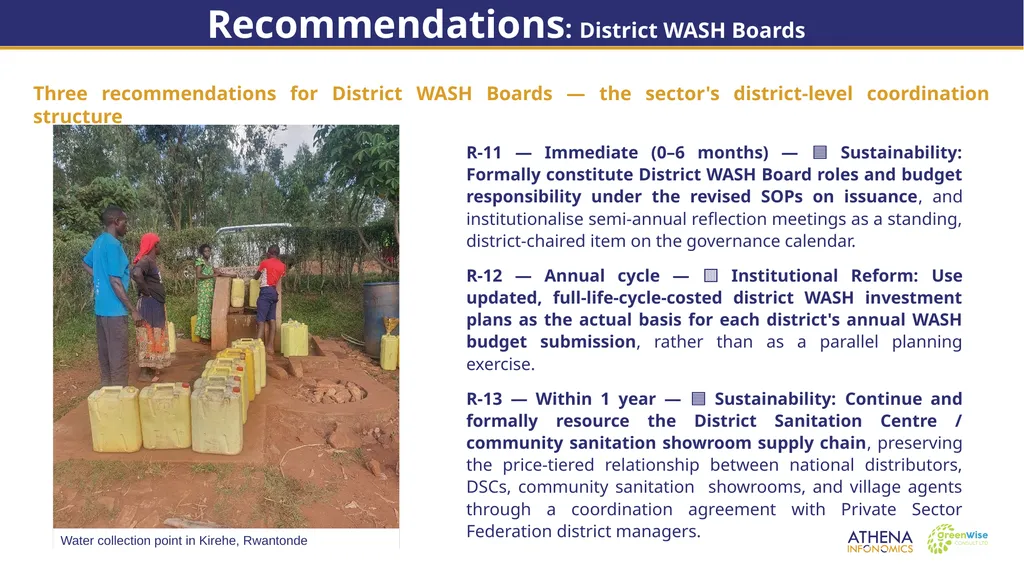
R-13 — Within 1 year — 🟦 Sustainability: Continue and formally resource the District Sanitation Centre / community sanitation showroom supply chain, preserving the price-tiered relationship between national distributors, DSCs, community sanitation showrooms, and village agents through a coordination agreement with Private Sector Federation district managers. Water collection point in Kirehe, Rwantonde<br>
24
Recommendations: District Government Four recommendations for direct district-level action R-14 — Within 1 year — 🟦 Sustainability: Formally close the gap between district WASH investment plans and the district budget cycle by integrating WASH investment plan priorities into annual district budget submissions as standard practice.
R-15 — Within 1 year — 🟨 Institutional Reform: Close the accountability gap between DWASHB oversight and private-operator performance by requiring monthly technical and financial reports to WASH committees in a standardised format.
R-16 — Within 1 year — 🟩 Scale-up Opportunity: Use the Rwamagana peer-learning model as a standing peer-exchange mechanism, targeting the districts where NRW remains above 38% and youth-led operators are still consolidating.
R-17 — Ongoing — 🟦 Sustainability: Absorb Hygiene Focal Points into the district's existing community health structures, ensuring they are supervised, tasked and reimbursed through the same systems as Village Health Workers and CBEHPP agents.<br>
25
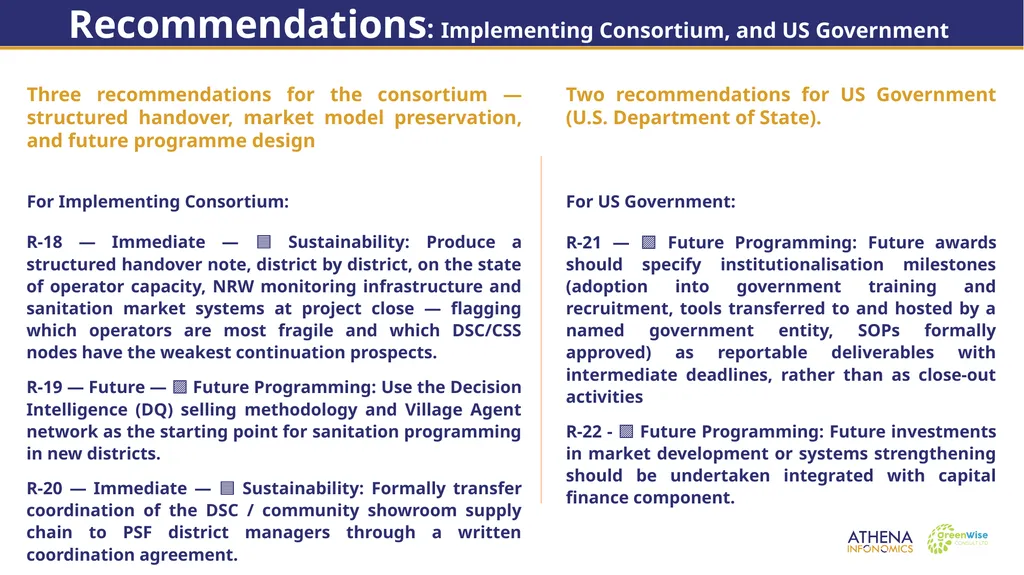
Recommendations: Implementing Consortium, and US Government Three recommendations for the consortium — structured handover, market model preservation, and future programme design R-18 — Immediate — 🟦 Sustainability: Produce a structured handover note, district by district, on the state of operator capacity, NRW monitoring infrastructure and sanitation market systems at project close — flagging which operators are most fragile and which DSC/CSS nodes have the weakest continuation prospects.
R-19 — Future — 🟪 Future Programming: Use the Decision Intelligence (DQ) selling methodology and Village Agent network as the starting point for sanitation programming in new districts.
R-20 — Immediate — 🟦 Sustainability: Formally transfer coordination of the DSC / community showroom supply chain to PSF district managers through a written coordination agreement. R-21 — 🟪 Future Programming: Future awards should specify institutionalisation milestones (adoption into government training and recruitment, tools transferred to and hosted by a named government entity, SOPs formally approved) as reportable deliverables with intermediate deadlines, rather than as close-out activities
R-22 - 🟪 Future Programming: Future investments in market development or systems strengthening should be undertaken integrated with capital finance component. For Implementing Consortium: For US Government: Two recommendations for US Government (U.S. Department of State).<br>
26
Thank you<br>