
Flexible in Approach, Firm on Results Flexible in
BR
Published · 23 slides · 0 views

1 / 1
Description
Flexible in Approach, Firm on Results Flexible in Approach, Firm on Results CY 2016 (Annual) Edition Review of online cab market in India A comprehensive performance review of the online cab aggregator market Assessed through a regularly
Related Topics
Share
Embed code
Download this presentation From Below
"Flexible in Approach, Firm on Results Flexible in" is the property of its rightful owner. Permission is granted to download and print the materials on this website for personal, non-commercial use only, and to display it on your personal computer provided you do not modify the materials and that you retain all copyright notices contained in the materials. By downloading content from our website, you accept the terms of this agreement.
Presentation Transcript
01
Flexible in Approach, Firm on Results Flexible in Approach, Firm on Results CY 2016 (Annual) Edition Review of online cab market in India A comprehensive performance review of the online cab aggregator market
Assessed through a regularly tracked set of performance indicators
Published quarterly 1 Published in Feb 2017<br>
Assessed through a regularly tracked set of performance indicators
Published quarterly 1 Published in Feb 2017<br>
02
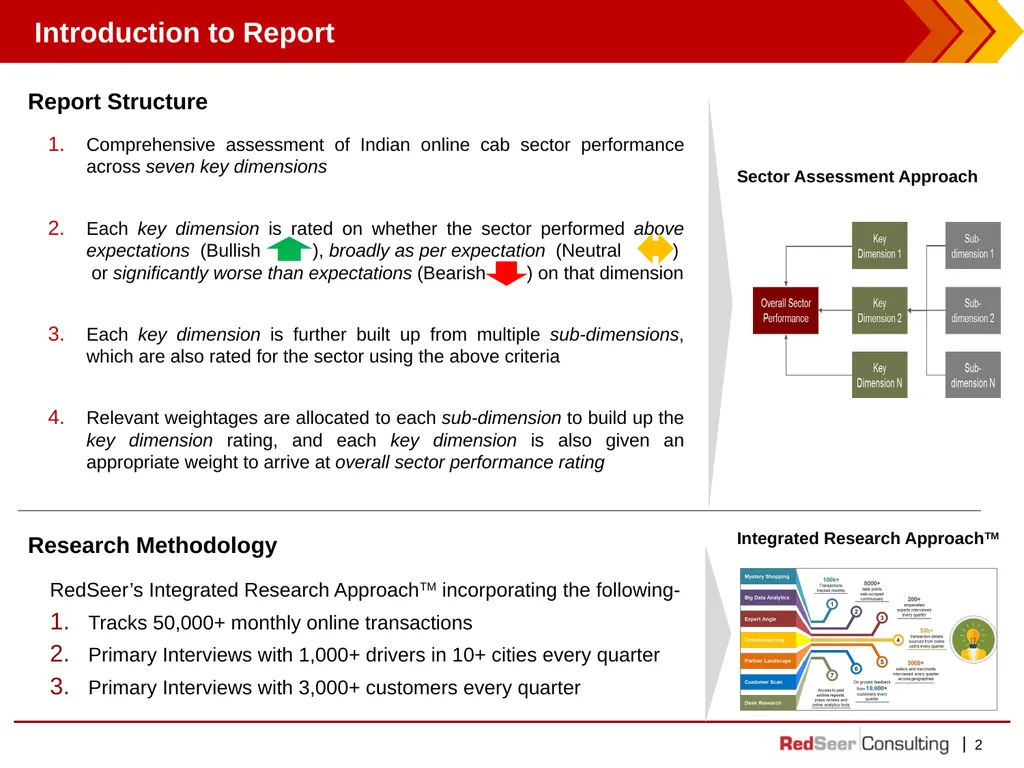
E-Tailing Industry Performance Score- CY 2016 Introduction to Report 2 Comprehensive assessment of Indian online cab sector performance across seven key dimensions
Each key dimension is rated on whether the sector performed above expectations (Bullish ), broadly as per expectation (Neutral ) or significantly worse than expectations (Bearish ) on that dimension
Each key dimension is further built up from multiple sub-dimensions, which are also rated for the sector using the above criteria
Relevant weightages are allocated to each sub-dimension to build up the key dimension rating, and each key dimension is also given an appropriate weight to arrive at overall sector performance rating Report Structure Research Methodology RedSeer’s Integrated Research ApproachTM incorporating the following-
Tracks 50,000+ monthly online transactions
Primary Interviews with 1,000+ drivers in 10+ cities every quarter
Primary Interviews with 3,000+ customers every quarter Sector Assessment Approach Integrated Research ApproachTM<br>
03
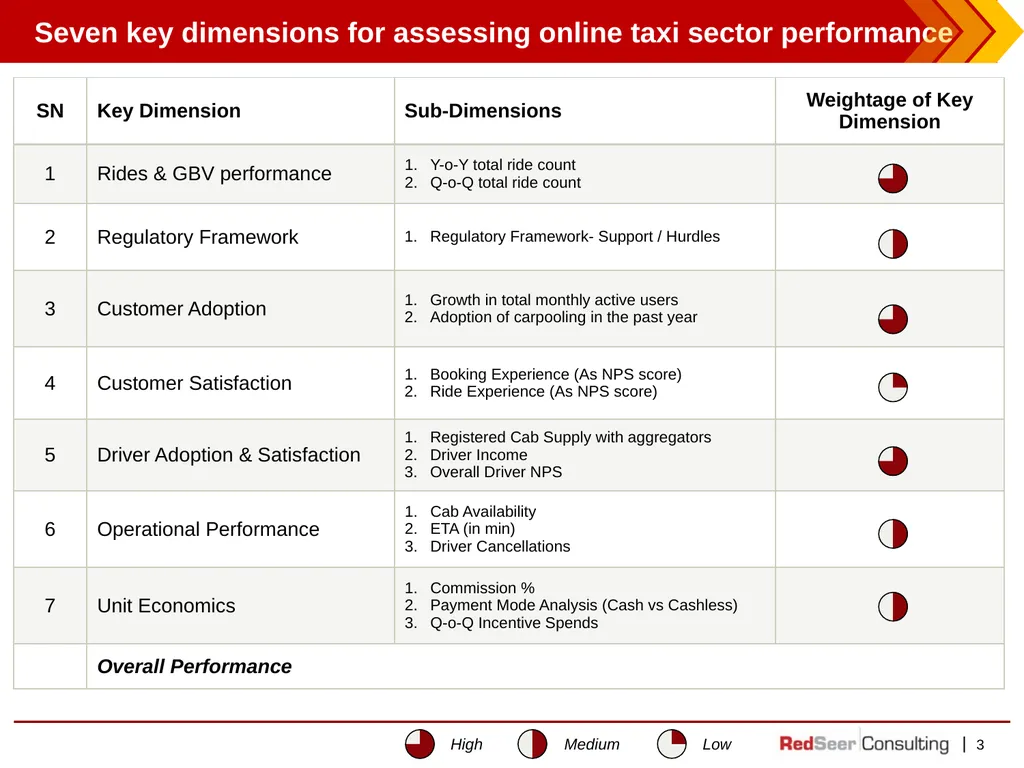
E-Tailing Industry Performance Score- CY 2016 Seven key dimensions for assessing online taxi sector performance 3 Medium High Low<br>
04
Agenda 4<br>
05
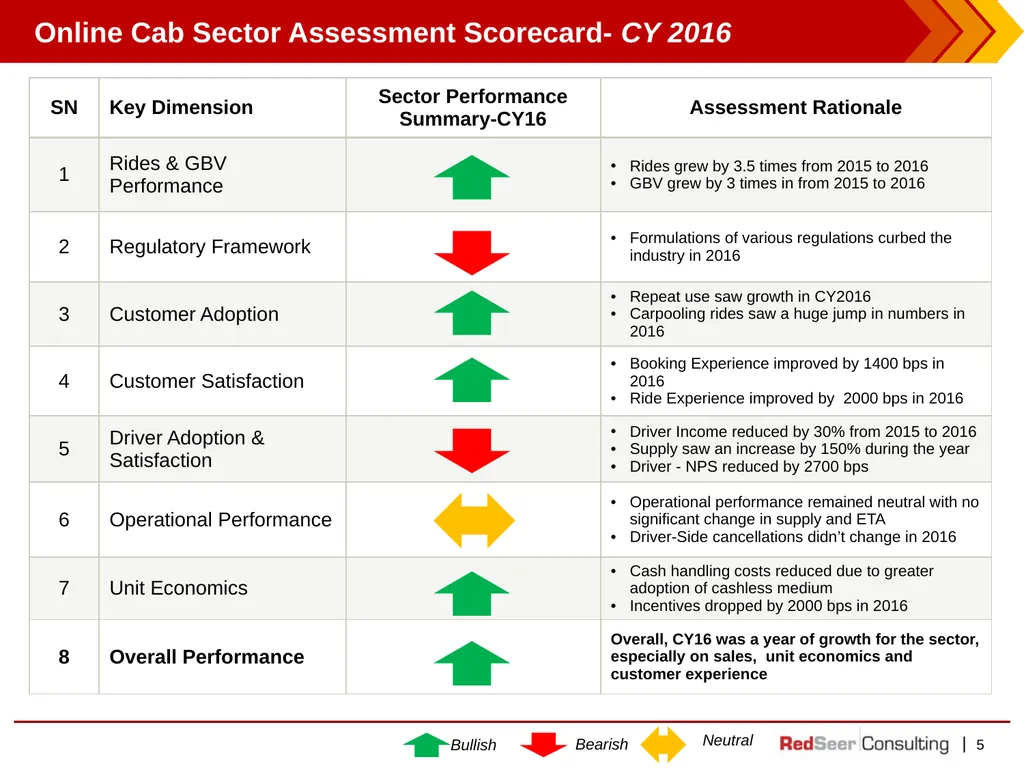
E-Tailing Industry Performance Score- CY 2016 Online Cab Sector Assessment Scorecard- CY 2016 Bearish Bullish Neutral 5<br>
06
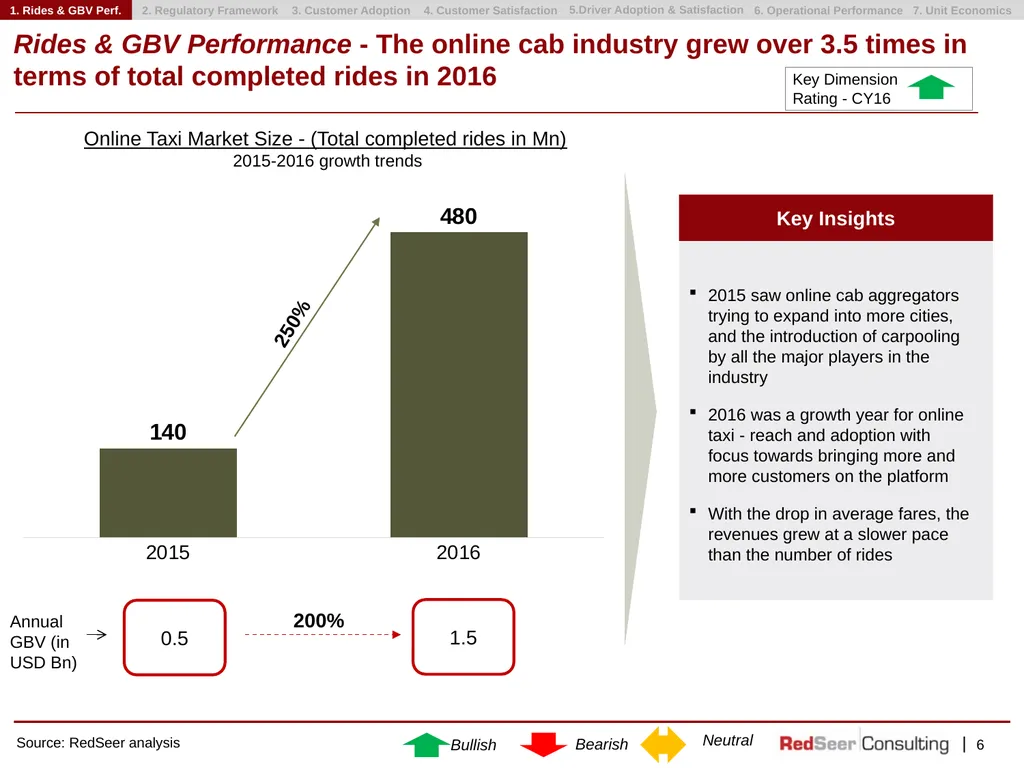
6 Rides & GBV Performance - The online cab industry grew over 3.5 times in terms of total completed rides in 2016 Source: RedSeer analysis Online Taxi Market Size - (Total completed rides in Mn)
2015-2016 growth trends 250% Bearish Bullish Neutral Key Dimension Rating - CY16 Annual GBV (in USD Bn) 0.5 1.5 1. Rides & GBV Perf. 2. Regulatory Framework 3. Customer Adoption 4. Customer Satisfaction 5.Driver Adoption & Satisfaction 6. Operational Performance 7. Unit Economics 200%<br>
2015-2016 growth trends 250% Bearish Bullish Neutral Key Dimension Rating - CY16 Annual GBV (in USD Bn) 0.5 1.5 1. Rides & GBV Perf. 2. Regulatory Framework 3. Customer Adoption 4. Customer Satisfaction 5.Driver Adoption & Satisfaction 6. Operational Performance 7. Unit Economics 200%<br>
07
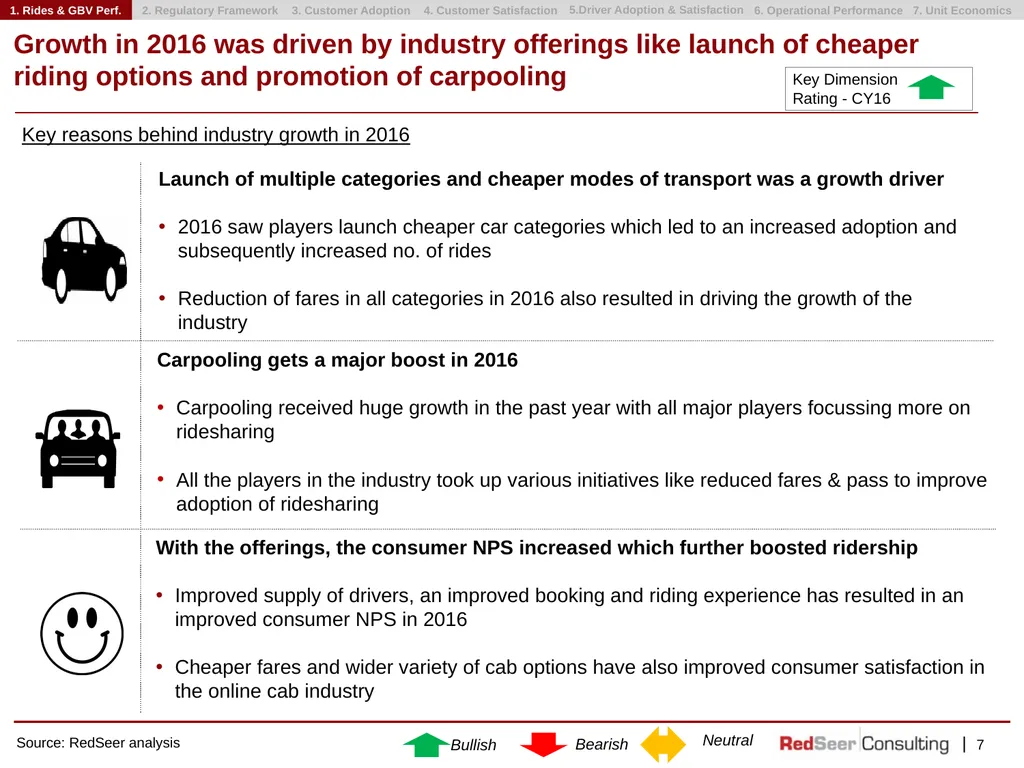
7 Growth in 2016 was driven by industry offerings like launch of cheaper riding options and promotion of carpooling Source: RedSeer analysis Carpooling gets a major boost in 2016
Carpooling received huge growth in the past year with all major players focussing more on ridesharing
All the players in the industry took up various initiatives like reduced fares & pass to improve adoption of ridesharing Launch of multiple categories and cheaper modes of transport was a growth driver
2016 saw players launch cheaper car categories which led to an increased adoption and subsequently increased no. of rides
Reduction of fares in all categories in 2016 also resulted in driving the growth of the industry With the offerings, the consumer NPS increased which further boosted ridership
Improved supply of drivers, an improved booking and riding experience has resulted in an improved consumer NPS in 2016
Cheaper fares and wider variety of cab options have also improved consumer satisfaction in the online cab industry Key reasons behind industry growth in 2016 Bearish Bullish Neutral Key Dimension Rating - CY16 1. Rides & GBV Perf. 2. Regulatory Framework 3. Customer Adoption 4. Customer Satisfaction 5.Driver Adoption & Satisfaction 6. Operational Performance 7. Unit Economics<br>
08
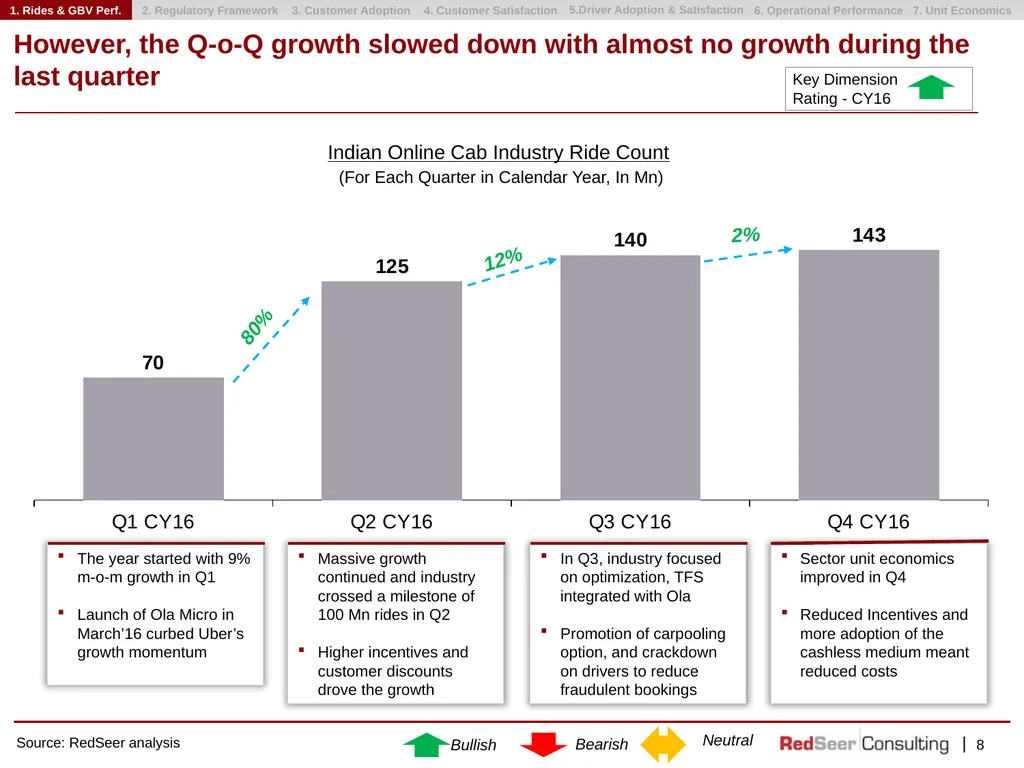
8 However, the Q-o-Q growth slowed down with almost no growth during the last quarter Source: RedSeer analysis Indian Online Cab Industry Ride Count
(For Each Quarter in Calendar Year, In Mn) Bearish Bullish Neutral The year started with 9% m-o-m growth in Q1
Launch of Ola Micro in March’16 curbed Uber’s growth momentum Massive growth continued and industry crossed a milestone of 100 Mn rides in Q2
Higher incentives and customer discounts drove the growth In Q3, industry focused on optimization, TFS integrated with Ola
Promotion of carpooling option, and crackdown on drivers to reduce fraudulent bookings Sector unit economics improved in Q4
Reduced Incentives and more adoption of the cashless medium meant reduced costs 80% 12% 2% Key Dimension Rating - CY16 1. Rides & GBV Perf. 2. Regulatory Framework 3. Customer Adoption 4. Customer Satisfaction 5.Driver Adoption & Satisfaction 6. Operational Performance 7. Unit Economics<br>
09
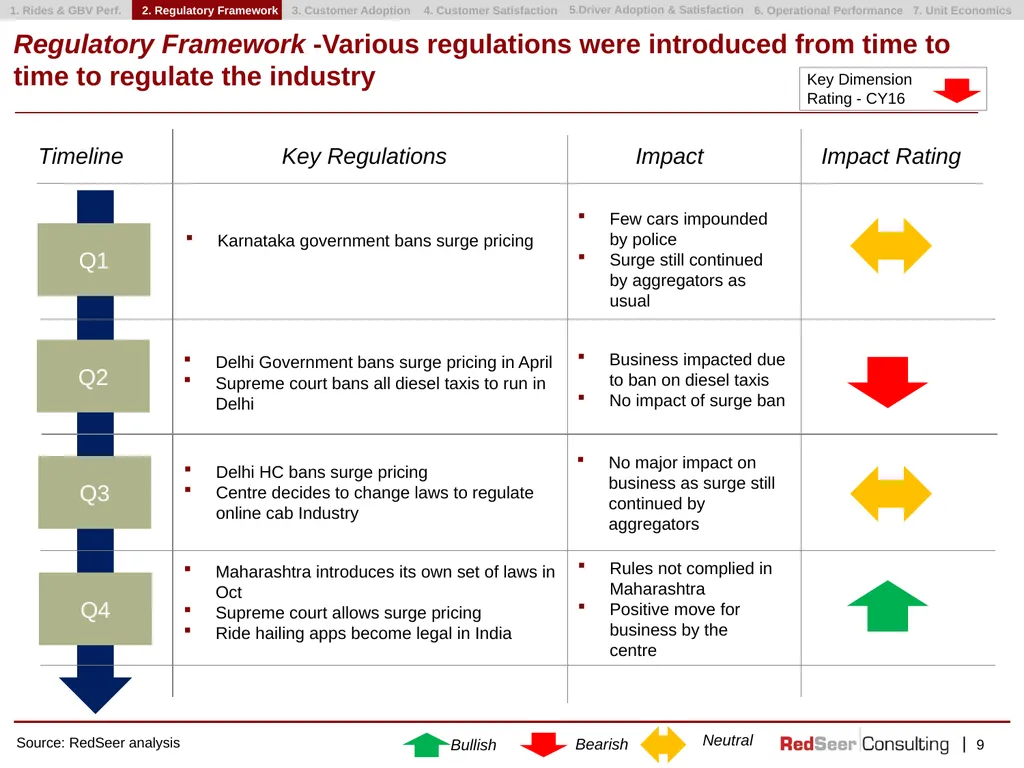
Regulatory Framework -Various regulations were introduced from time to time to regulate the industry Key Dimension Rating - CY16 1. Rides & GBV Perf. 2. Regulatory Framework 3. Customer Adoption 4. Customer Satisfaction 5.Driver Adoption & Satisfaction 6. Operational Performance 7. Unit Economics 9 Source: RedSeer analysis Bearish Bullish Neutral Q1 Q2 Q3 Q4 Key Regulations Impact Impact Rating Delhi HC bans surge pricing
Centre decides to change laws to regulate online cab Industry Karnataka government bans surge pricing Delhi Government bans surge pricing in April
Supreme court bans all diesel taxis to run in Delhi Maharashtra introduces its own set of laws in Oct
Supreme court allows surge pricing
Ride hailing apps become legal in India Few cars impounded by police
Surge still continued by aggregators as usual Business impacted due to ban on diesel taxis
No impact of surge ban No major impact on business as surge still continued by aggregators Rules not complied in Maharashtra
Positive move for business by the centre Timeline<br>
10
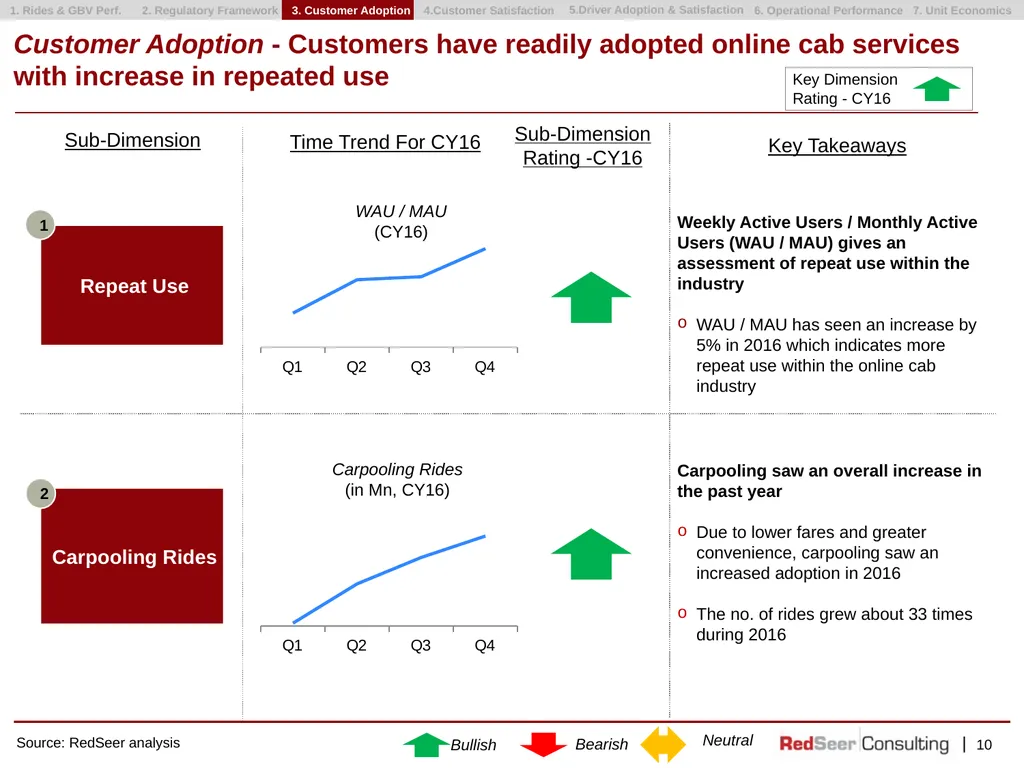
10 Customer Adoption - Customers have readily adopted online cab services with increase in repeated use Source: RedSeer analysis Bearish Bullish Neutral Carpooling Rides 1 2 Sub-Dimension Sub-Dimension Rating -CY16 Key Takeaways Key Dimension Rating - CY16 Weekly Active Users / Monthly Active Users (WAU / MAU) gives an assessment of repeat use within the industry
WAU / MAU has seen an increase by 5% in 2016 which indicates more repeat use within the online cab industry Carpooling saw an overall increase in the past year
Due to lower fares and greater convenience, carpooling saw an increased adoption in 2016
The no. of rides grew about 33 times during 2016 1. Rides & GBV Perf. 2. Regulatory Framework 3. Customer Adoption 4.Customer Satisfaction 5.Driver Adoption & Satisfaction 6. Operational Performance 7. Unit Economics Time Trend For CY16 WAU / MAU
(CY16) Carpooling Rides
(in Mn, CY16)<br>
11
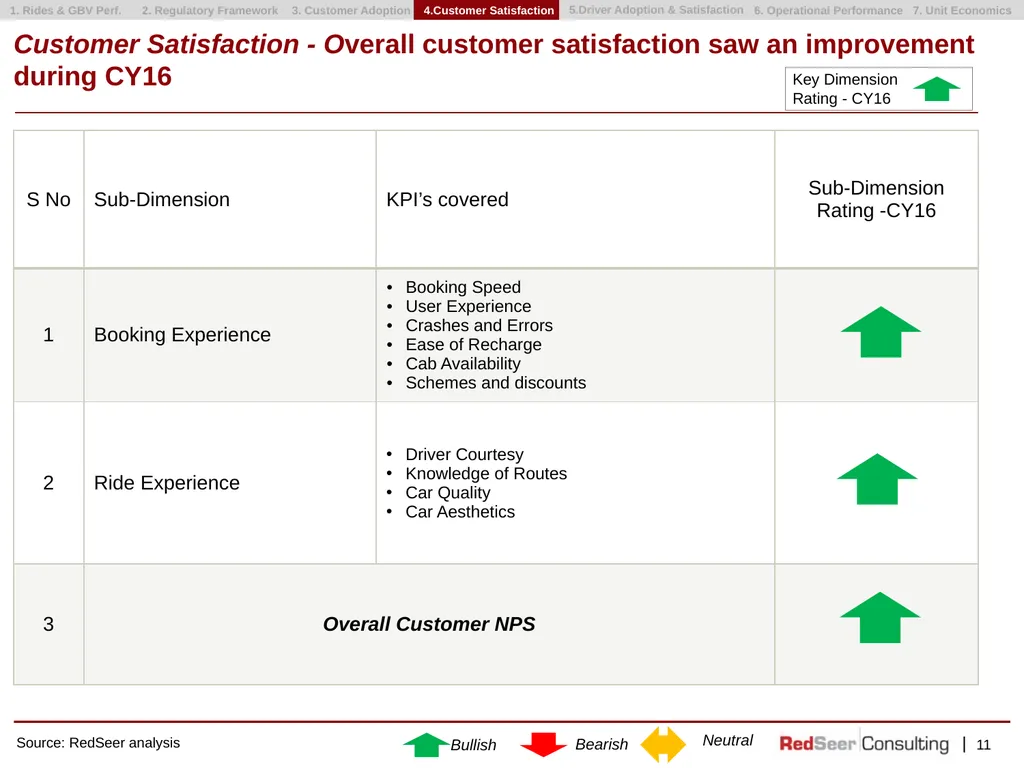
11 Customer Satisfaction - Overall customer satisfaction saw an improvement during CY16 Source: RedSeer analysis Bearish Bullish Neutral Key Dimension Rating - CY16 1. Rides & GBV Perf. 2. Regulatory Framework 3. Customer Adoption 4.Customer Satisfaction 5.Driver Adoption & Satisfaction 6. Operational Performance 7. Unit Economics<br>
12
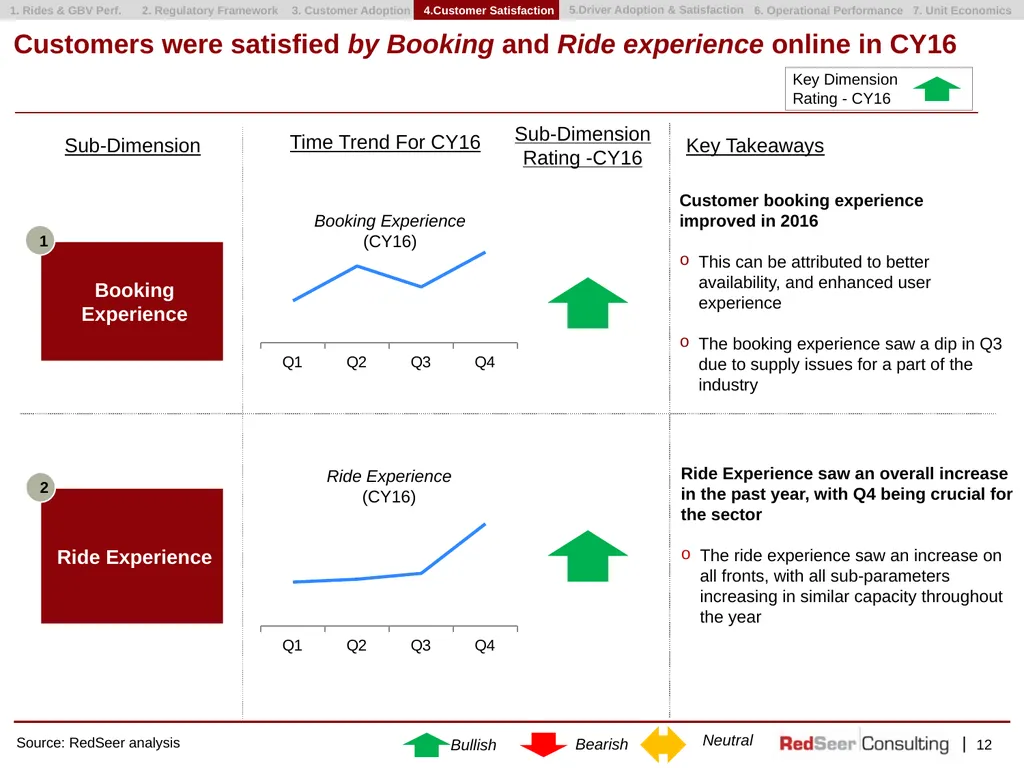
12 Customers were satisfied by Booking and Ride experience online in CY16 Source: RedSeer analysis Bearish Bullish Neutral Ride Experience 1 2 Sub-Dimension Sub-Dimension Rating -CY16 Key Takeaways Key Dimension Rating - CY16 Customer booking experience improved in 2016
This can be attributed to better availability, and enhanced user experience
The booking experience saw a dip in Q3 due to supply issues for a part of the industry Ride Experience saw an overall increase in the past year, with Q4 being crucial for the sector
The ride experience saw an increase on all fronts, with all sub-parameters increasing in similar capacity throughout the year 1. Rides & GBV Perf. 2. Regulatory Framework 3. Customer Adoption 4.Customer Satisfaction 5.Driver Adoption & Satisfaction 6. Operational Performance 7. Unit Economics Time Trend For CY16 Booking Experience
(CY16) Ride Experience
(CY16)<br>
13
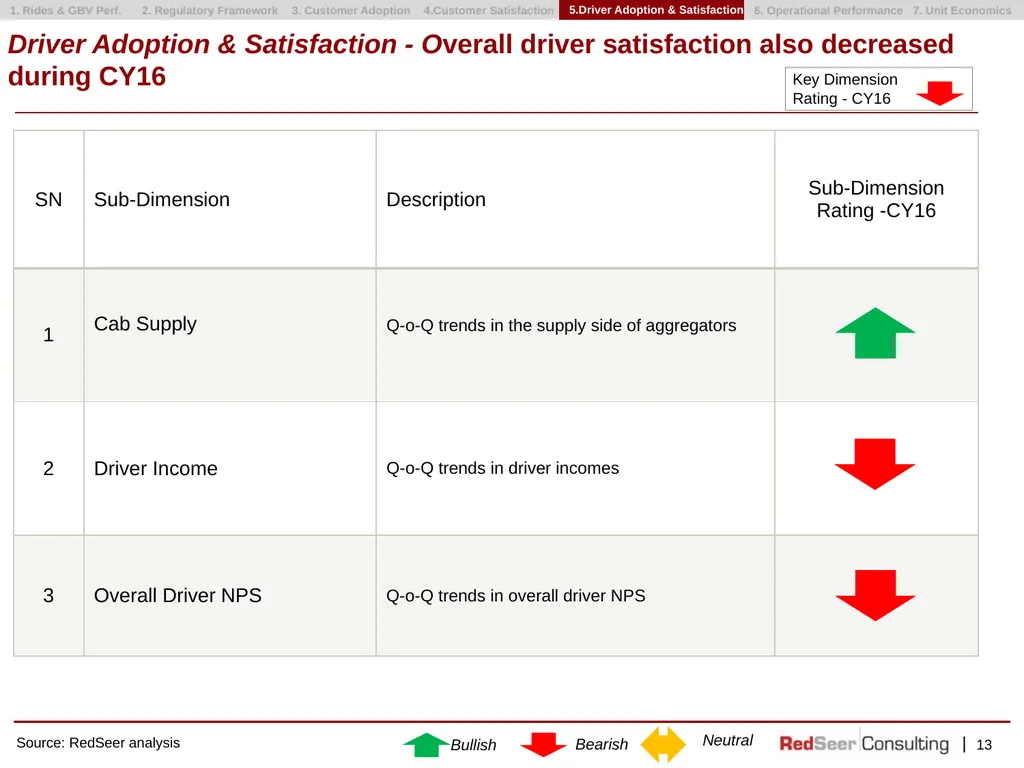
13 Driver Adoption & Satisfaction - Overall driver satisfaction also decreased during CY16 Source: RedSeer analysis Bearish Bullish Neutral Key Dimension Rating - CY16 1. Rides & GBV Perf. 2. Regulatory Framework 3. Customer Adoption 4.Customer Satisfaction 5.Driver Adoption & Satisfaction 6. Operational Performance 7. Unit Economics<br>
14
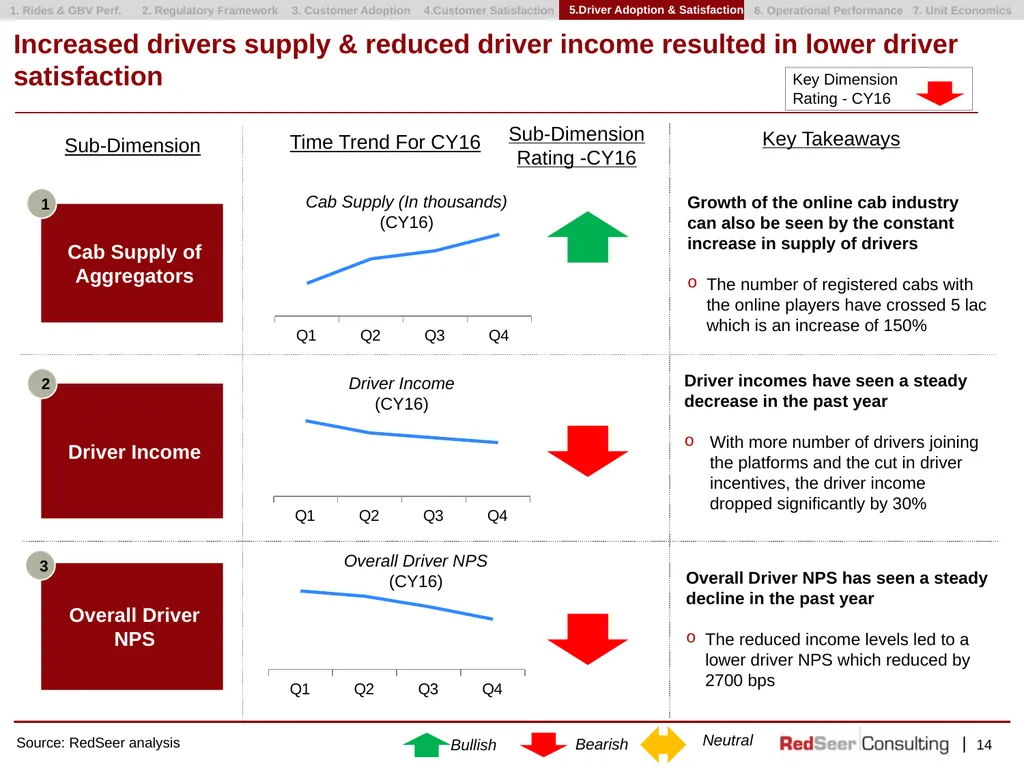
14 Increased drivers supply & reduced driver income resulted in lower driver satisfaction Source: RedSeer analysis Bearish Bullish Neutral Key Dimension Rating - CY16 Sub-Dimension Sub-Dimension Rating -CY16 Driver incomes have seen a steady decrease in the past year
With more number of drivers joining the platforms and the cut in driver incentives, the driver income dropped significantly by 30% Growth of the online cab industry can also be seen by the constant increase in supply of drivers
The number of registered cabs with the online players have crossed 5 lac which is an increase of 150% 1. Rides & GBV Perf. 2. Regulatory Framework 3. Customer Adoption 4.Customer Satisfaction 5.Driver Adoption & Satisfaction 6. Operational Performance 7. Unit Economics Overall Driver NPS has seen a steady decline in the past year
The reduced income levels led to a lower driver NPS which reduced by 2700 bps Driver Income Overall Driver NPS 1 2 3 Key Takeaways Time Trend For CY16 Driver Income
(CY16) Cab Supply (In thousands)
(CY16) Overall Driver NPS
(CY16)<br>
15
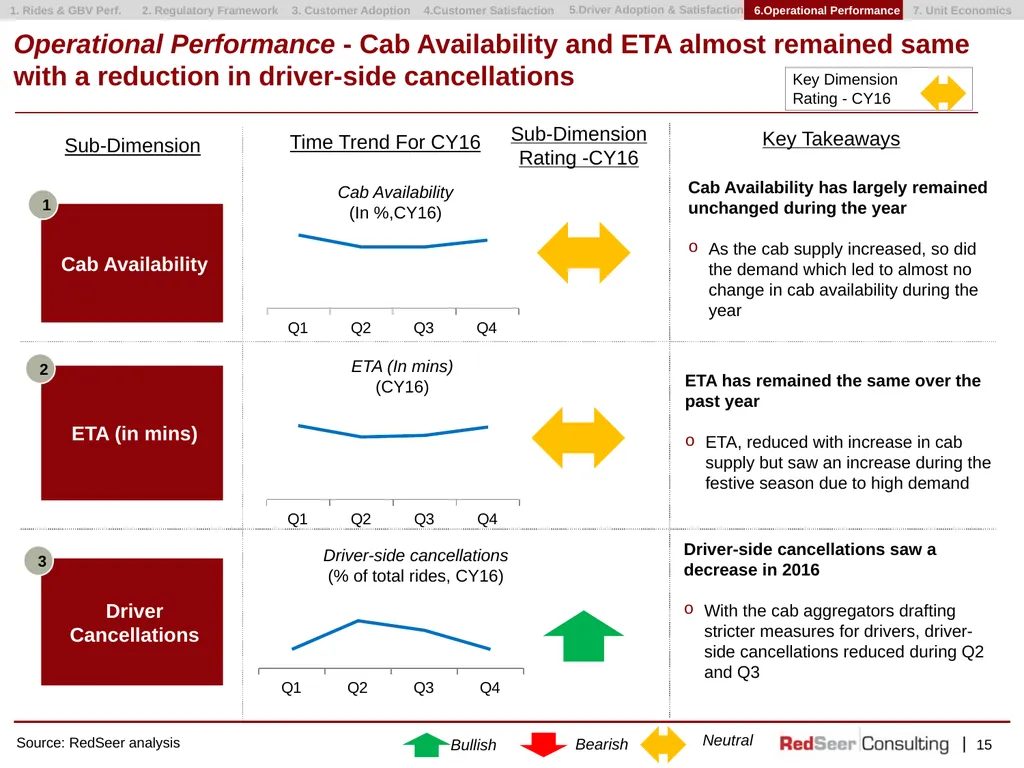
15 Operational Performance - Cab Availability and ETA almost remained same with a reduction in driver-side cancellations Source: RedSeer analysis Bearish Bullish Neutral Key Dimension Rating - CY16 ETA (in mins) Driver Cancellations 1 2 3 Sub-Dimension Sub-Dimension Rating -CY16 Cab Availability
(In %,CY16) Time Trend For CY16 Driver-side cancellations
(% of total rides, CY16) Cab Availability has largely remained unchanged during the year
As the cab supply increased, so did the demand which led to almost no change in cab availability during the year Driver-side cancellations saw a decrease in 2016
With the cab aggregators drafting stricter measures for drivers, driver-side cancellations reduced during Q2 and Q3 ETA has remained the same over the past year
ETA, reduced with increase in cab supply but saw an increase during the festive season due to high demand ETA (In mins)
(CY16) 1. Rides & GBV Perf. 2. Regulatory Framework 3. Customer Adoption 4.Customer Satisfaction 5.Driver Adoption & Satisfaction 6.Operational Performance 7. Unit Economics Key Takeaways<br>
16
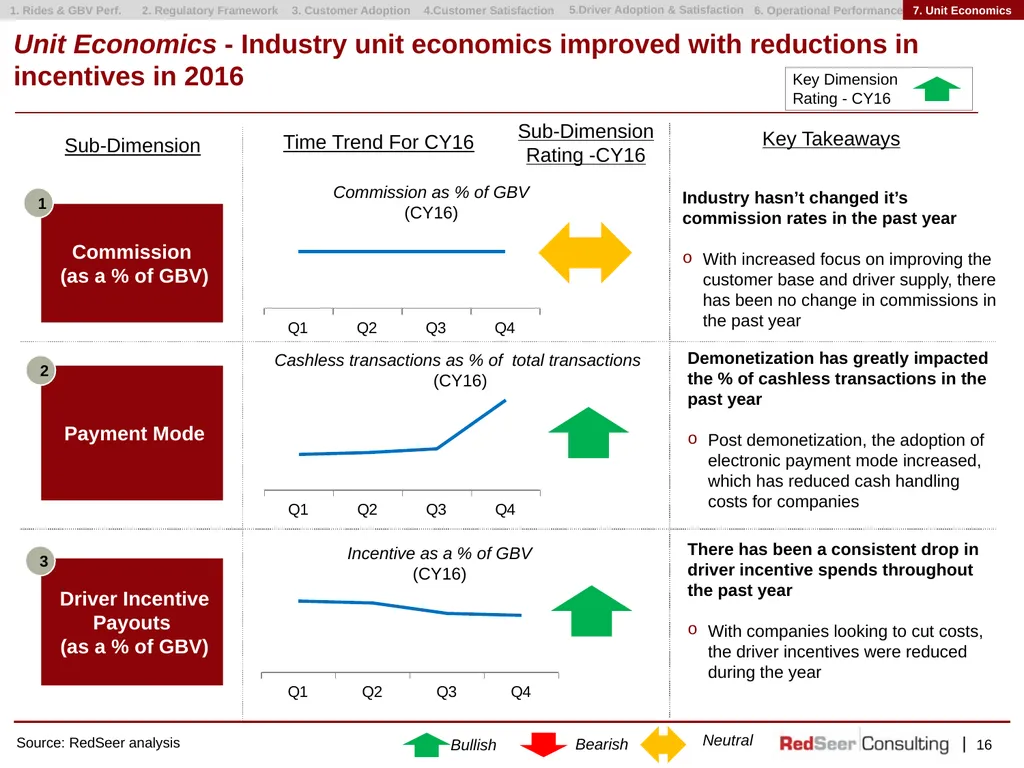
16 Unit Economics - Industry unit economics improved with reductions in incentives in 2016 Source: RedSeer analysis Bearish Bullish Neutral Key Dimension Rating - CY16 Payment Mode Driver Incentive Payouts
(as a % of GBV) 1 2 3 Sub-Dimension Sub-Dimension Rating -CY16 Commission as % of GBV
(CY16) Time Trend For CY16 Cashless transactions as % of total transactions
(CY16) Industry hasn’t changed it’s commission rates in the past year
With increased focus on improving the customer base and driver supply, there has been no change in commissions in the past year Key Takeaways There has been a consistent drop in driver incentive spends throughout the past year
With companies looking to cut costs, the driver incentives were reduced during the year Demonetization has greatly impacted the % of cashless transactions in the past year
Post demonetization, the adoption of electronic payment mode increased, which has reduced cash handling costs for companies 1. Rides & GBV Perf. 2. Regulatory Framework 3. Customer Adoption 4.Customer Satisfaction 5.Driver Adoption & Satisfaction 6. Operational Performance 7. Unit Economics Incentive as a % of GBV
(CY16)<br>
17
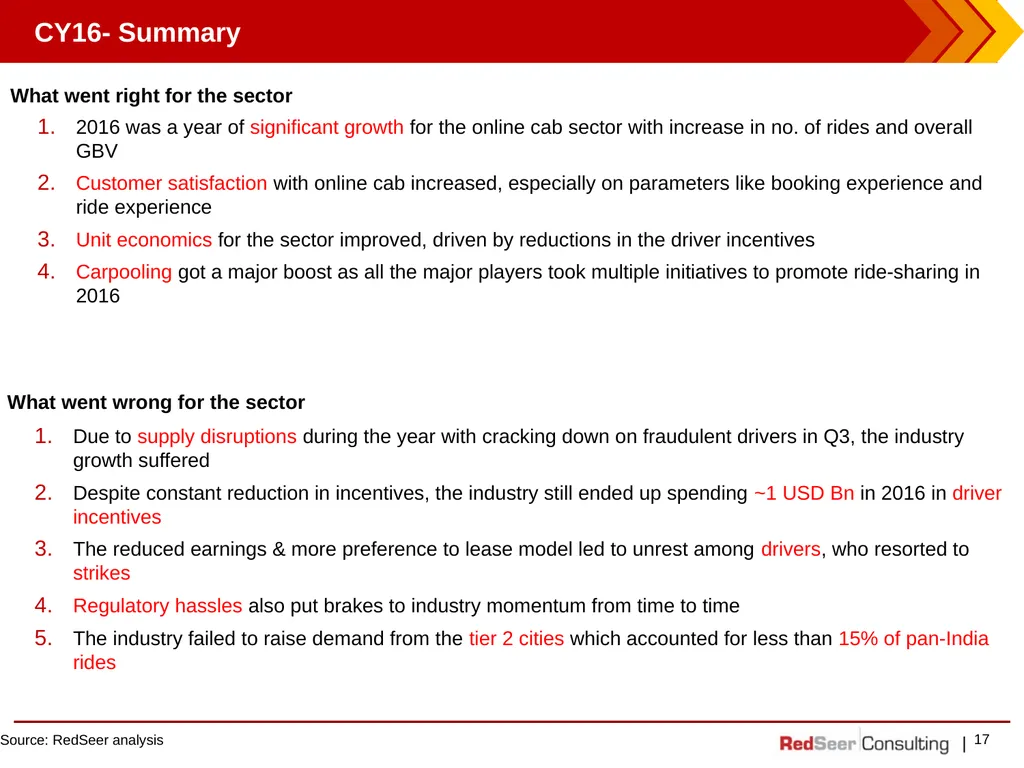
Key Highlights- 2016 17 Source: RedSeer analysis 2016 was a year of significant growth for the online cab sector with increase in no. of rides and overall GBV
Customer satisfaction with online cab increased, especially on parameters like booking experience and ride experience
Unit economics for the sector improved, driven by reductions in the driver incentives
Carpooling got a major boost as all the major players took multiple initiatives to promote ride-sharing in 2016 E-Tailing Industry Performance Score- CY 2016 CY16- Summary What went right for the sector Due to supply disruptions during the year with cracking down on fraudulent drivers in Q3, the industry growth suffered
Despite constant reduction in incentives, the industry still ended up spending ~1 USD Bn in 2016 in driver incentives
The reduced earnings & more preference to lease model led to unrest among drivers, who resorted to strikes
Regulatory hassles also put brakes to industry momentum from time to time
The industry failed to raise demand from the tier 2 cities which accounted for less than 15% of pan-India rides What went wrong for the sector<br>
18
Agenda 18<br>
19
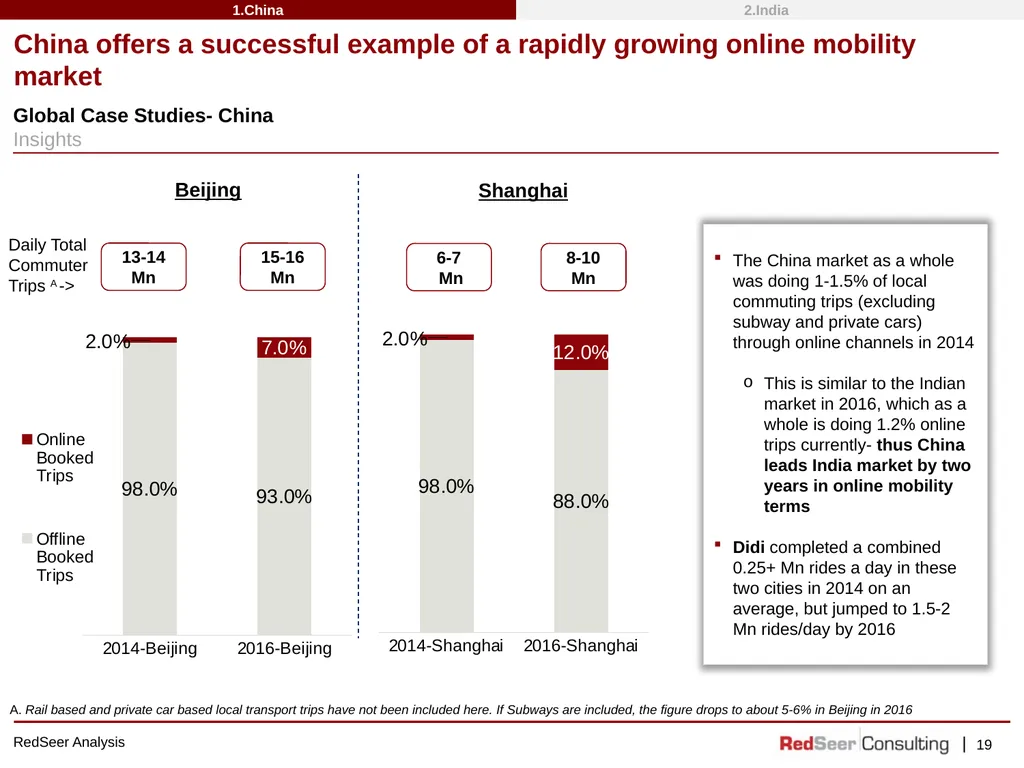
19 China offers a successful example of a rapidly growing online mobility market RedSeer Analysis Daily Total Commuter Trips A -> 13-14 Mn 15-16 Mn A. Rail based and private car based local transport trips have not been included here. If Subways are included, the figure drops to about 5-6% in Beijing in 2016 6-7
Mn 8-10 Mn The China market as a whole was doing 1-1.5% of local commuting trips (excluding subway and private cars) through online channels in 2014
This is similar to the Indian market in 2016, which as a whole is doing 1.2% online trips currently- thus China leads India market by two years in online mobility terms
Didi completed a combined 0.25+ Mn rides a day in these two cities in 2014 on an average, but jumped to 1.5-2 Mn rides/day by 2016 Beijing Shanghai<br>
20
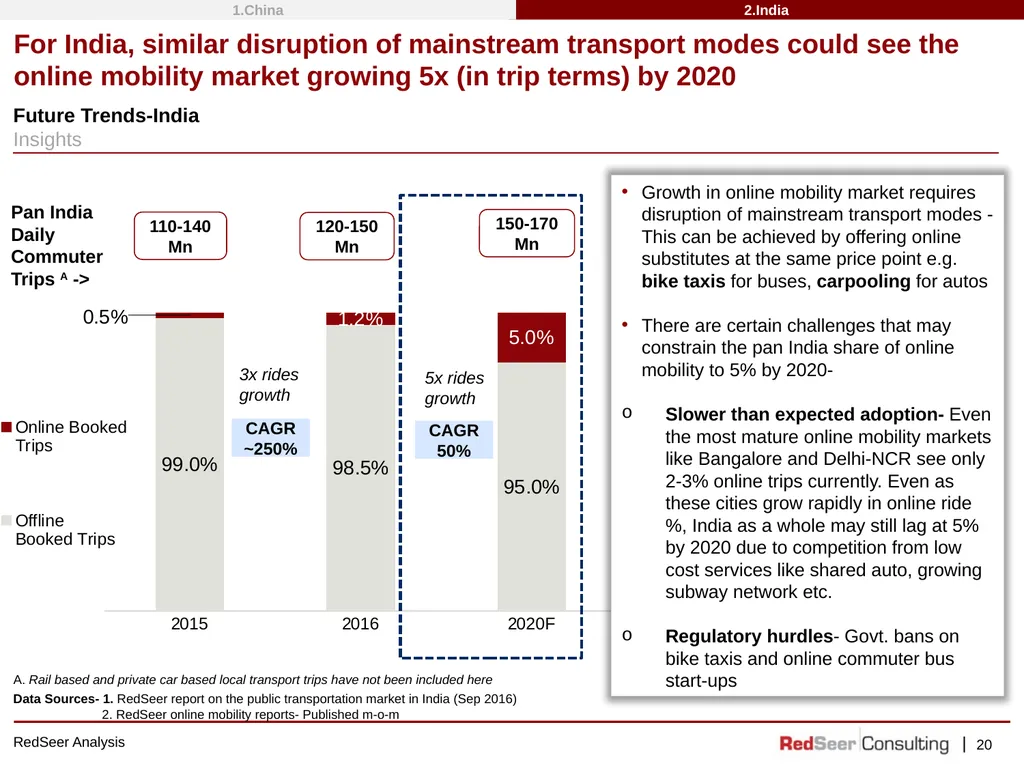
20 For India, similar disruption of mainstream transport modes could see the online mobility market growing 5x (in trip terms) by 2020 RedSeer Analysis Pan India Daily Commuter Trips A -> 110-140 Mn 150-170 Mn 120-150 Mn A. Rail based and private car based local transport trips have not been included here Data Sources- 1. RedSeer report on the public transportation market in India (Sep 2016)
2. RedSeer online mobility reports- Published m-o-m Growth in online mobility market requires disruption of mainstream transport modes - This can be achieved by offering online substitutes at the same price point e.g. bike taxis for buses, carpooling for autos
There are certain challenges that may constrain the pan India share of online mobility to 5% by 2020-
Slower than expected adoption- Even the most mature online mobility markets like Bangalore and Delhi-NCR see only 2-3% online trips currently. Even as these cities grow rapidly in online ride %, India as a whole may still lag at 5% by 2020 due to competition from low cost services like shared auto, growing subway network etc.
Regulatory hurdles- Govt. bans on bike taxis and online commuter bus start-ups 5x rides growth CAGR 50% 3x rides growth CAGR ~250%<br>
21
Agenda 21<br>
22
22 For RedSeer Offerings please write to us at v@redseerconsulting.com<br>
23
Flexible in Approach, Firm on Results 23 Bangalore HQ:
Indiqube Sigma,
Plot 3/B, 7th C Main,
3rd Block Koramangala,
Bangalore - 560034 Mumbai Office:
25/b 4th Floor
Usha Sadan
Near Colaba PO, Colaba
Mumbai - 400005 Dubai Office:
42Seer Technologies FZE
G-D-Flex G089 C-Thub
Dubai Silicon Oasis,
Dubai, UAE Delhi Office:
INHWA Business Center
Sector 48, Sohana Road
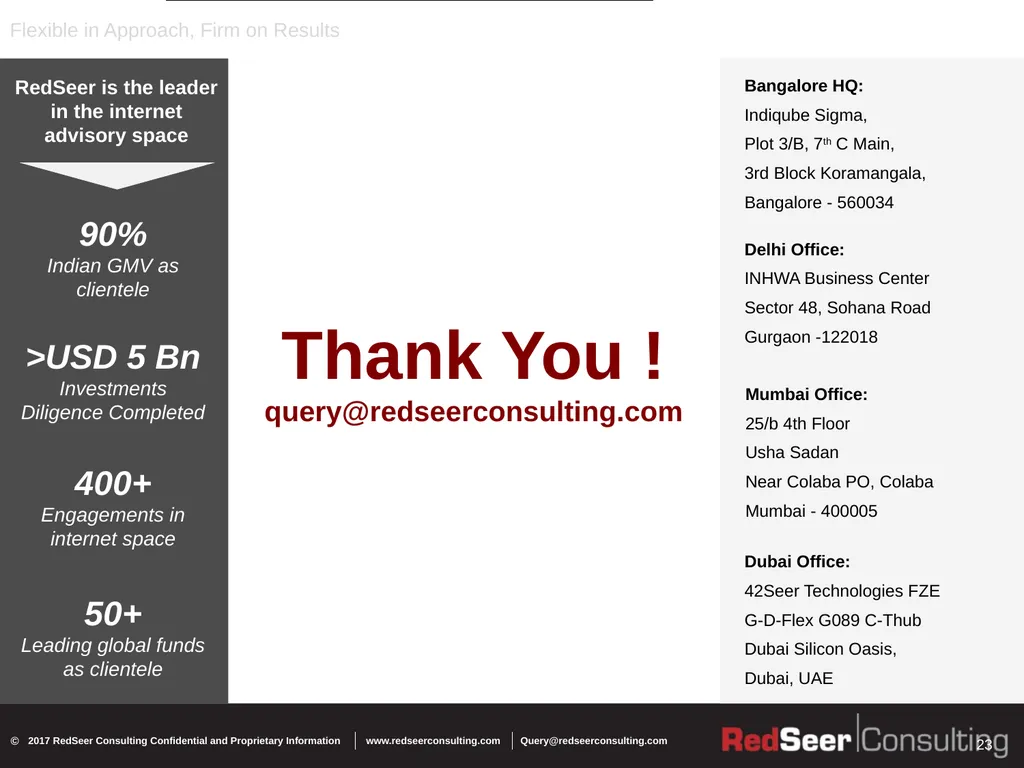
Gurgaon -122018 RedSeer is the leader in the internet advisory space 90% Indian GMV as clientele >USD 5 Bn
Investments Diligence Completed 400+
Engagements in internet space 50+
Leading global funds as clientele<br>