04
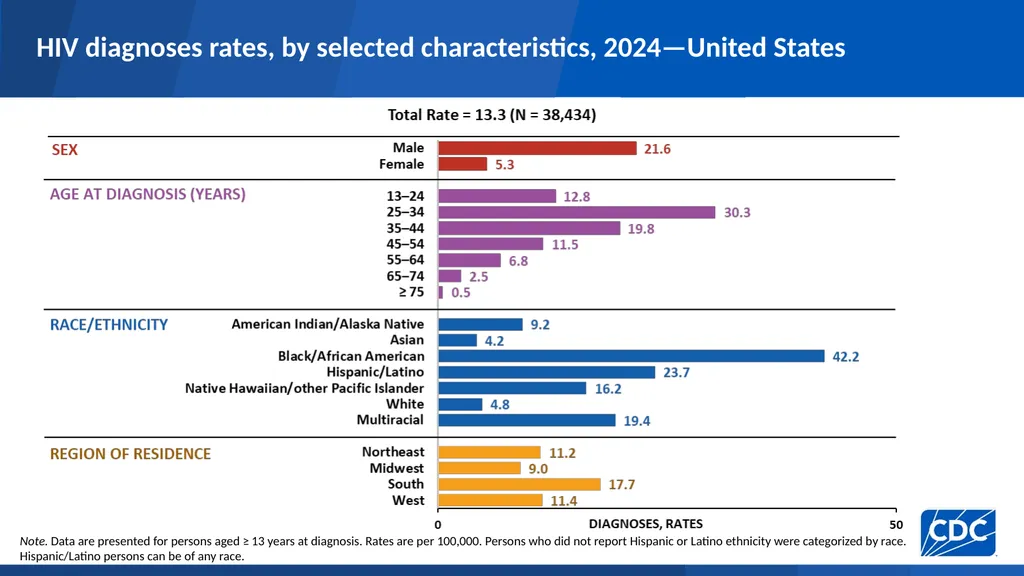
HIV diagnoses, by sex, 2024—United States and 7 territories and freely associated states Note. Data are presented for persons aged ≥ 13 years at diagnosis.<br>
05
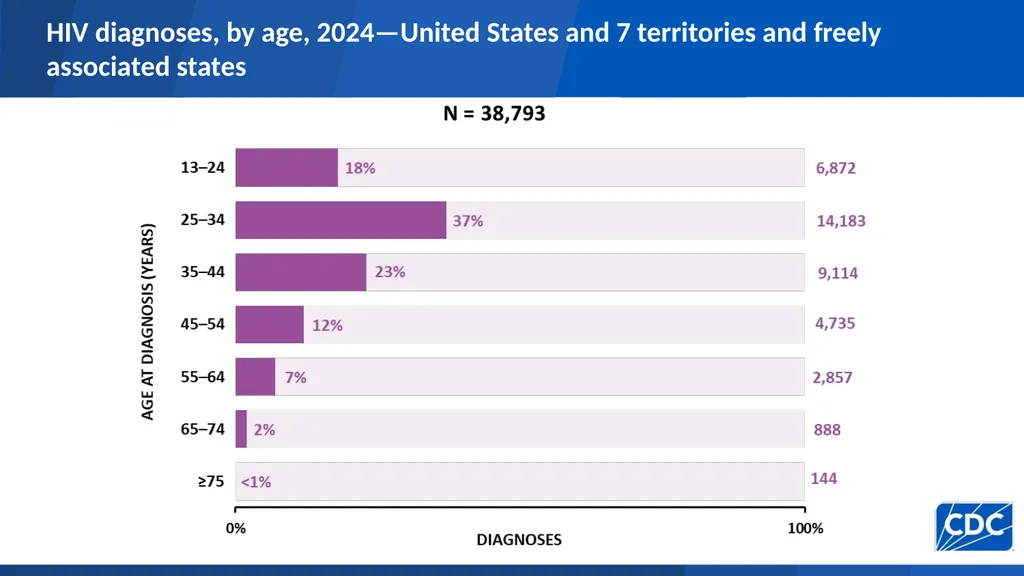
HIV diagnoses, by age, 2024—United States and 7 territories and freely associated states<br>
06
HIV diagnoses, by race/ethnicity, 2024—United States and 7 territories and freely associated states Note. Data are presented for persons aged ≥ 13 years at diagnosis. Persons who did not report Hispanic or Latino ethnicity were categorized by race. Hispanic/Latino persons can be of any race.<br>
07
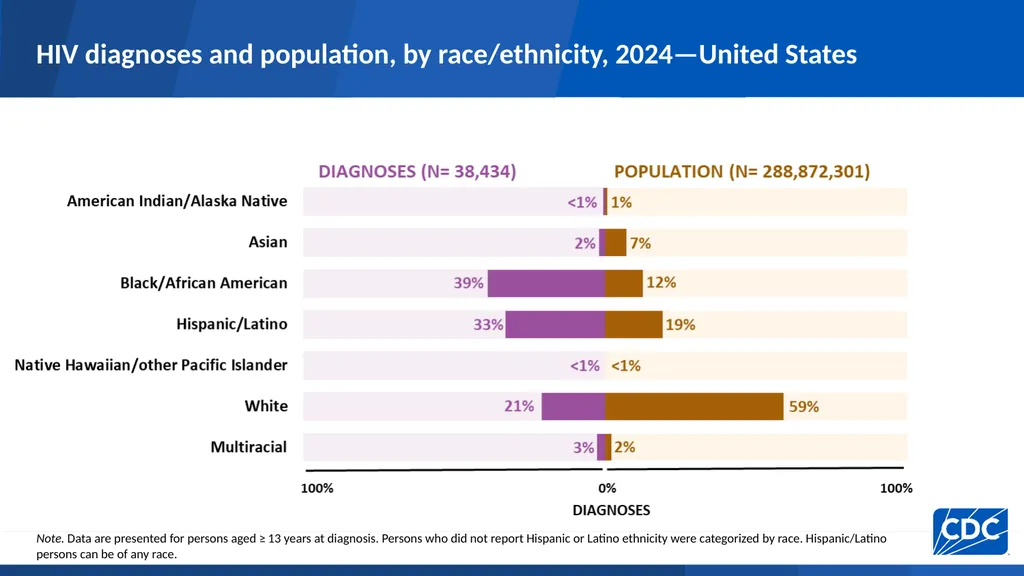
HIV diagnoses and population, by race/ethnicity, 2024—United States Note. Data are presented for persons aged ≥ 13 years at diagnosis. Persons who did not report Hispanic or Latino ethnicity were categorized by race. Hispanic/Latino persons can be of any race.<br>
08
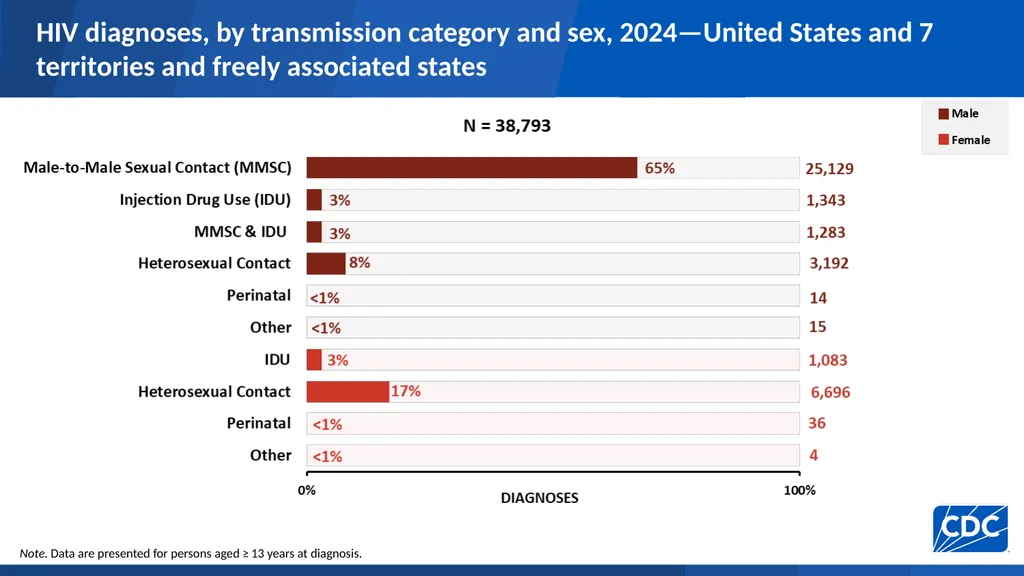
HIV diagnoses, by transmission category and sex, 2024—United States and 7 territories and freely associated states Note. Data are presented for persons aged ≥ 13 years at diagnosis.<br>
09
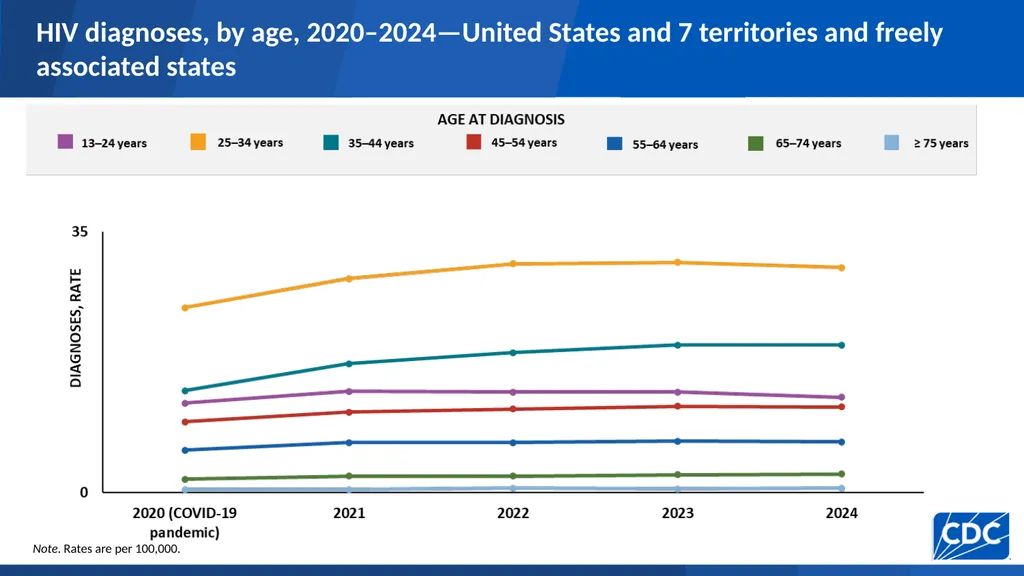
HIV diagnoses, by age, 2020–2024—United States and 7 territories and freely associated states Note. Rates are per 100,000.<br>
10
HIV diagnoses, by race/ethnicity, 2020–2024—United States and 7 territories and freely associated states Note. Data are presented for persons aged ≥ 13 years at diagnosis. Persons who did not report Hispanic or Latino ethnicity were categorized by race. Hispanic/Latino persons can be of any race.<br>
11
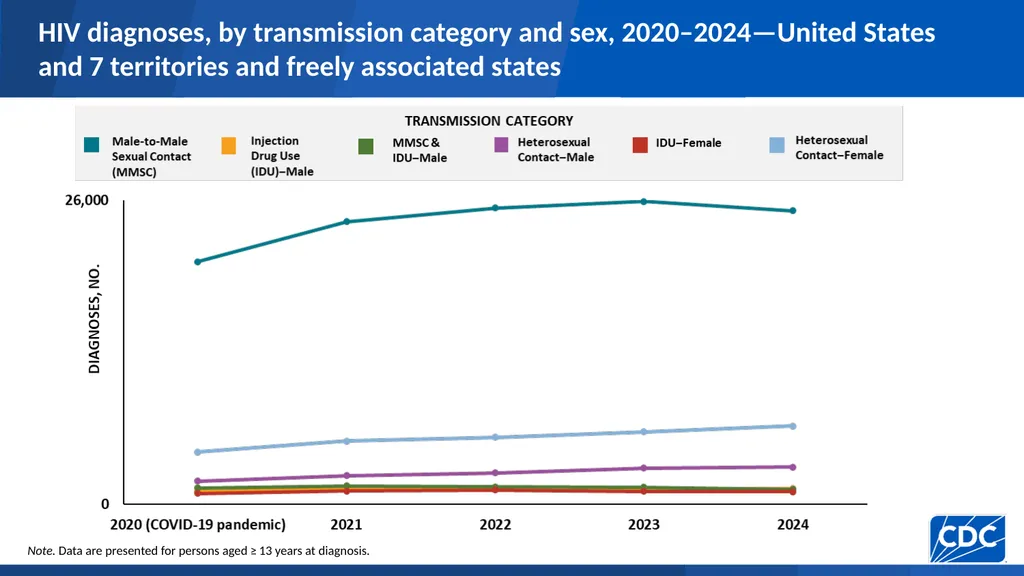
HIV diagnoses, by transmission category and sex, 2020–2024—United States and 7 territories and freely associated states Note. Data are presented for persons aged ≥ 13 years at diagnosis.<br>
12
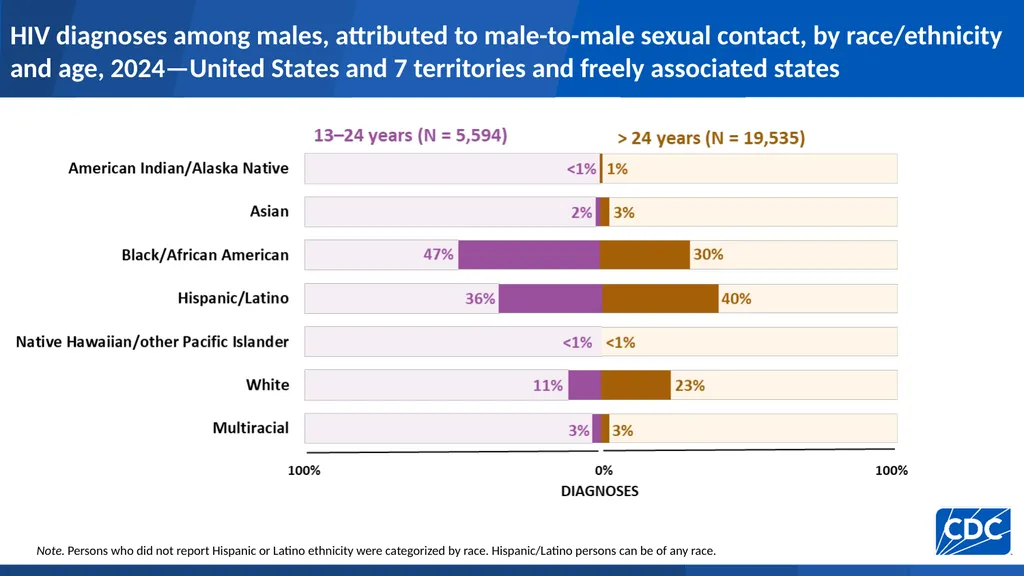
HIV diagnoses among males, attributed to male-to-male sexual contact, by race/ethnicity and age, 2024—United States and 7 territories and freely associated states Note. Persons who did not report Hispanic or Latino ethnicity were categorized by race. Hispanic/Latino persons can be of any race.<br>
13
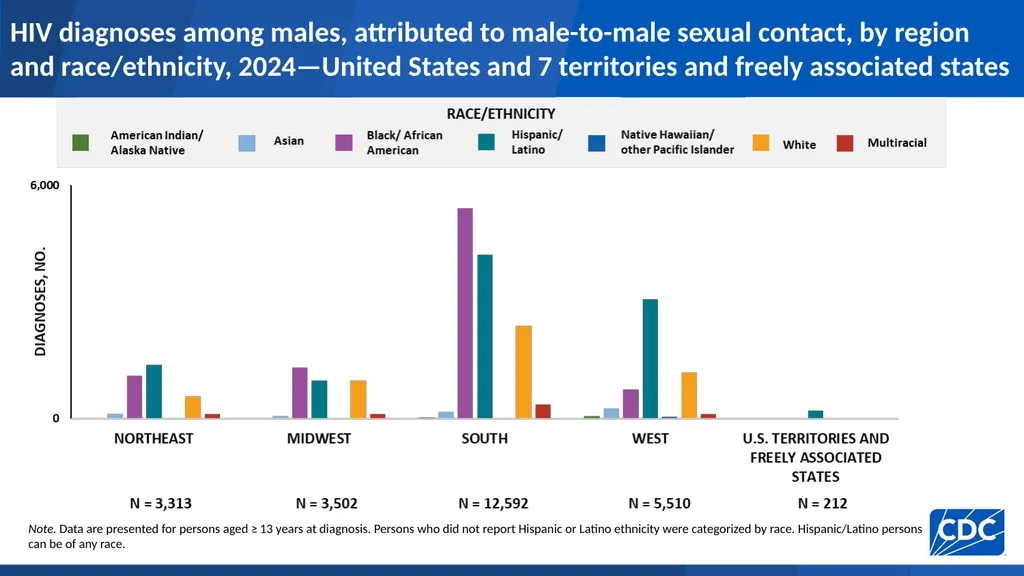
HIV diagnoses among males, attributed to male-to-male sexual contact, by region and race/ethnicity, 2024—United States and 7 territories and freely associated states Note. Data are presented for persons aged ≥ 13 years at diagnosis. Persons who did not report Hispanic or Latino ethnicity were categorized by race. Hispanic/Latino persons can be of any race.<br>
14
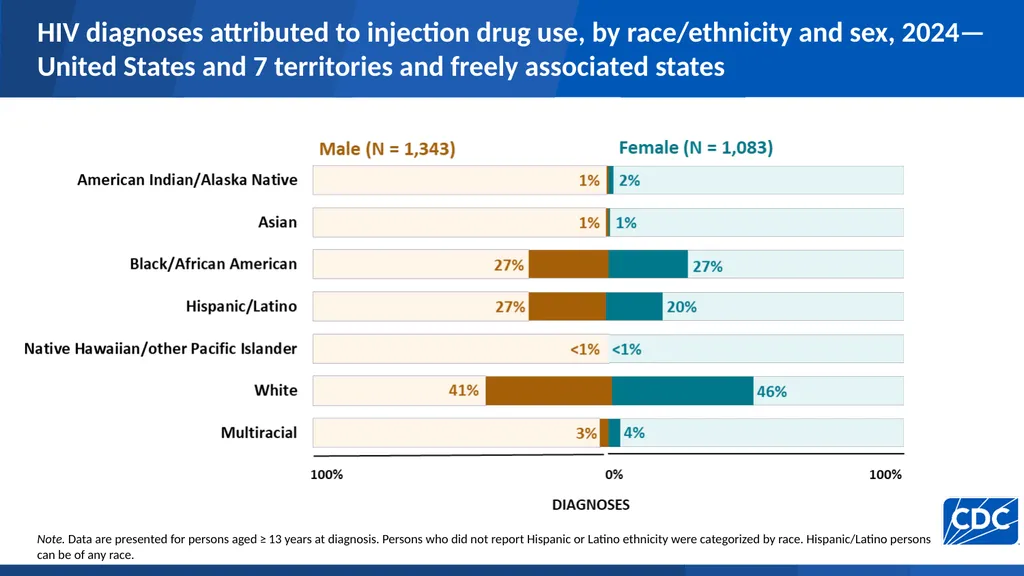
HIV diagnoses attributed to injection drug use, by race/ethnicity and sex, 2024—United States and 7 territories and freely associated states Note. Data are presented for persons aged ≥ 13 years at diagnosis. Persons who did not report Hispanic or Latino ethnicity were categorized by race. Hispanic/Latino persons can be of any race.<br>
15
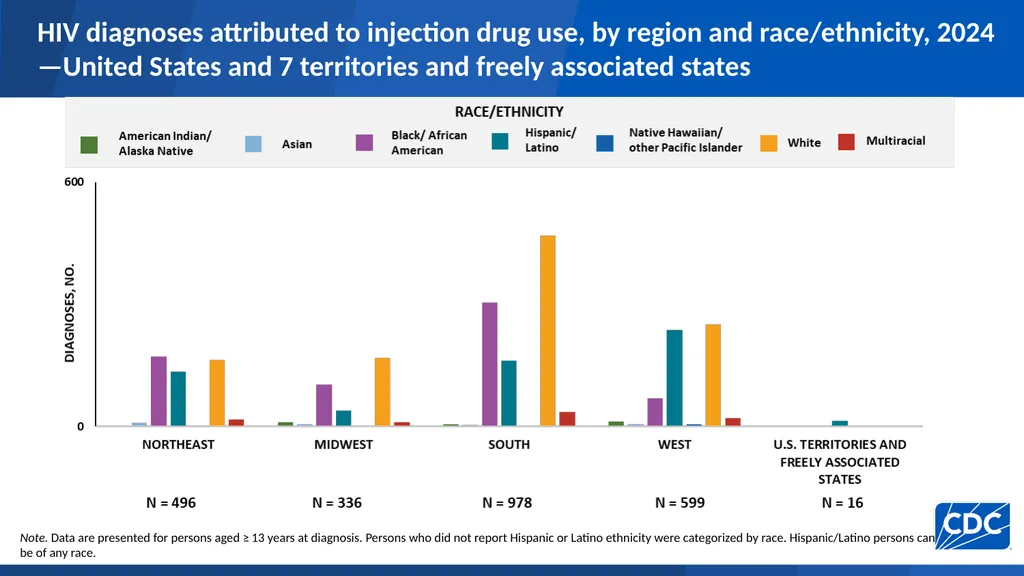
HIV diagnoses attributed to injection drug use, by region and race/ethnicity, 2024—United States and 7 territories and freely associated states Note. Data are presented for persons aged ≥ 13 years at diagnosis. Persons who did not report Hispanic or Latino ethnicity were categorized by race. Hispanic/Latino persons can be of any race.<br>
16
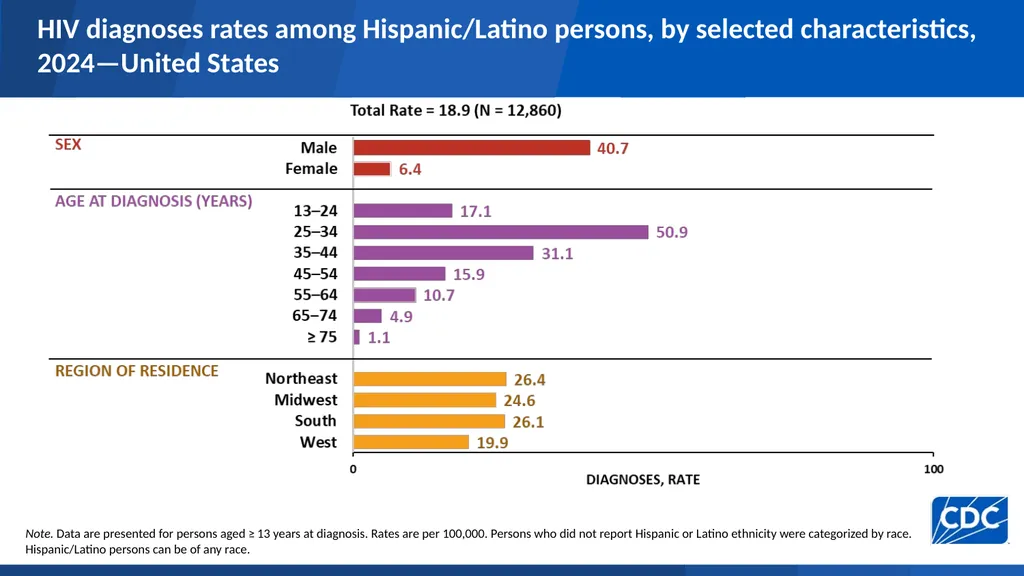
HIV diagnoses rates among Hispanic/Latino persons, by selected characteristics, 2024—United States Note. Data are presented for persons aged ≥ 13 years at diagnosis. Rates are per 100,000. Persons who did not report Hispanic or Latino ethnicity were categorized by race. Hispanic/Latino persons can be of any race.<br>
17
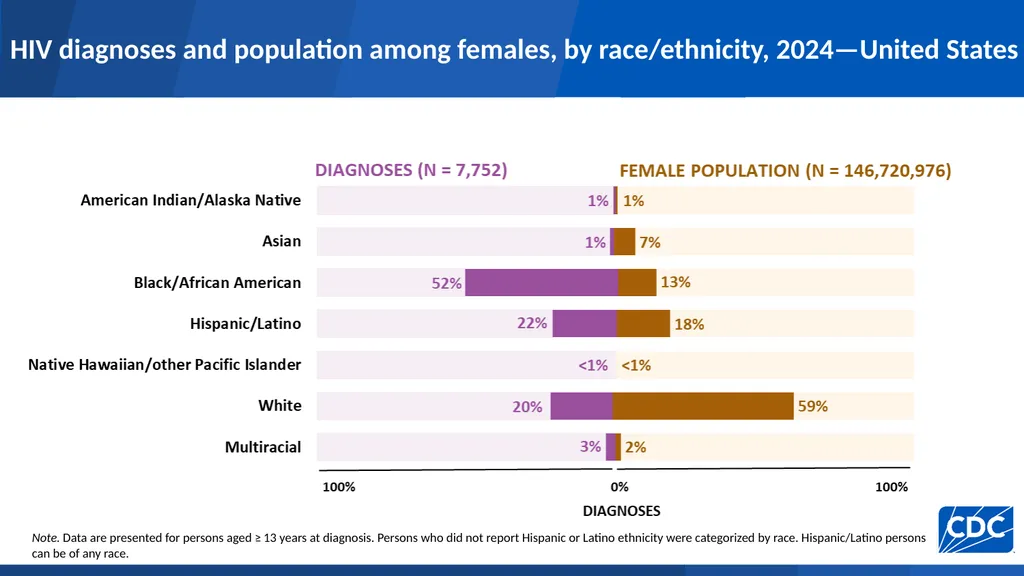
HIV diagnoses and population among females, by race/ethnicity, 2024—United States Note. Data are presented for persons aged ≥ 13 years at diagnosis. Persons who did not report Hispanic or Latino ethnicity were categorized by race. Hispanic/Latino persons can be of any race.<br>
18
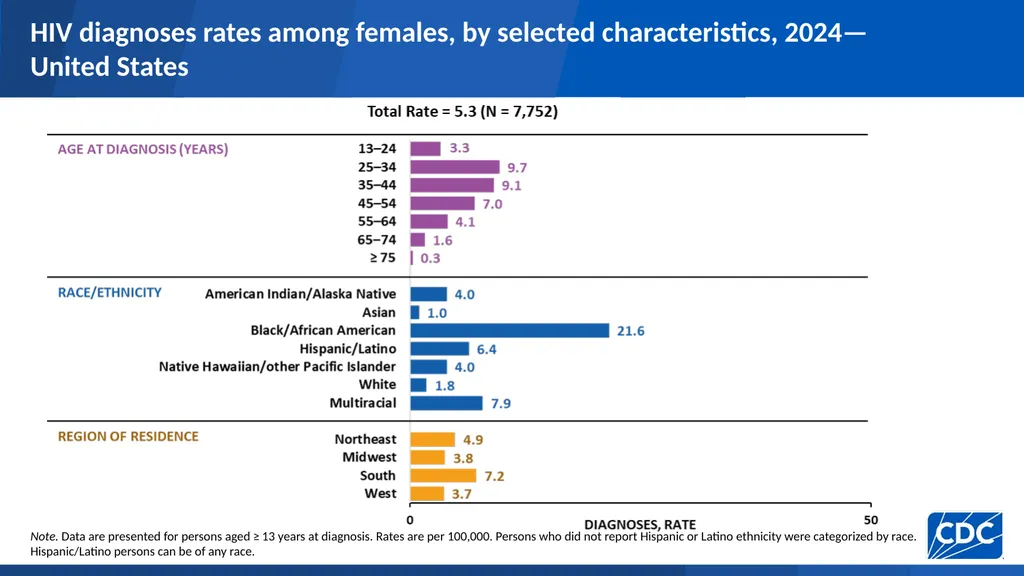
HIV diagnoses rates among females, by selected characteristics, 2024—United States Note. Data are presented for persons aged ≥ 13 years at diagnosis. Rates are per 100,000. Persons who did not report Hispanic or Latino ethnicity were categorized by race. Hispanic/Latino persons can be of any race.<br>
19
HIV diagnoses rates among Black females, by selected characteristics, 2024—United States Note. Data are presented for persons aged ≥ 13 years at diagnosis. Rates are per 100,000.<br>
20
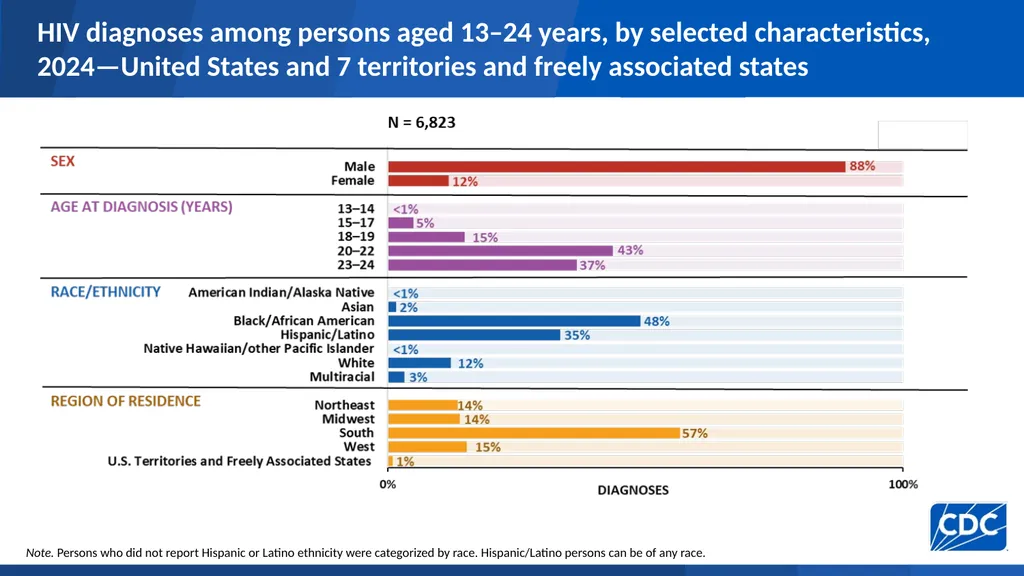
HIV diagnoses among persons aged 13–24 years, by selected characteristics, 2024—United States and 7 territories and freely associated states Note. Persons who did not report Hispanic or Latino ethnicity were categorized by race. Hispanic/Latino persons can be of any race.<br>
21
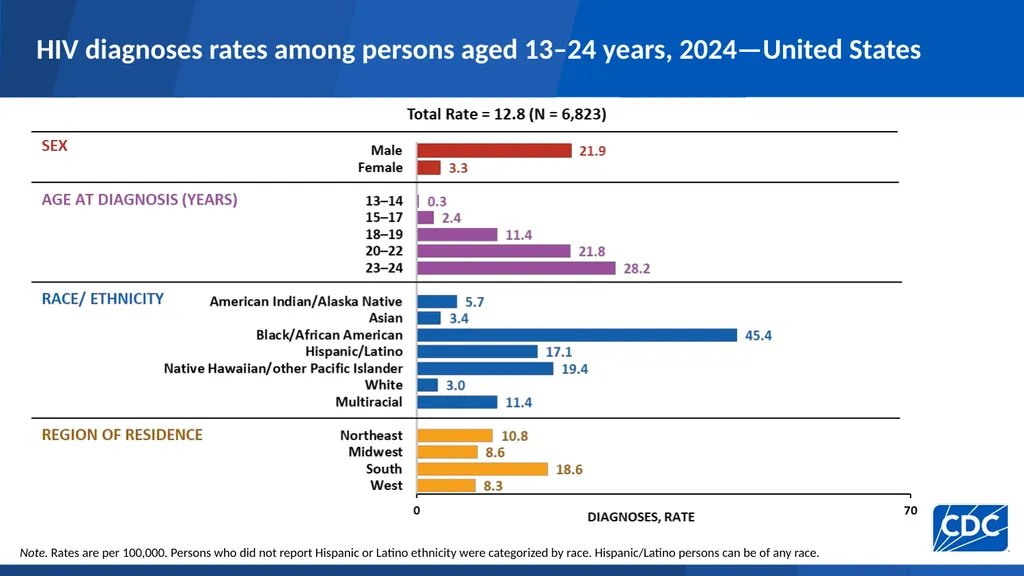
HIV diagnoses rates among persons aged 13–24 years, 2024—United States Note. Rates are per 100,000. Persons who did not report Hispanic or Latino ethnicity were categorized by race. Hispanic/Latino persons can be of any race.<br>
22
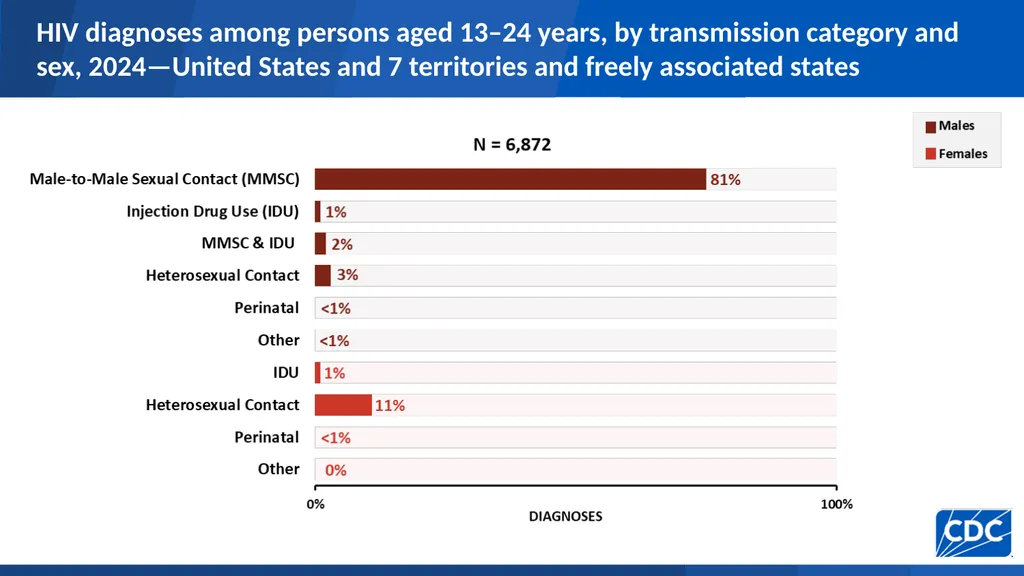
HIV diagnoses among persons aged 13–24 years, by transmission category and sex, 2024—United States and 7 territories and freely associated states<br>
23
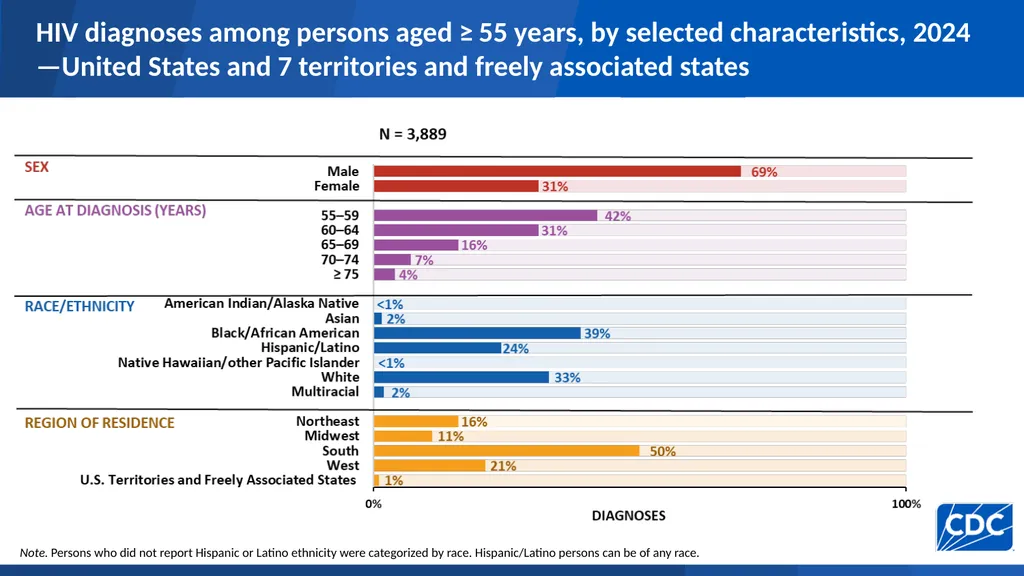
HIV diagnoses among persons aged ≥ 55 years, by selected characteristics, 2024—United States and 7 territories and freely associated states Note. Persons who did not report Hispanic or Latino ethnicity were categorized by race. Hispanic/Latino persons can be of any race.<br>
24
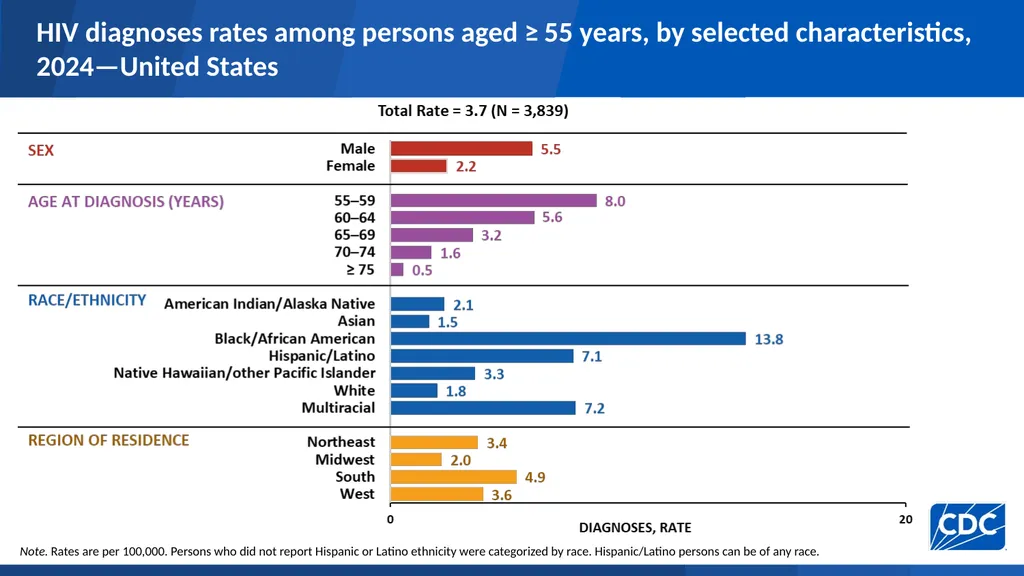
HIV diagnoses rates among persons aged ≥ 55 years, by selected characteristics, 2024—United States Note. Rates are per 100,000. Persons who did not report Hispanic or Latino ethnicity were categorized by race. Hispanic/Latino persons can be of any race.<br>
25
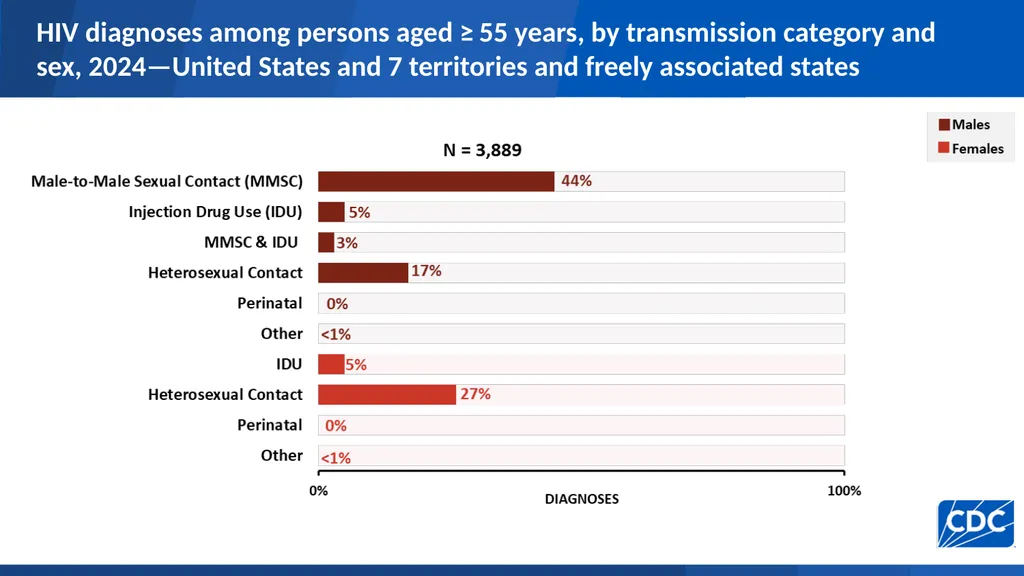
HIV diagnoses among persons aged ≥ 55 years, by transmission category and sex, 2024—United States and 7 territories and freely associated states<br>
26
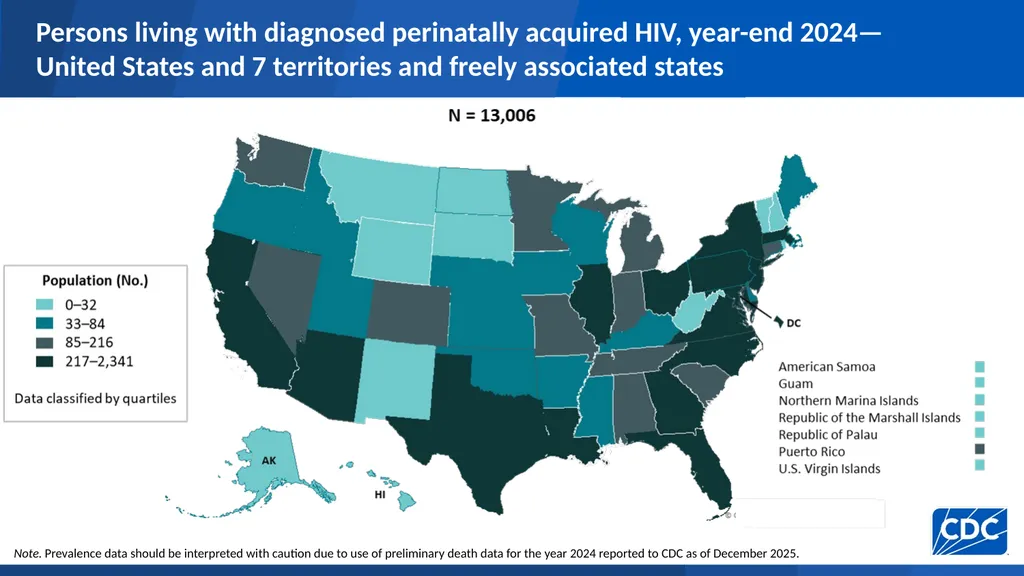
Persons living with diagnosed perinatally acquired HIV, year-end 2024—United States and 7 territories and freely associated states Note. Prevalence data should be interpreted with caution due to use of preliminary death data for the year 2024 reported to CDC as of December 2025.<br>
27
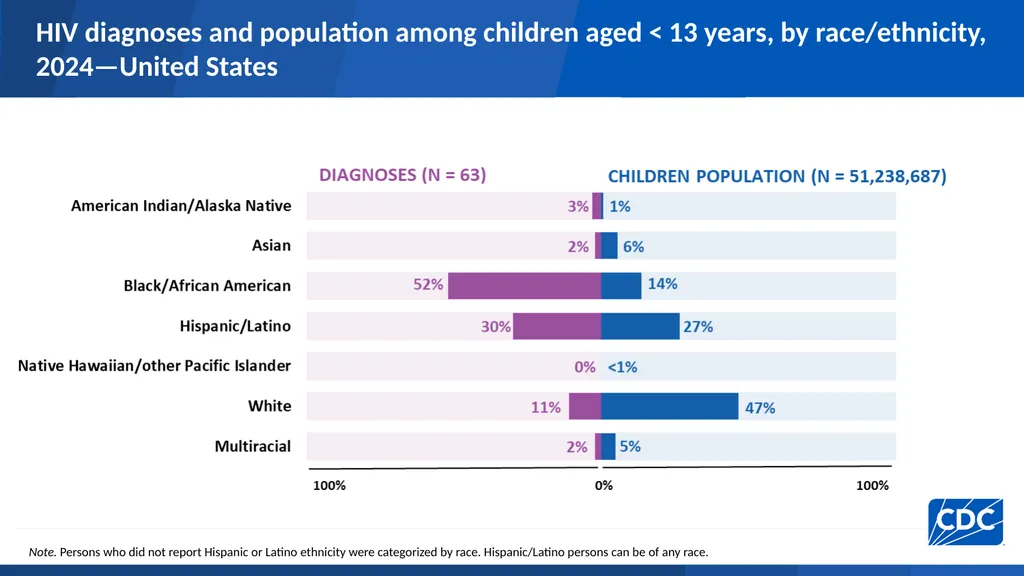
HIV diagnoses and population among children aged < 13 years, by race/ethnicity, 2024—United States Note. Persons who did not report Hispanic or Latino ethnicity were categorized by race. Hispanic/Latino persons can be of any race.<br>
28
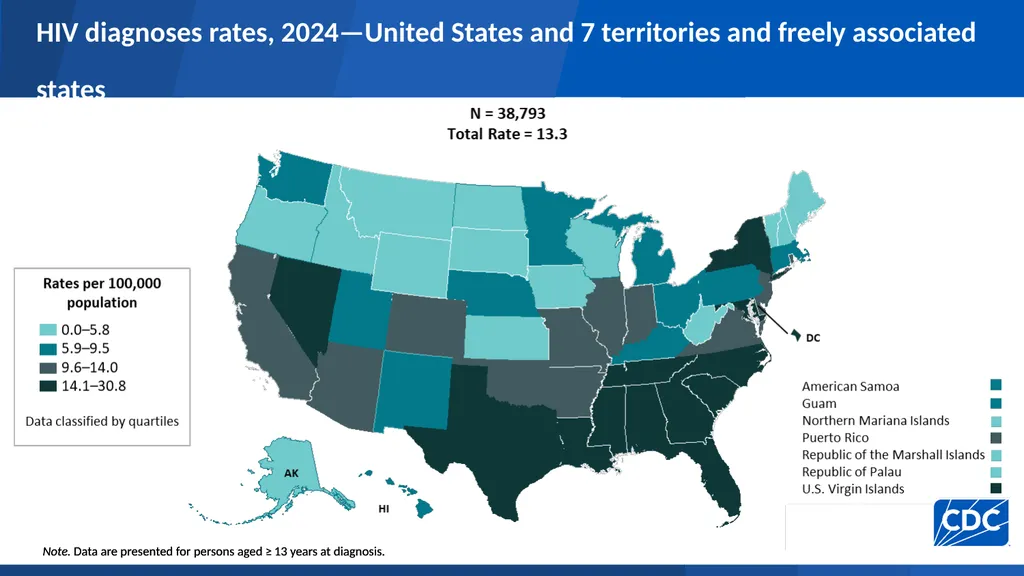
HIV diagnoses rates, by region, 2024—United States and 7 territories and freely associated states Note. Rates are per 100,000. Data are presented for persons aged ≥ 13 years at diagnosis.<br>
29
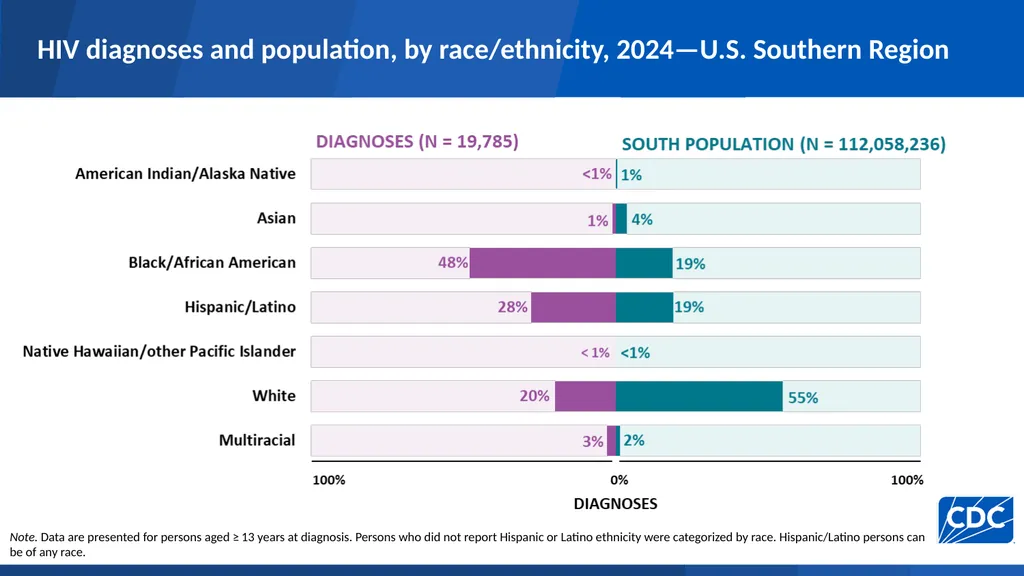
HIV diagnoses and population, by race/ethnicity, 2024—U.S. Southern Region Note. Data are presented for persons aged ≥ 13 years at diagnosis. Persons who did not report Hispanic or Latino ethnicity were categorized by race. Hispanic/Latino persons can be of any race.<br>
30
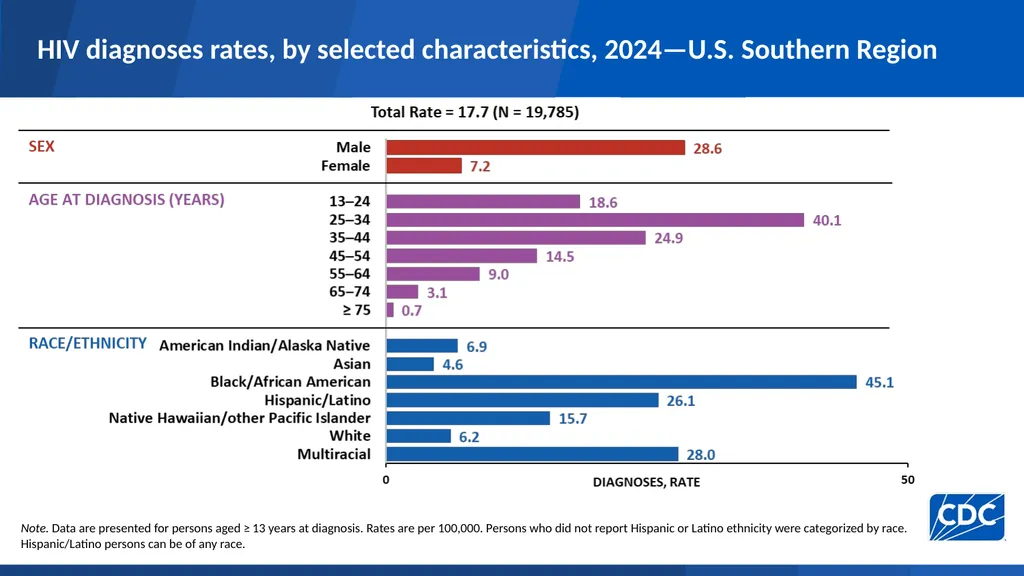
HIV diagnoses rates, by selected characteristics, 2024—U.S. Southern Region Note. Data are presented for persons aged ≥ 13 years at diagnosis. Rates are per 100,000. Persons who did not report Hispanic or Latino ethnicity were categorized by race. Hispanic/Latino persons can be of any race.<br>
32
HIV-related death rates of persons with diagnosed HIV, 2024—United States and 7 territories and freely associated states Note. Data are presented for persons aged ≥ 13 years at death. Rates are per 100,000. Deaths of persons with diagnosed HIV infection are based on residence at death.<br>
33
HIV-related deaths of persons with diagnosed HIV, by selected characteristics, 2024—United States and 7 territories and freely associated states Note. Data are presented for persons aged ≥ 13 years at death. Persons who did not report Hispanic or Latino ethnicity were categorized by race. Hispanic/Latino persons can be of any race.<br>
34
Persons Living with Diagnosed HIV (Diagnosed Prevalence)<br>
35
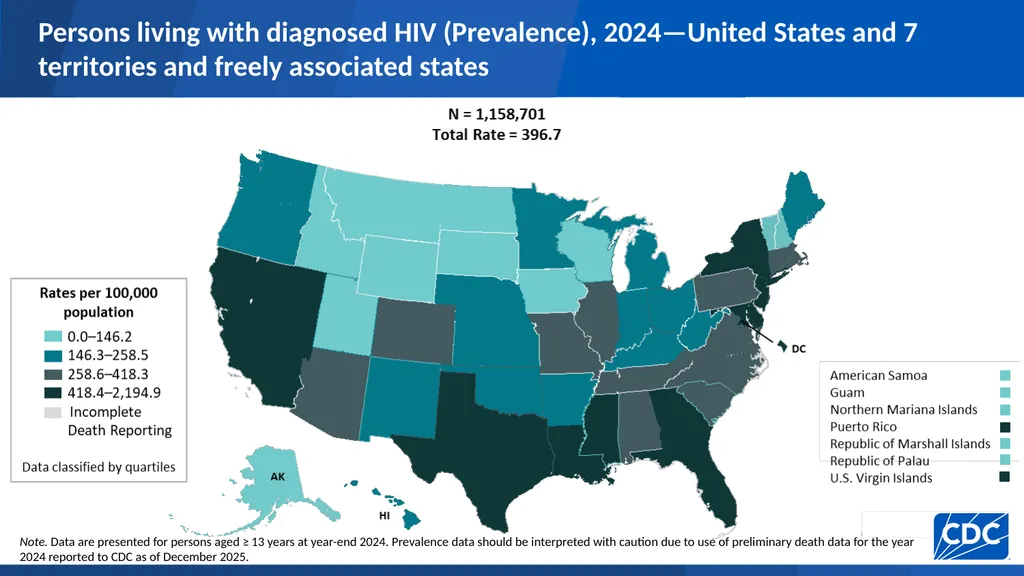
Persons living with diagnosed HIV (Prevalence), 2024—United States and 7 territories and freely associated states Note. Data are presented for persons aged ≥ 13 years at year-end 2024. Prevalence data should be interpreted with caution due to use of preliminary death data for the year 2024 reported to CDC as of December 2025.<br>
36
Persons living with diagnosed HIV (Prevalence), by selected characteristics, 2024—United States and 7 territories and freely associated states Note. Data are presented for persons aged ≥ 13 years at year-end 2024. Persons who did not report Hispanic or Latino ethnicity were categorized by race. Hispanic/Latino persons can be of any race.<br>