Inference of Non-Violent Crime in Chicago Yuejun Wu Violent Crime Homicide Robbery Aggravated Assault Rape Non-Violent Crime THEFT NON-CRIMINAL MOTOR VEHICLE THEFT DECEPTIVE PRACTICE BURGLARY PUBLIC PEACE VIOLATION INTERFERENCE WITH PUBLIC
"Inference of Non-Violent Crime in Chicago Yuejun" is the property of its rightful owner. Permission is granted to
download and print the materials on this website for personal, non-commercial use only, and to display it
on your personal computer provided you do not modify the materials and that you retain all copyright
notices contained in the materials. By downloading content from our website, you accept the terms of this
agreement.
Presentation Transcript
01
Inference of Non-Violent Crime in Chicago Yuejun Wu<br>
02
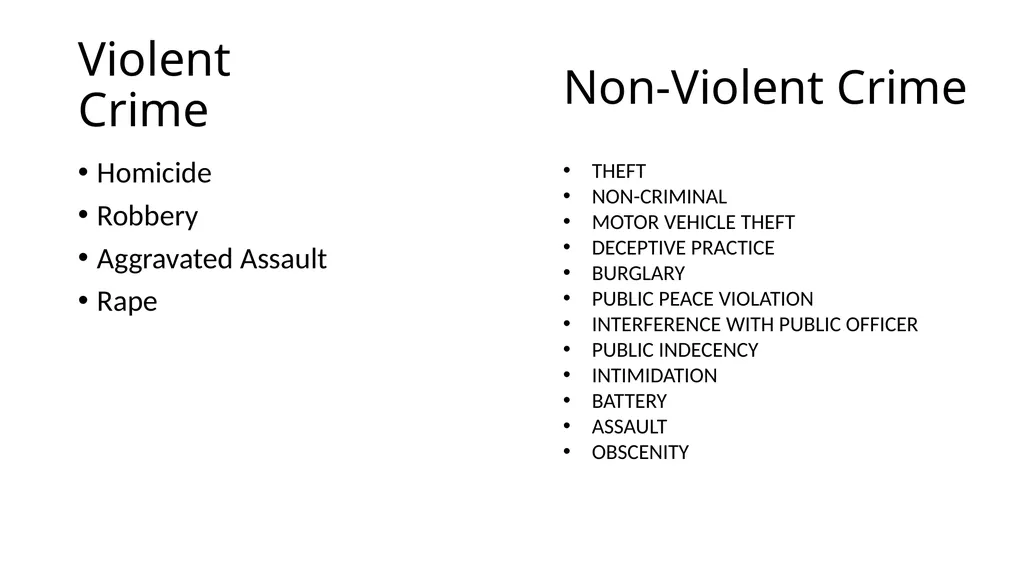
Violent Crime Homicide
Robbery
Aggravated Assault
Rape Non-Violent Crime THEFT
NON-CRIMINAL
MOTOR VEHICLE THEFT
DECEPTIVE PRACTICE
BURGLARY
PUBLIC PEACE VIOLATION
INTERFERENCE WITH PUBLIC OFFICER
PUBLIC INDECENCY
INTIMIDATION
BATTERY
ASSAULT
OBSCENITY<br>
03
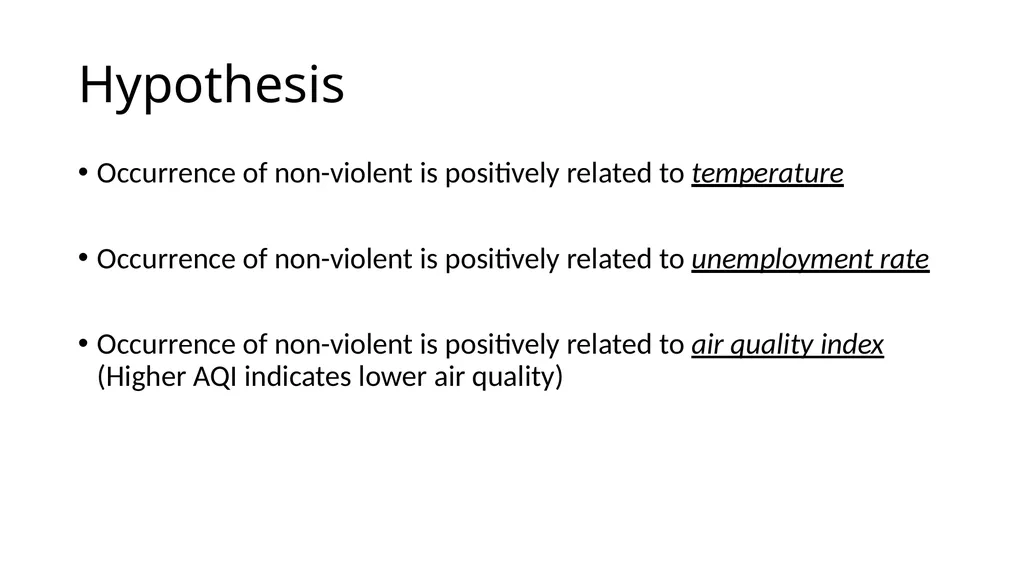
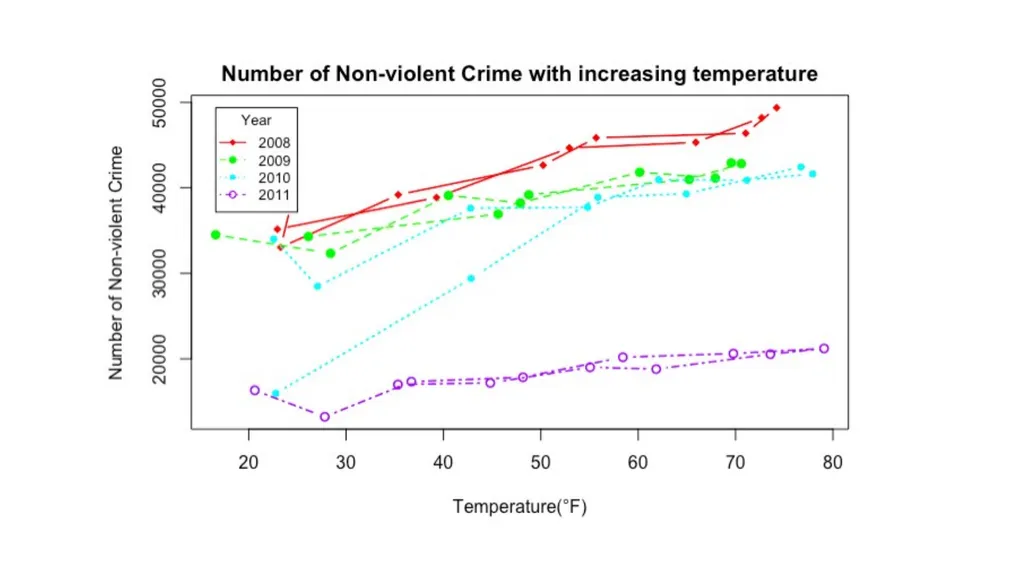
Hypothesis Occurrence of non-violent is positively related to temperature
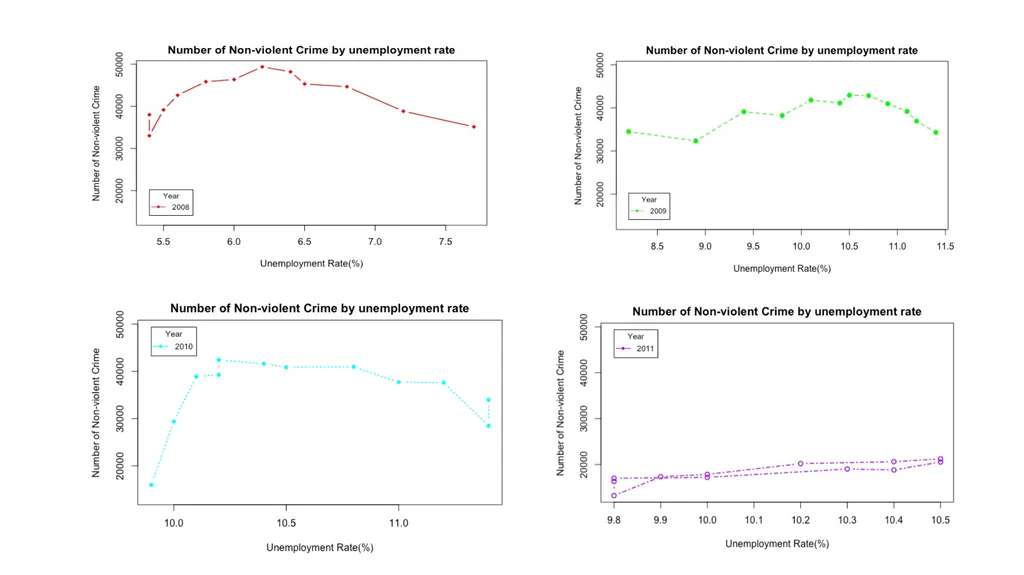
Occurrence of non-violent is positively related to unemployment rate
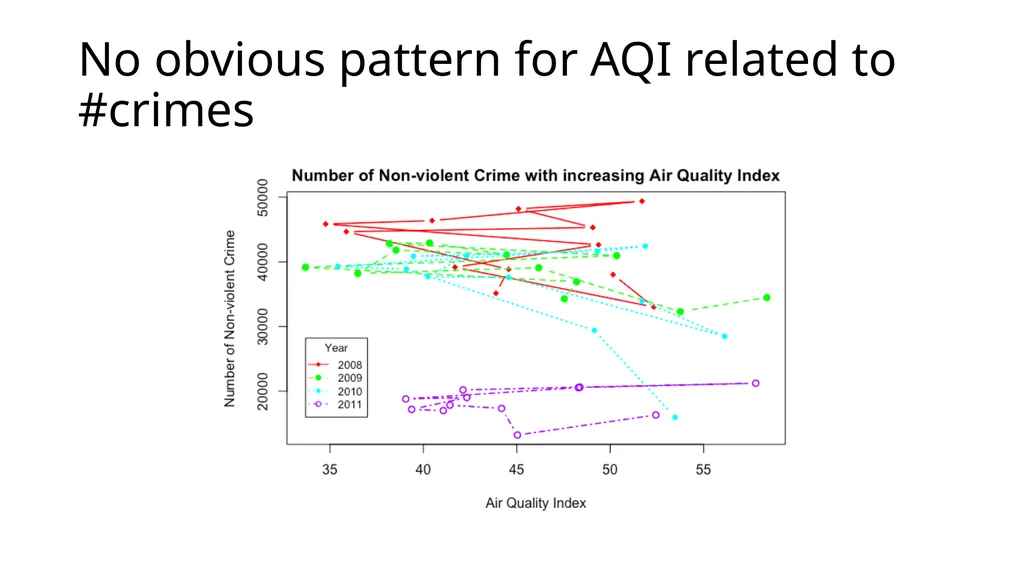
Occurrence of non-violent is positively related to air quality index (Higher AQI indicates lower air quality)<br>
04
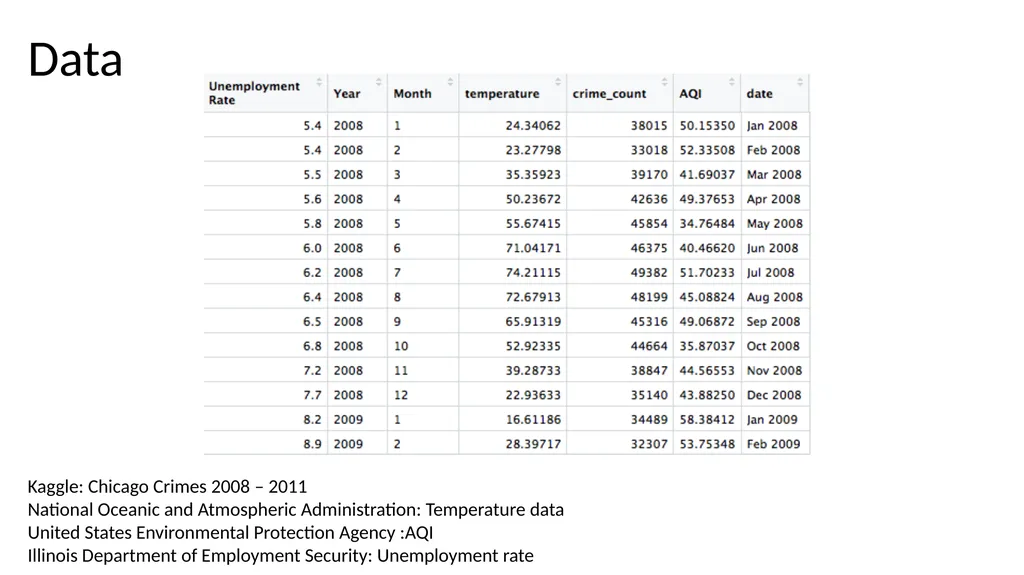
Data Kaggle: Chicago Crimes 2008 – 2011
National Oceanic and Atmospheric Administration: Temperature data
United States Environmental Protection Agency :AQI
Illinois Department of Employment Security: Unemployment rate<br>
05
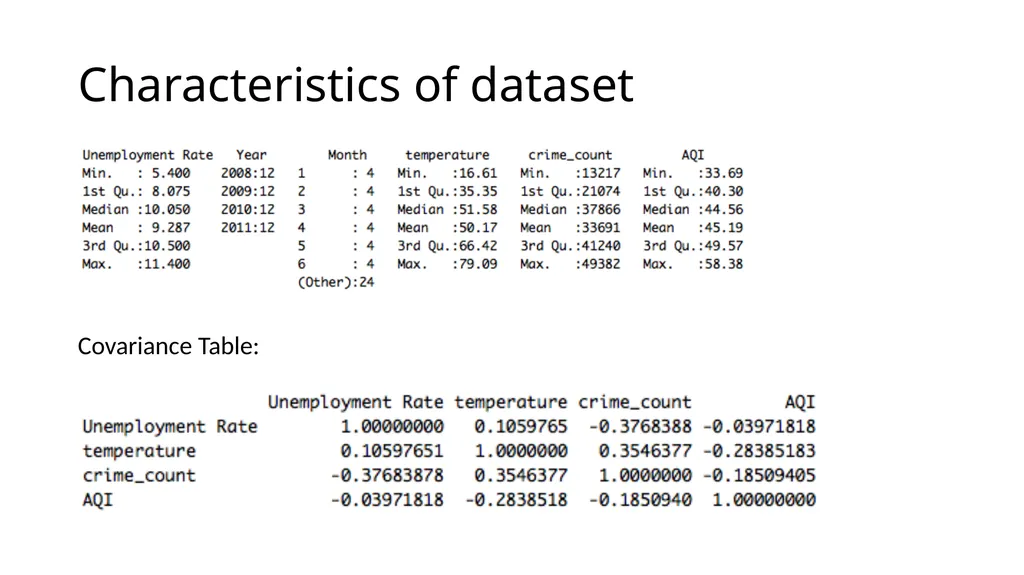
Characteristics of dataset Covariance Table:<br>
06
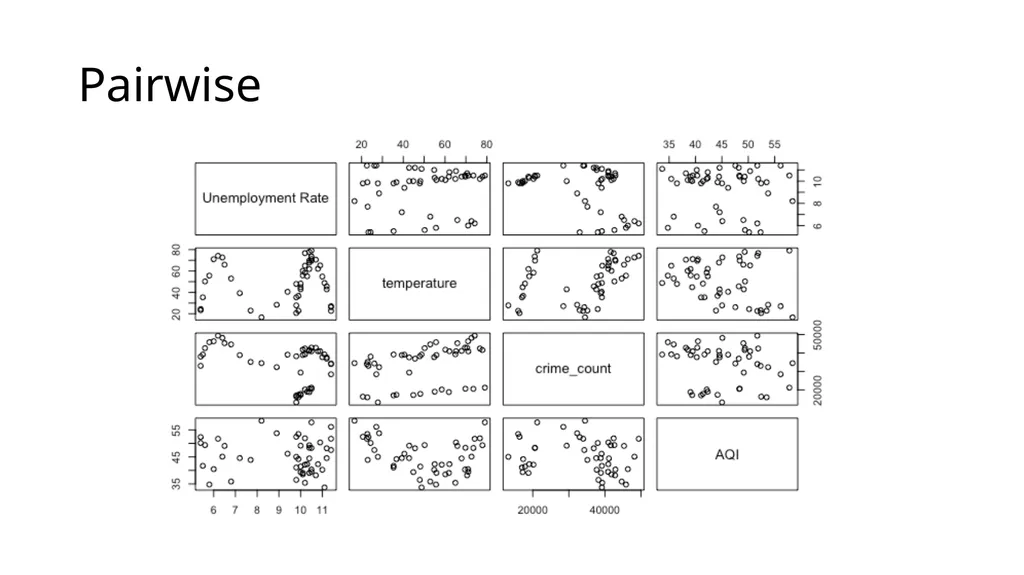
Pairwise<br>
07
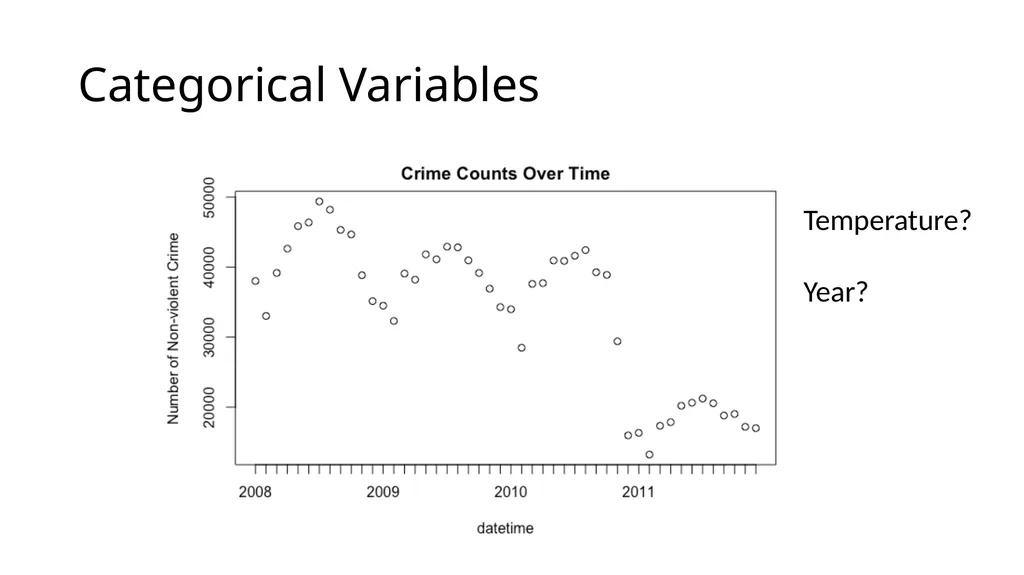
Categorical Variables Temperature?
Year?<br>
08
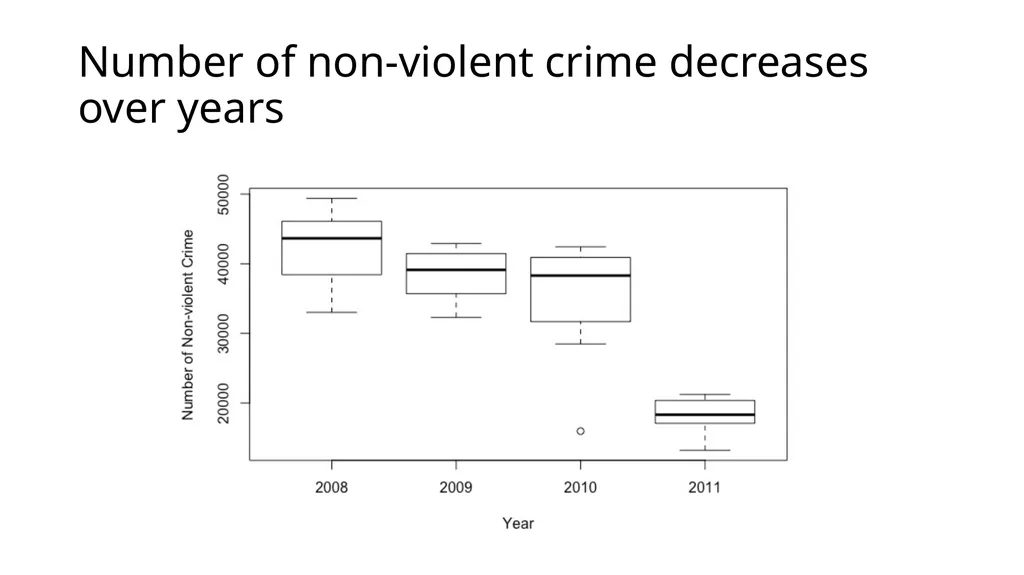
Number of non-violent crime decreases over years<br>
09
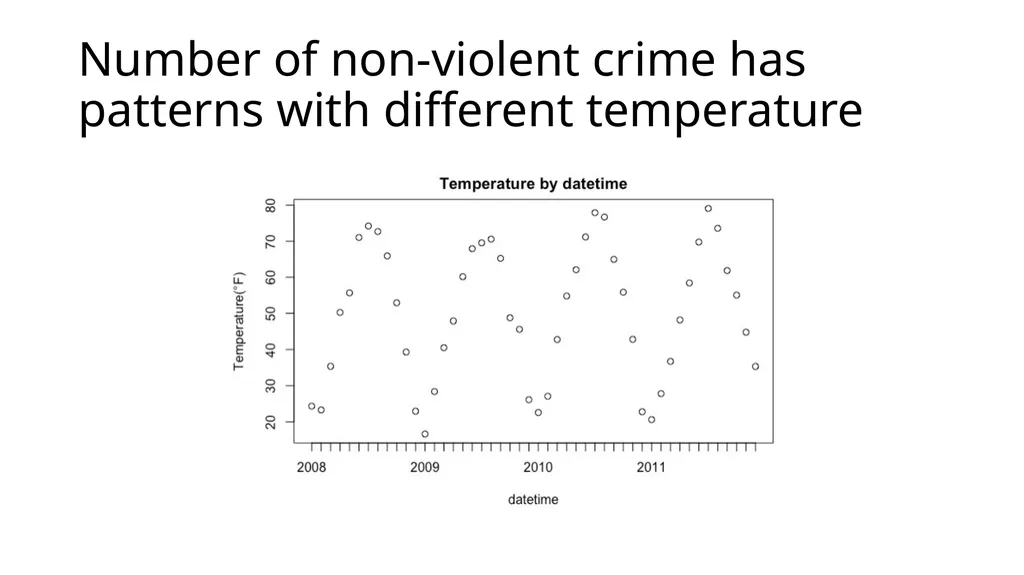
Number of non-violent crime has patterns with different temperature<br>
10
No obvious pattern for AQI related to #crimes<br>
11
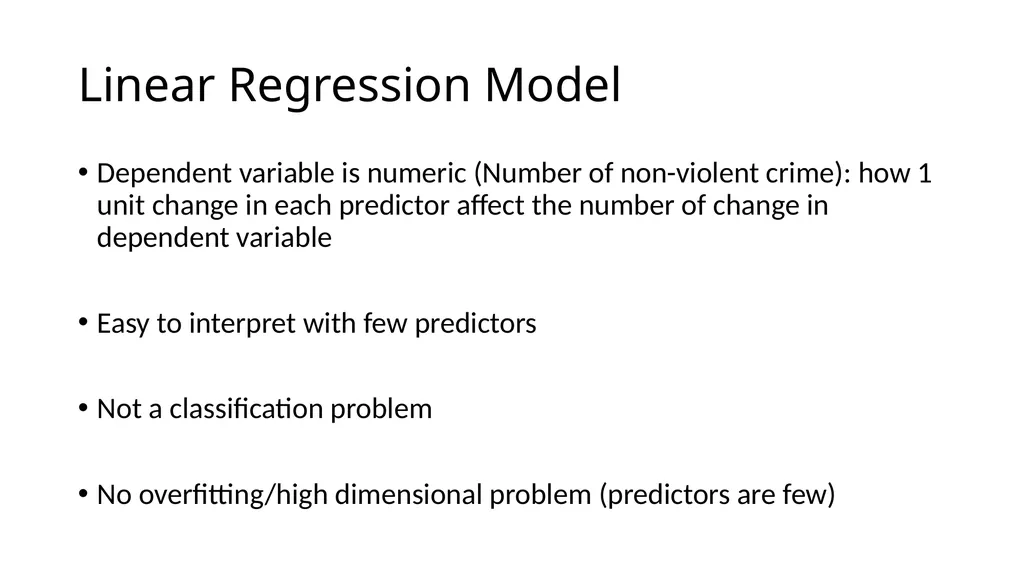
Linear Regression Model Dependent variable is numeric (Number of non-violent crime): how 1 unit change in each predictor affect the number of change in dependent variable
Easy to interpret with few predictors
Not a classification problem
No overfitting/high dimensional problem (predictors are few)<br>
12
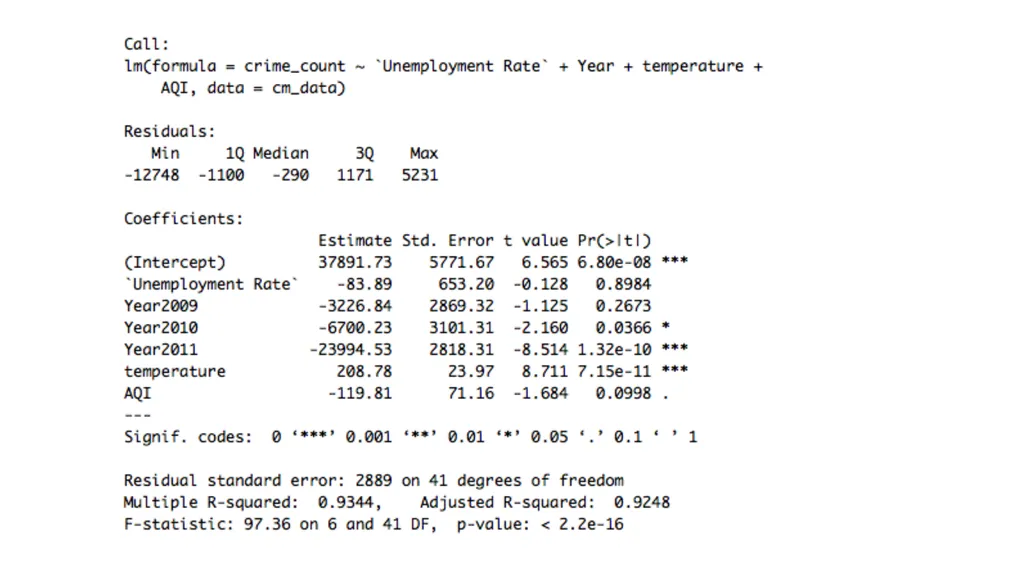
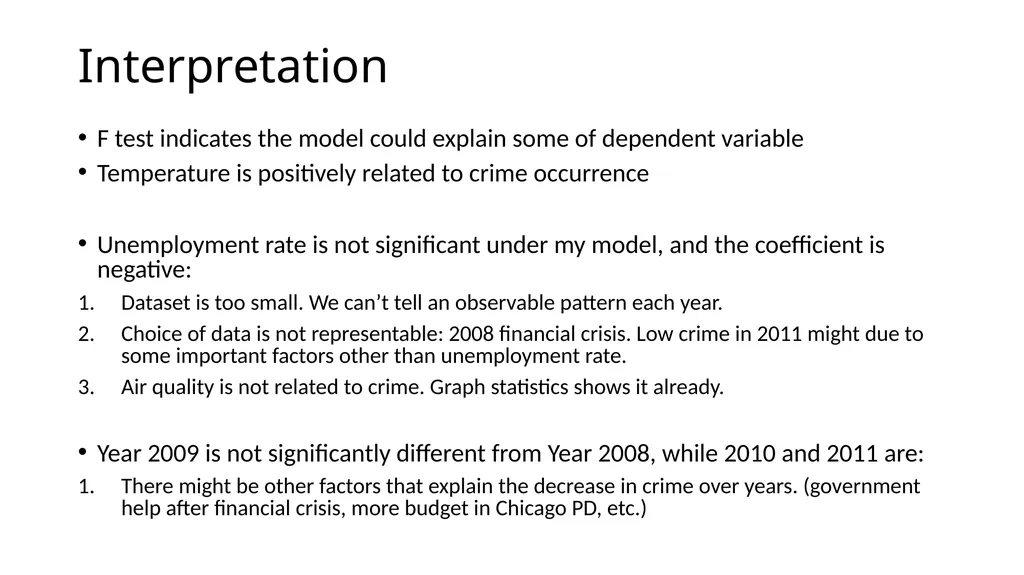
Interpretation F test indicates the model could explain some of dependent variable
Temperature is positively related to crime occurrence
Unemployment rate is not significant under my model, and the coefficient is negative:
Dataset is too small. We can’t tell an observable pattern each year.
Choice of data is not representable: 2008 financial crisis. Low crime in 2011 might due to some important factors other than unemployment rate.
Air quality is not related to crime. Graph statistics shows it already.
Year 2009 is not significantly different from Year 2008, while 2010 and 2011 are:
There might be other factors that explain the decrease in crime over years. (government help after financial crisis, more budget in Chicago PD, etc.)<br>
13
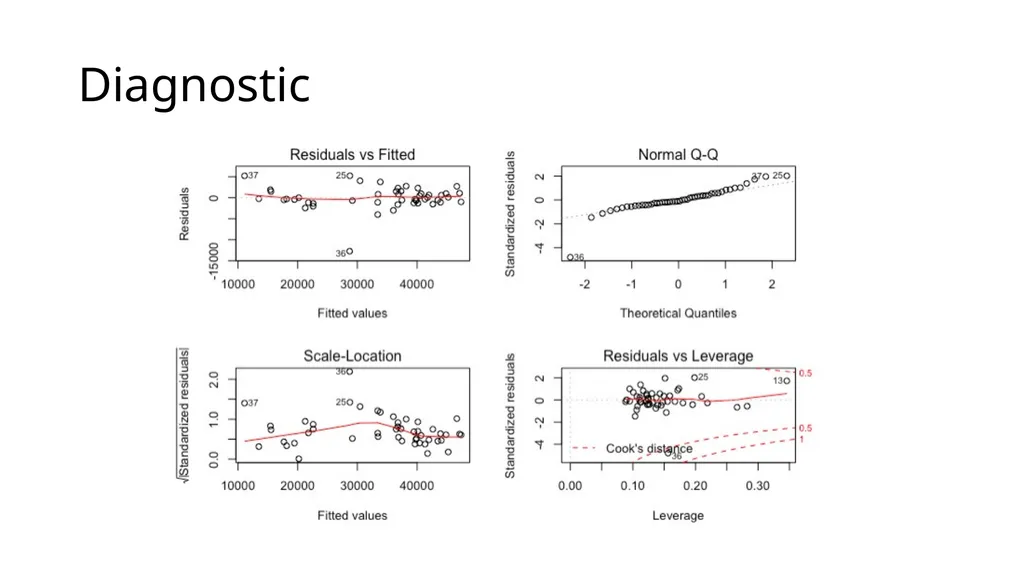
Diagnostic<br>
14
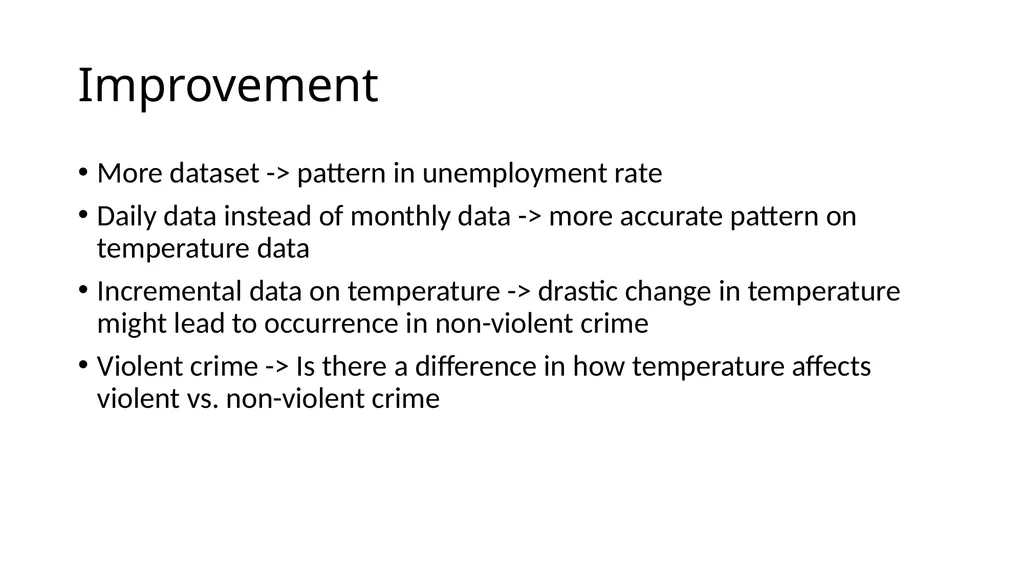
Improvement More dataset -> pattern in unemployment rate
Daily data instead of monthly data -> more accurate pattern on temperature data
Incremental data on temperature -> drastic change in temperature might lead to occurrence in non-violent crime
Violent crime -> Is there a difference in how temperature affects violent vs. non-violent crime<br>