
Investor Update Q1 June 2026 Key highlights for Q1
DP
Published · 24 slides · 0 views

1 / 1








Description
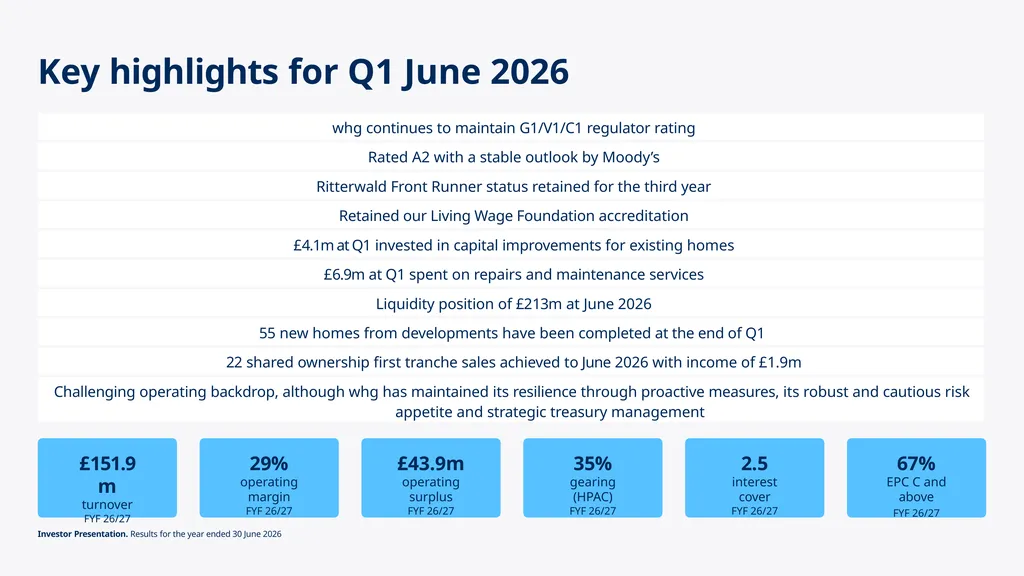
Investor Update Q1 June 2026 Key highlights for Q1 June 2026 151.9m turnover FYF 2627 29 operating margin FYF 2627 43.9m operating surplus FYF 2627 35 gearing (HPAC) FYF 2627 2.5 interest cover FYF 2627 67 EPC C and above FYF
Related Topics
Share
Embed code
Download this presentation From Below
"Investor Update Q1 June 2026 Key highlights for Q1" is the property of its rightful owner. Permission is granted to download and print the materials on this website for personal, non-commercial use only, and to display it on your personal computer provided you do not modify the materials and that you retain all copyright notices contained in the materials. By downloading content from our website, you accept the terms of this agreement.
Presentation Transcript
01
Investor Update
Q1 June 2026<br>
Q1 June 2026<br>
02
Key highlights for Q1 June 2026 £151.9m
turnover
FYF 26/27 29%
operating margin
FYF 26/27 £43.9m
operating surplus
FYF 26/27 35%
gearing (HPAC)
FYF 26/27 2.5
interest cover
FYF 26/27 67%
EPC C and above
FYF 26/27 Investor Presentation. Results for the year ended 30 June 2026<br>
turnover
FYF 26/27 29%
operating margin
FYF 26/27 £43.9m
operating surplus
FYF 26/27 35%
gearing (HPAC)
FYF 26/27 2.5
interest cover
FYF 26/27 67%
EPC C and above
FYF 26/27 Investor Presentation. Results for the year ended 30 June 2026<br>
03
Operating Performance<br>
04
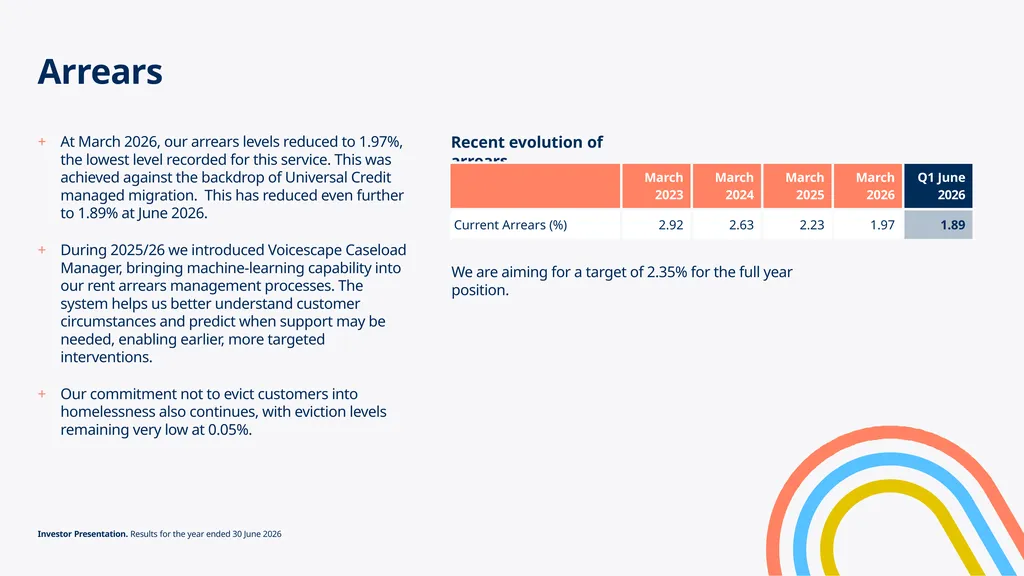
Arrears + At March 2026, our arrears levels reduced to 1.97%, the lowest level recorded for this service. This was achieved against the backdrop of Universal Credit managed migration. This has reduced even further to 1.89% at June 2026.
+ During 2025/26 we introduced Voicescape Caseload Manager, bringing machine-learning capability into our rent arrears management processes. The system helps us better understand customer circumstances and predict when support may be needed, enabling earlier, more targeted interventions.
+ Our commitment not to evict customers into homelessness also continues, with eviction levels remaining very low at 0.05%. Investor Presentation. Results for the year ended 30 June 2026 We are aiming for a target of 2.35% for the full year position. Recent evolution of arrears<br>
05
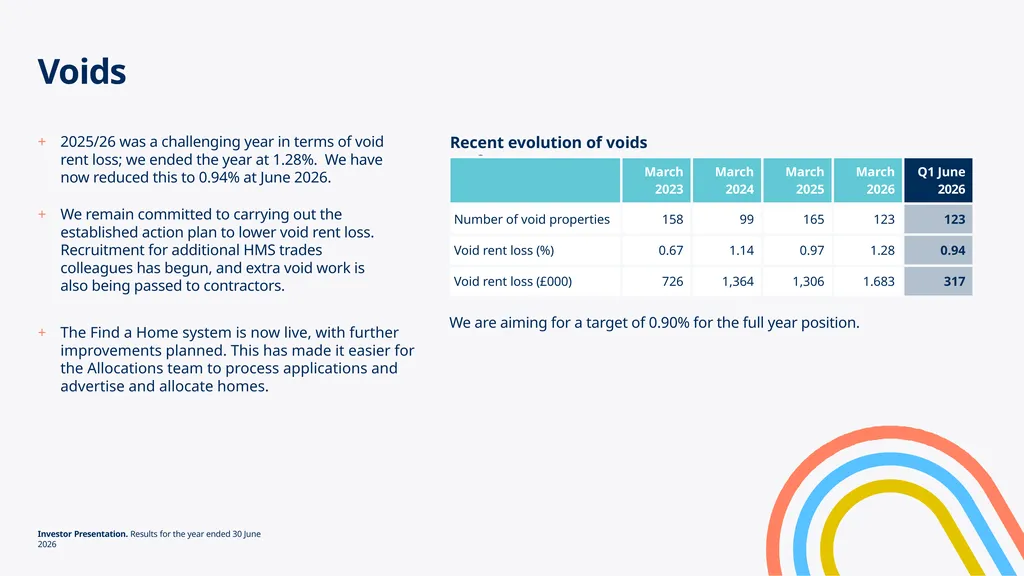
Voids + 2025/26 was a challenging year in terms of void rent loss; we ended the year at 1.28%. We have now reduced this to 0.94% at June 2026.
+ We remain committed to carrying out the established action plan to lower void rent loss. Recruitment for additional HMS trades colleagues has begun, and extra void work is also being passed to contractors.
+ The Find a Home system is now live, with further improvements planned. This has made it easier for the Allocations team to process applications and advertise and allocate homes. Investor Presentation. Results for the year ended 30 June 2026 Recent evolution of voids performance We are aiming for a target of 0.90% for the full year position.<br>
06
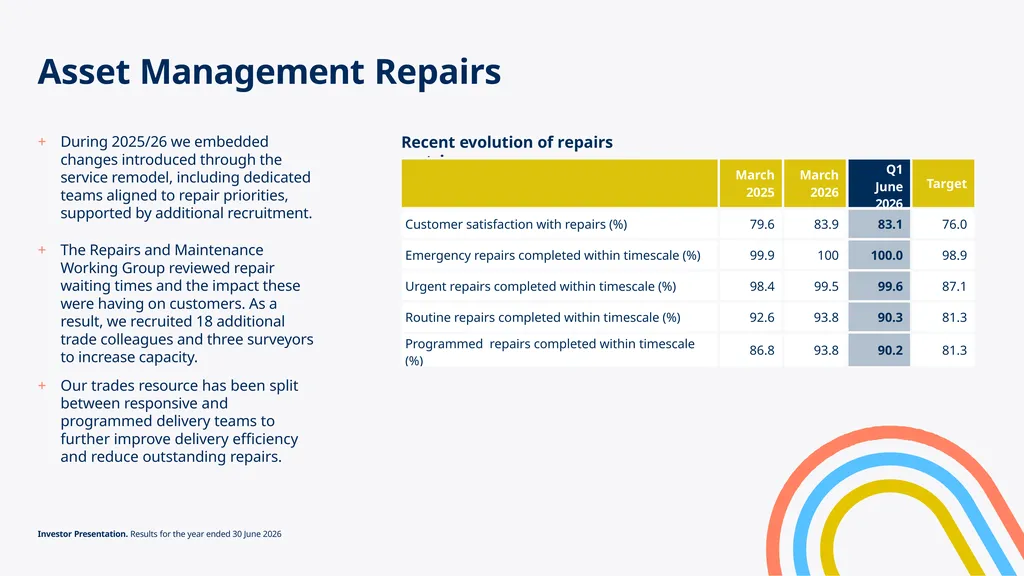
Asset Management Repairs + During 2025/26 we embedded changes introduced through the service remodel, including dedicated teams aligned to repair priorities, supported by additional recruitment.
+ The Repairs and Maintenance Working Group reviewed repair waiting times and the impact these were having on customers. As a result, we recruited 18 additional trade colleagues and three surveyors to increase capacity.
+ Our trades resource has been split between responsive and programmed delivery teams to further improve delivery efficiency and reduce outstanding repairs. Investor Presentation. Results for the year ended 30 June 2026 Recent evolution of repairs metrics<br>
07
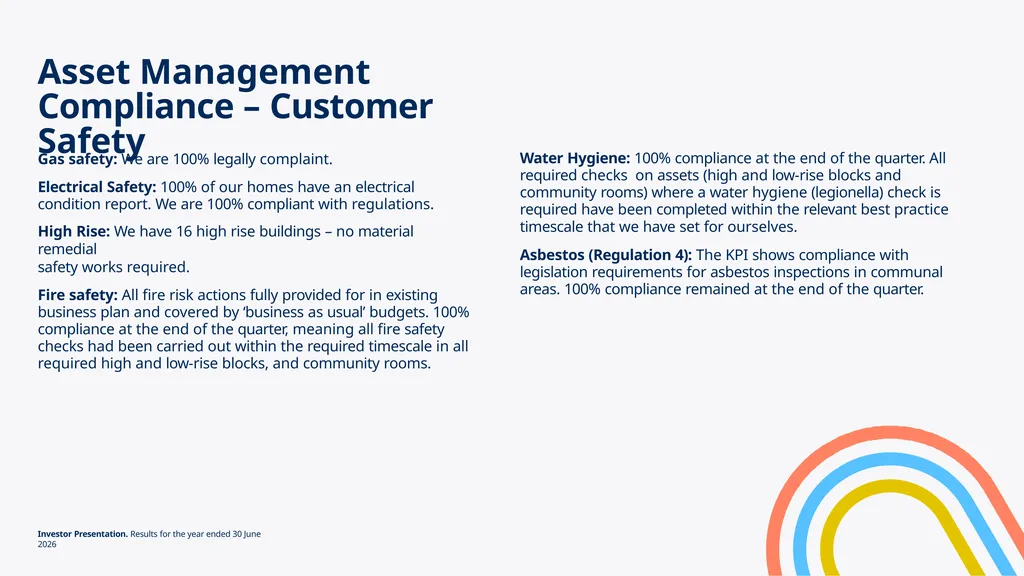
Asset Management Compliance – Customer Safety Investor Presentation. Results for the year ended 30 June 2026 Gas safety: We are 100% legally complaint.
Electrical Safety: 100% of our homes have an electrical condition report. We are 100% compliant with regulations.
High Rise: We have 16 high rise buildings – no material remedial safety works required.
Fire safety: All fire risk actions fully provided for in existing business plan and covered by ‘business as usual’ budgets. 100% compliance at the end of the quarter, meaning all fire safety checks had been carried out within the required timescale in all required high and low-rise blocks, and community rooms.
Water Hygiene: 100% compliance at the end of the quarter. All required checks on assets (high and low-rise blocks and community rooms) where a water hygiene (legionella) check is required have been completed within the relevant best practice
timescale that we have set for ourselves.
Asbestos (Regulation 4): The KPI shows compliance with legislation requirements for asbestos inspections in communal areas. 100% compliance remained at the end of the quarter.<br>
08
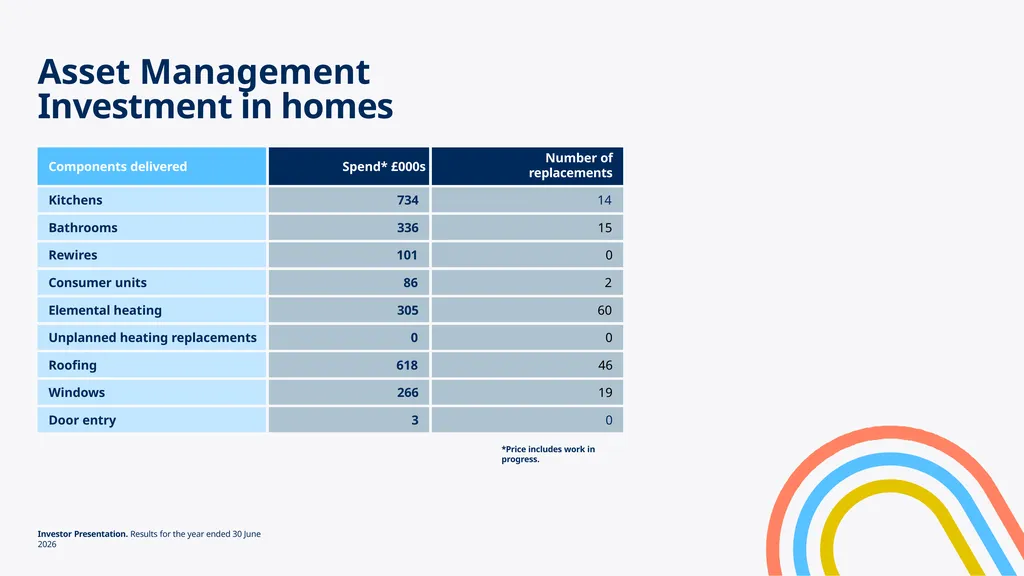
Asset Management Investment in homes Investor Presentation. Results for the year ended 30 June 2026 *Price includes work in progress.<br>
09
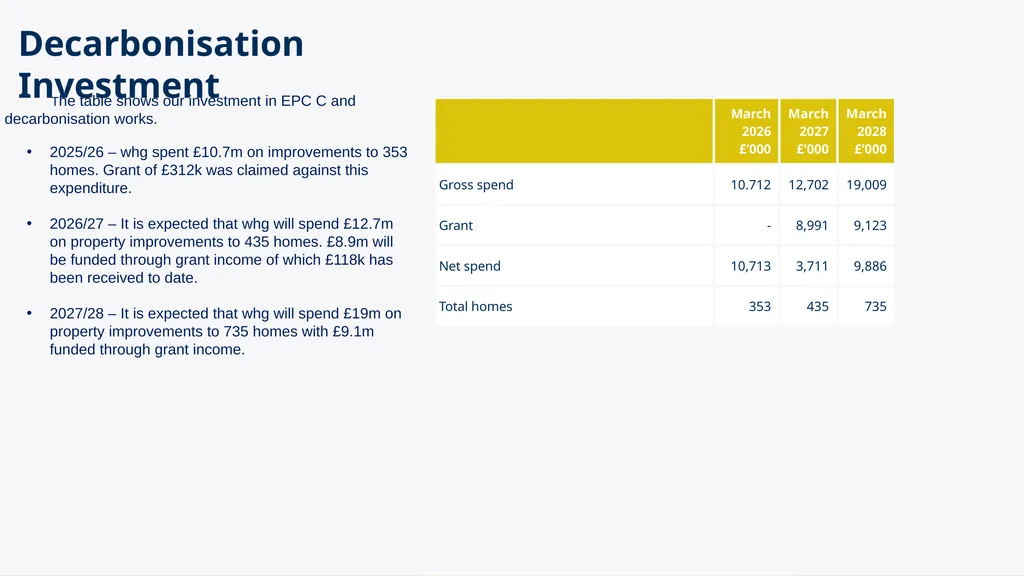
Decarbonisation Investment The table shows our investment in EPC C and decarbonisation works.
2025/26 – whg spent £10.7m on improvements to 353 homes. Grant of £312k was claimed against this expenditure.
2026/27 – It is expected that whg will spend £12.7m on property improvements to 435 homes. £8.9m will be funded through grant income of which £118k has been received to date.
2027/28 – It is expected that whg will spend £19m on property improvements to 735 homes with £9.1m funded through grant income.<br>
10
Sustainability<br>
11
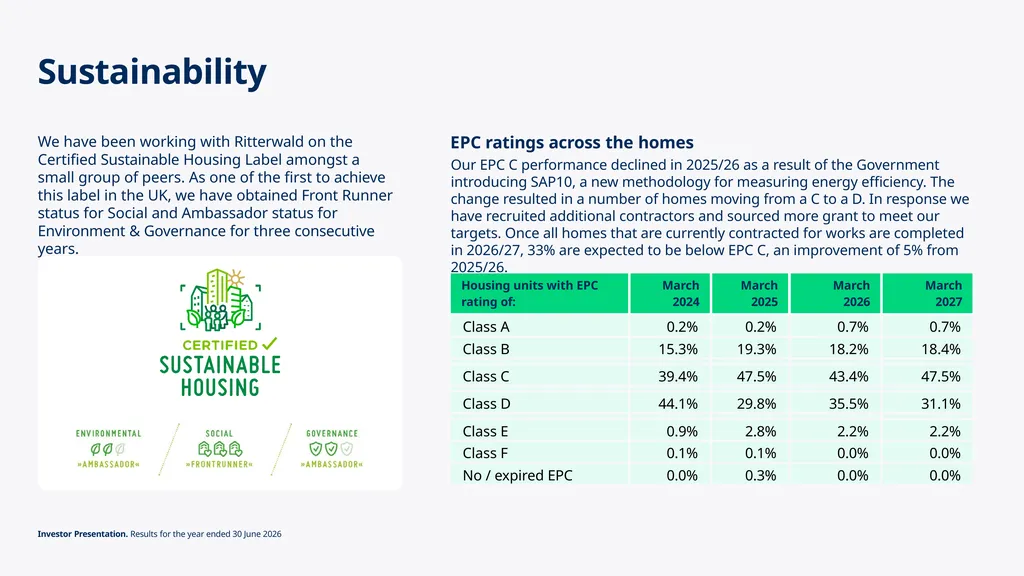
Sustainability We have been working with Ritterwald on the Certified Sustainable Housing Label amongst a small group of peers. As one of the first to achieve this label in the UK, we have obtained Front Runner status for Social and Ambassador status for Environment & Governance for three consecutive years. Investor Presentation. Results for the year ended 30 June 2026 EPC ratings across the homes
Our EPC C performance declined in 2025/26 as a result of the Government introducing SAP10, a new methodology for measuring energy efficiency. The change resulted in a number of homes moving from a C to a D. In response we have recruited additional contractors and sourced more grant to meet our targets. Once all homes that are currently contracted for works are completed in 2026/27, 33% are expected to be below EPC C, an improvement of 5% from 2025/26.<br>
Our EPC C performance declined in 2025/26 as a result of the Government introducing SAP10, a new methodology for measuring energy efficiency. The change resulted in a number of homes moving from a C to a D. In response we have recruited additional contractors and sourced more grant to meet our targets. Once all homes that are currently contracted for works are completed in 2026/27, 33% are expected to be below EPC C, an improvement of 5% from 2025/26.<br>
12
Development<br>
13
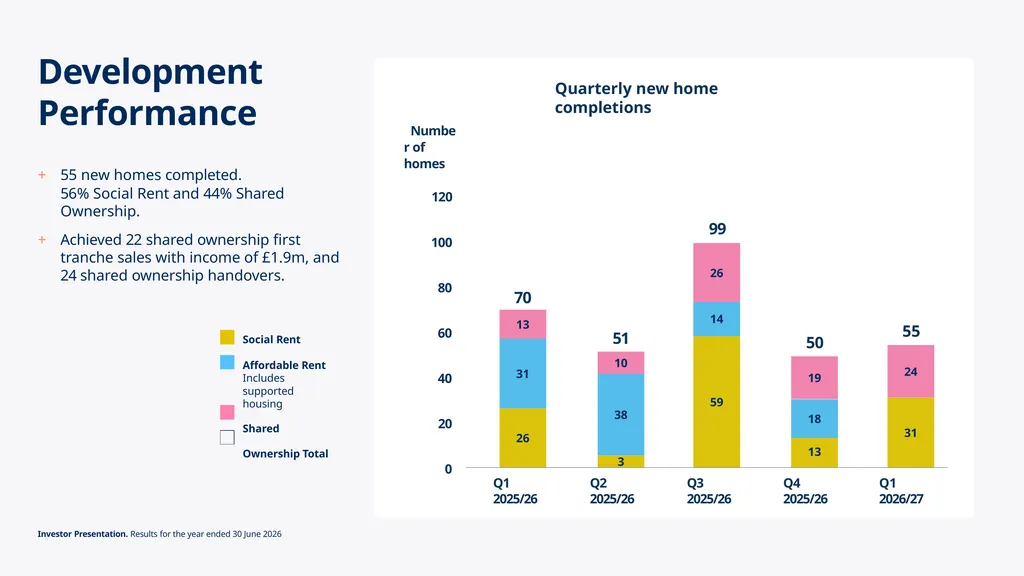
Development Performance + 55 new homes completed.
56% Social Rent and 44% Shared Ownership.
+ Achieved 22 shared ownership first tranche sales with income of £1.9m, and 24 shared ownership handovers. Investor Presentation. Results for the year ended 30 June 2026 120 100 80 60 40 20 0 Number of homes Q4 2025/26 50 Q1 2025/26 70 Q2 2025/26 Q3 2025/26 51 99 Quarterly new home completions Social Rent
Affordable Rent Includes supported housing
Shared Ownership Total Q1 2026/27 55 26 3 59 13 31 24 31 38 13 10 14 26 18 19<br>
14
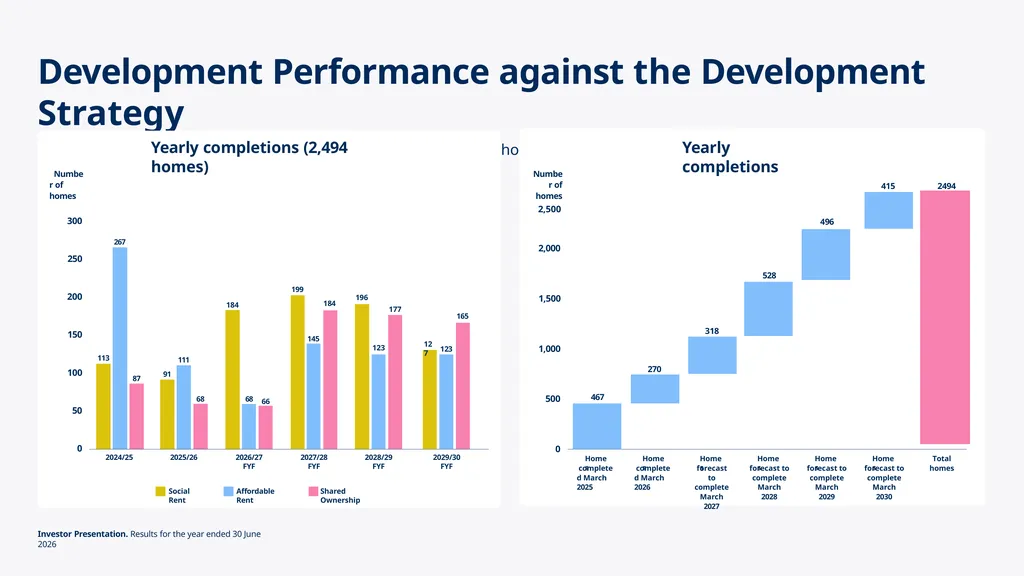
Development Performance against the Development Strategy
Our six year Development Strategy is forecasting to complete 2,494 homes. Investor Presentation. Results for the year ended 30 June 2026 Social Rent Affordable Rent Shared Ownership 300 250 200 150 100 50 0 2,000 1,500 1,000 500 0 Yearly completions (2,494 homes) Yearly completions Number of homes Number of homes
2,500 2024/25 Homes completed March 2025 Homes completed March 2026 Homes forecast to complete March 2027 Homes forecast to complete March 2028 Homes forecast to complete March 2029 Homes forecast to complete March 2030 Total
homes 2025/26 2026/27 FYF 2027/28 FYF 2028/29 FYF 2029/30 FYF 467 270 318 528 496 415 91 111 68 184 68 66 145 199 196 123 127 123 165 113 267 87 184 177 2494<br>
15
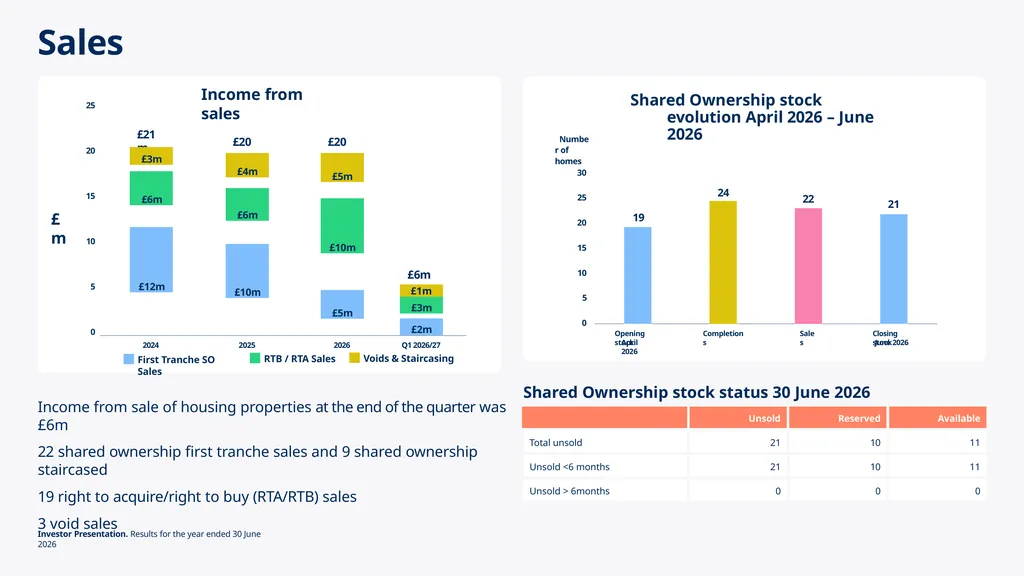
Sales Income from sale of housing properties at the end of the quarter was £6m
22 shared ownership first tranche sales and 9 shared ownership staircased
19 right to acquire/right to buy (RTA/RTB) sales
3 void sales Shared Ownership stock status 30 June 2026 Investor Presentation. Results for the year ended 30 June 2026 25 20 15 10 5 0 Income from sales 30 25 20 15 10 5 0 19 Opening stock April 2026 Shared Ownership stock evolution April 2026 – June 2026 Completions 21 Closing stock June 2026 £m Number of homes 2024 £21m £6m £12m £3m 2025 2026 £20m £20m £6m £10m £10m £5m £4m £5m 22 Sales First Tranche SO Sales RTB / RTA Sales Voids & Staircasing 24 Q1 2026/27 £2m £3m £1m £6m<br>
16
Financial Performance<br>
17
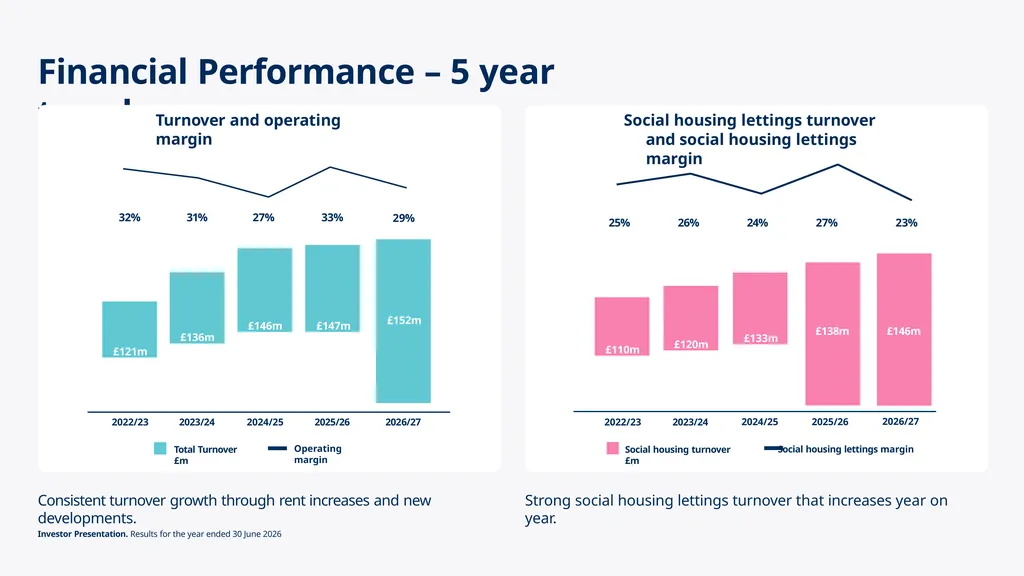
Financial Performance – 5 year trend Investor Presentation. Results for the year ended 30 June 2026 Social housing lettings turnover and social housing lettings margin Turnover and operating margin 2023/24 £121m £146m £147m 2025/26 £136m 32% 31% £110m £133m £138m 2022/23 2024/25 2025/26 2022/23 2024/25 27% 2023/24 £120m 26% 25% 24% 33% 27% Consistent turnover growth through rent increases and new developments. Strong social housing lettings turnover that increases year on year. Operating margin Total Turnover £m £152m 2026/27 29% Social housing turnover £m Social housing lettings margin 2026/27 £146m 23%<br>
18
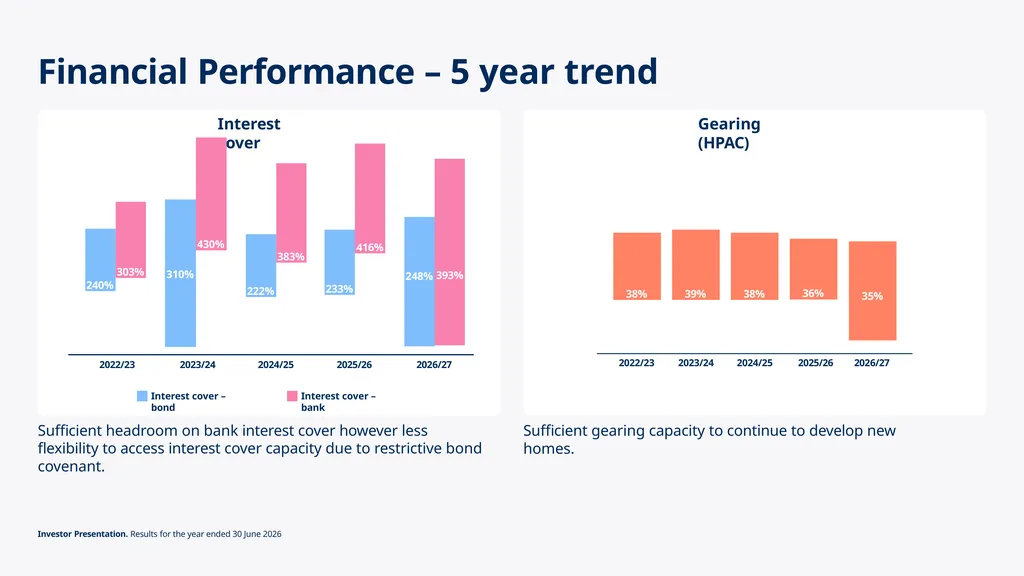
Financial Performance – 5 year trend Sufficient headroom on bank interest cover however less flexibility to access interest cover capacity due to restrictive bond covenant. Sufficient gearing capacity to continue to develop new homes. Investor Presentation. Results for the year ended 30 June 2026 Gearing (HPAC) Interest cover 2022/23 2022/23 2024/25 2025/26 222% 233% 383% 416% 303% Interest cover – bond Interest cover – bank 2023/24 430% 38% 2023/24 39% 2024/25 2025/26 38% 36% 240% 310% 2026/27 248% 393% 2026/27 35%<br>
19
Treasury<br>
20
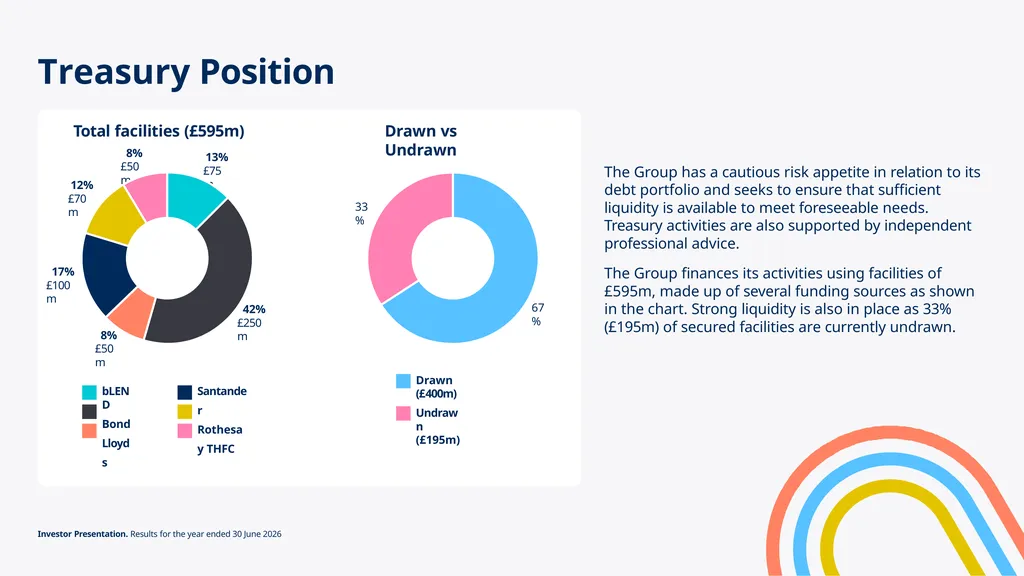
Treasury Position The Group has a cautious risk appetite in relation to its debt portfolio and seeks to ensure that sufficient liquidity is available to meet foreseeable needs. Treasury activities are also supported by independent professional advice.
The Group finances its activities using facilities of £595m, made up of several funding sources as shown in the chart. Strong liquidity is also in place as 33% (£195m) of secured facilities are currently undrawn. Drawn vs Undrawn Drawn (£400m)
Undrawn (£195m) bLEND
Bond Lloyds Santander Rothesay THFC 12%
£70m Total facilities (£595m)
8% £50m 17%
£100m 8%
£50m 42%
£250m 13%
£75m 67% 33% Investor Presentation. Results for the year ended 30 June 2026<br>
21
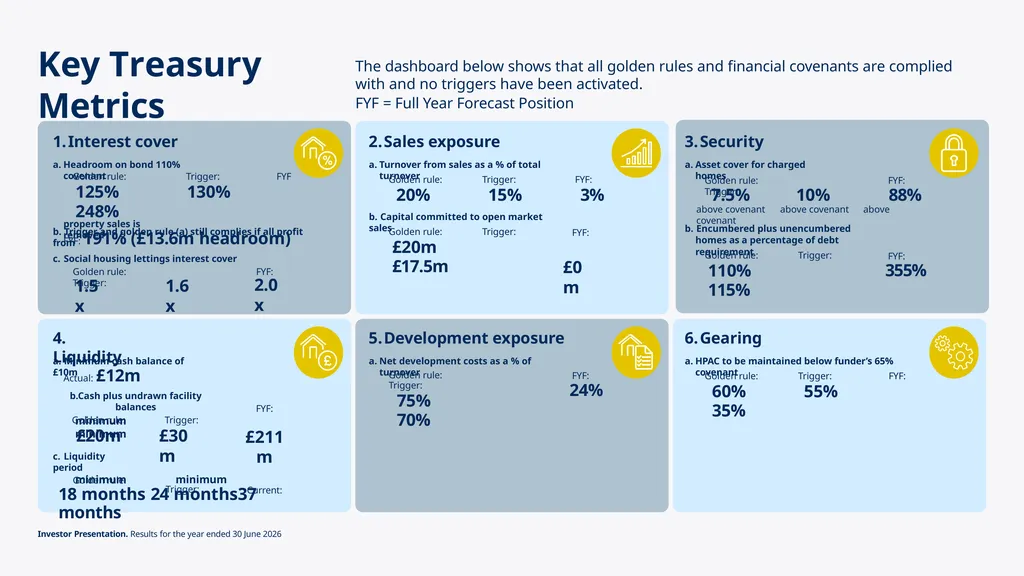
Key Treasury Metrics Interest cover
Headroom on bond 110% covenant Golden rule: Trigger: FYF
125% 130% 248%
b. Trigger and golden rule (a) still complies if all profit from property sales is removed FYF: 191% (£13.6m headroom) c. Social housing lettings interest cover Golden rule: Trigger: FYF: 1.5x 1.6x 2.0x Sales exposure
Turnover from sales as a % of total turnover Golden rule: Trigger: FYF:
20% 15% 3% b. Capital committed to open market sales FYF: Golden rule: Trigger:
£20m £17.5m £0m Security
Asset cover for charged homes Golden rule: Trigger: FYF: 7.5% 10% 88% above covenant above covenant above covenant b. Encumbered plus unencumbered homes as a percentage of debt requirement FYF: Golden rule: Trigger:
110% 115% 355% 4. Liquidity a. Minimum cash balance of £10m Actual: £12m b.Cash plus undrawn facility balances
Golden rule: Trigger: minimum minimum £20m
c. Liquidity period
Golden rule: £30m
Trigger: FYF:
£211m
Current: minimum minimum
18 months 24 months 37 months Development exposure
Net development costs as a % of turnover FYF: Golden rule: Trigger:
75% 70% 24% Gearing
HPAC to be maintained below funder’s 65% covenant Golden rule: Trigger: FYF:
60% 55% 35% The dashboard below shows that all golden rules and financial covenants are complied with and no triggers have been activated.
FYF = Full Year Forecast Position Investor Presentation. Results for the year ended 30 June 2026<br>
22
Contact Information<br>
23
Contact Information Sangita Surridge
Corporate Director of Finance
sangita.surridge@whgrp.co.uk 07842 322 136
Adam Wagner
Director of Treasury & Strategic Financial Planning
adam.wagner@whgrp.co.uk 07793 666 140
Amy Wilkinson
Treasury Manager
amy.wilkinson@whgrp.co.uk 07513 485 007 Investor Presentation. Results for the year ended 30 June 2026<br>
24
Thank you<br>