
Name : Dr. Sanjib Pramanik Name of the College :
FD
Published · 36 slides · 0 views

1 / 1
Description
Name : Dr. Sanjib Pramanik Name of the College : Durga College, Raipur (C.G.), India Name of the Faculty : Arts Designation : Assistant Professor, Department of Geography Topic : CROP COMBINATION REGION Date : 27022024 The study of crop
Related Topics
Share
Embed code
Download this presentation From Below
"Name : Dr. Sanjib Pramanik Name of the College :" is the property of its rightful owner. Permission is granted to download and print the materials on this website for personal, non-commercial use only, and to display it on your personal computer provided you do not modify the materials and that you retain all copyright notices contained in the materials. By downloading content from our website, you accept the terms of this agreement.
Presentation Transcript
01
Name : Dr. Sanjib Pramanik
Name of the College : Durga College, Raipur (C.G.), India
Name of the Faculty : Arts
Designation : Assistant Professor, Department of Geography
Topic : CROP COMBINATION REGION
Date : 27/02/2024<br>
Name of the College : Durga College, Raipur (C.G.), India
Name of the Faculty : Arts
Designation : Assistant Professor, Department of Geography
Topic : CROP COMBINATION REGION
Date : 27/02/2024<br>
02
The study of crop combination region constitute an important aspect of agricultural geography as it provides a good basis for agricultural regionalization.
The study of crop combination enables to evaluate the suitability and consistency of cropping patterns in the context of the local environment and place. INTRODUCTION<br>
The study of crop combination enables to evaluate the suitability and consistency of cropping patterns in the context of the local environment and place. INTRODUCTION<br>
03
Crops are generally grown in combinations.
It provides an adequate understanding of an individual crop.
Crop combination is in itself an integrative reality that demands definition and distribution analysis. MEANING<br>
It provides an adequate understanding of an individual crop.
Crop combination is in itself an integrative reality that demands definition and distribution analysis. MEANING<br>
04
To delineate the ranking of crop region to know the areas of dominance of the important crops.
To demarcate the crop combinations in the pre and post green revolution periods.
To propose a scheme for the suitable crop association for the different agro climatic region. OBJECTIVES<br>
To demarcate the crop combinations in the pre and post green revolution periods.
To propose a scheme for the suitable crop association for the different agro climatic region. OBJECTIVES<br>
05
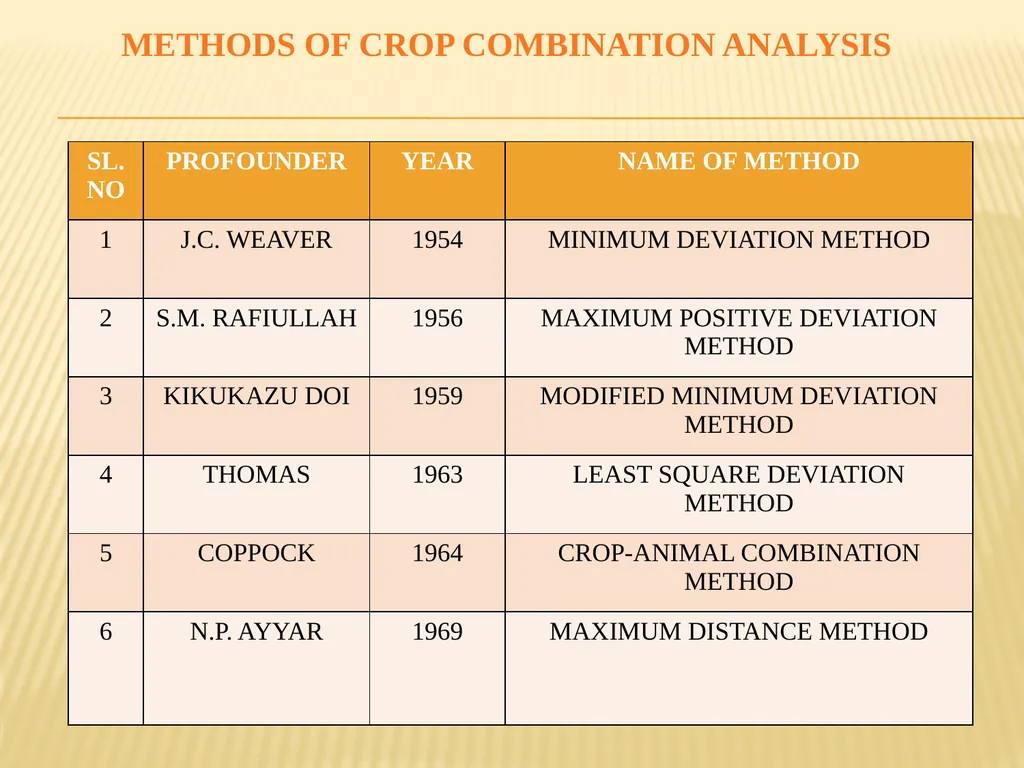
METHODS OF CROP COMBINATION ANALYSIS<br>
06
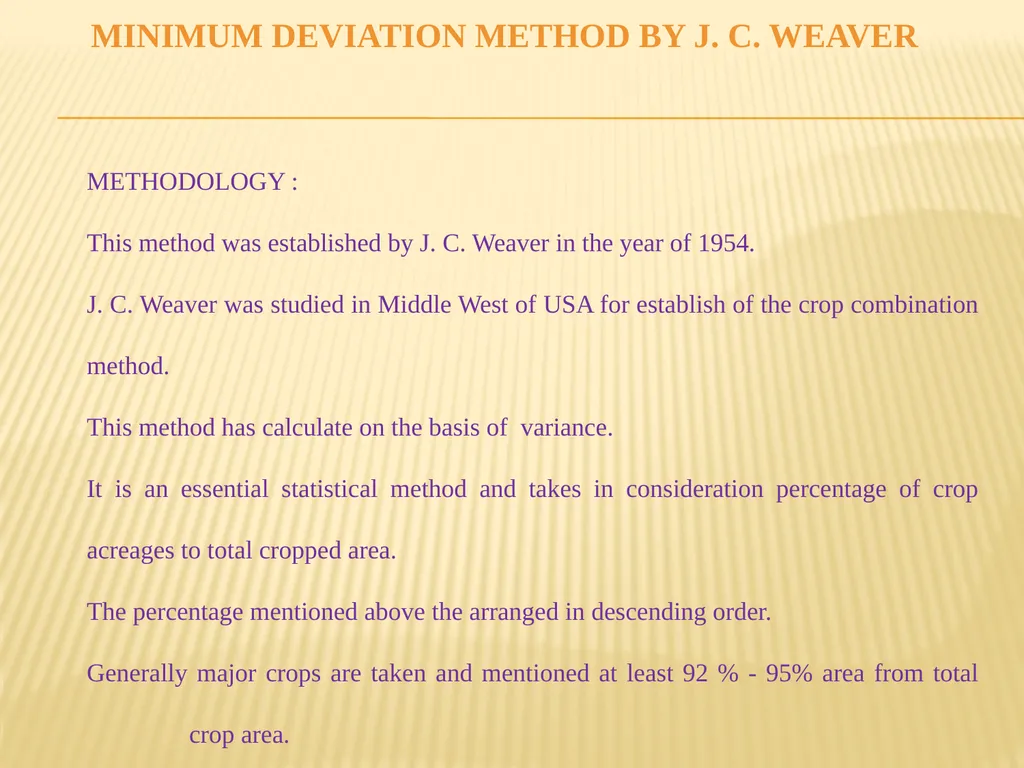
METHODOLOGY :
This method was established by J. C. Weaver in the year of 1954.
J. C. Weaver was studied in Middle West of USA for establish of the crop combination method.
This method has calculate on the basis of variance.
It is an essential statistical method and takes in consideration percentage of crop acreages to total cropped area.
The percentage mentioned above the arranged in descending order.
Generally major crops are taken and mentioned at least 92 % - 95% area from total crop area. MINIMUM DEVIATION METHOD by j. c. weaver<br>
07
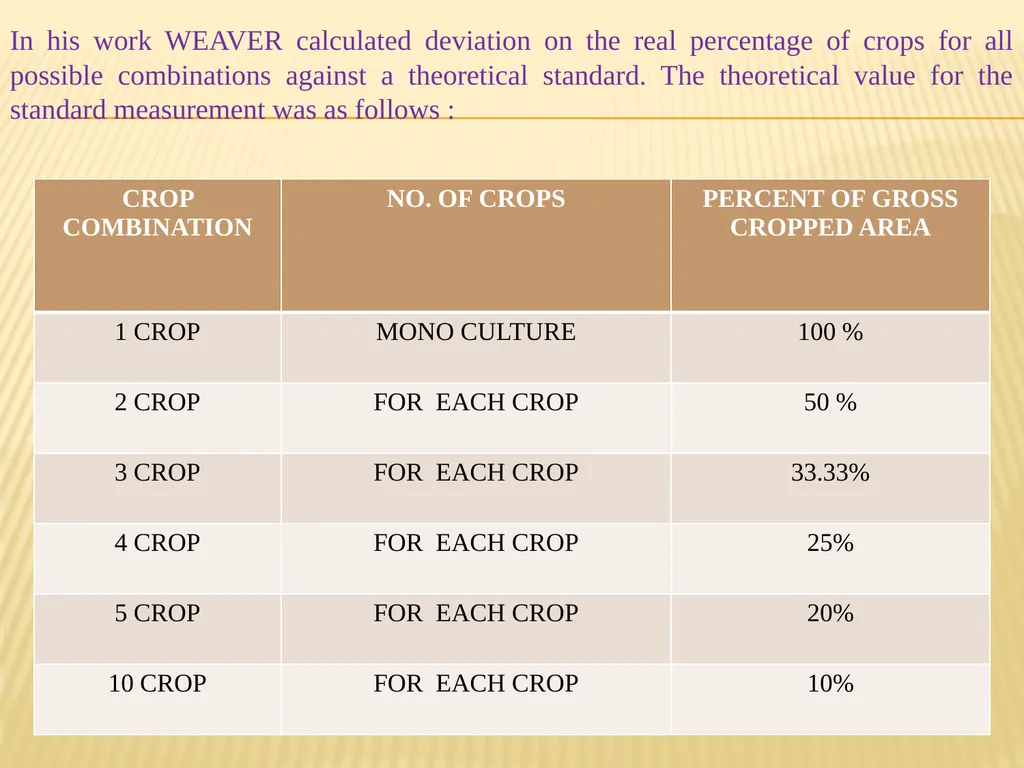
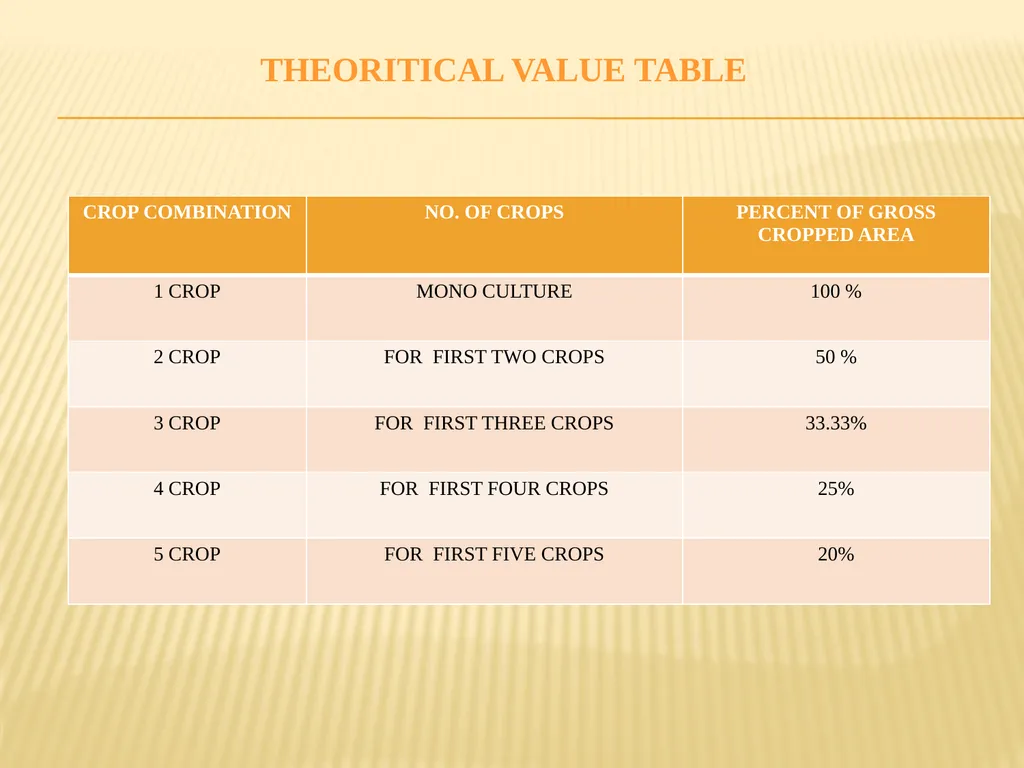
In his work WEAVER calculated deviation on the real percentage of crops for all possible combinations against a theoretical standard. The theoretical value for the standard measurement was as follows :<br>
08
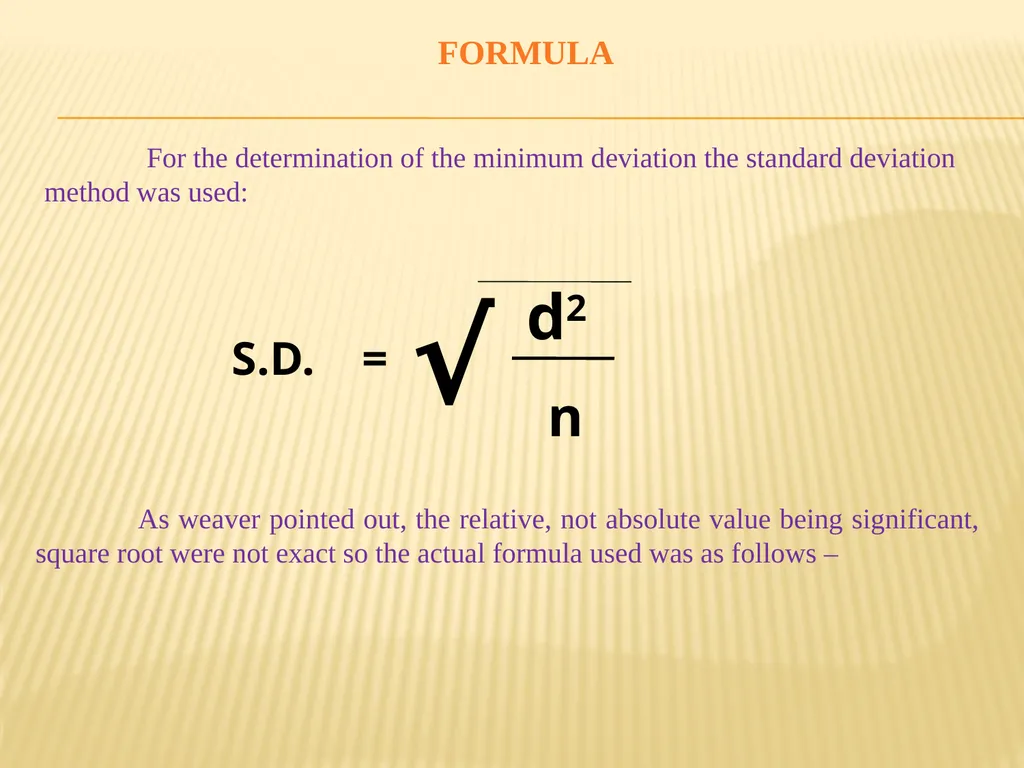
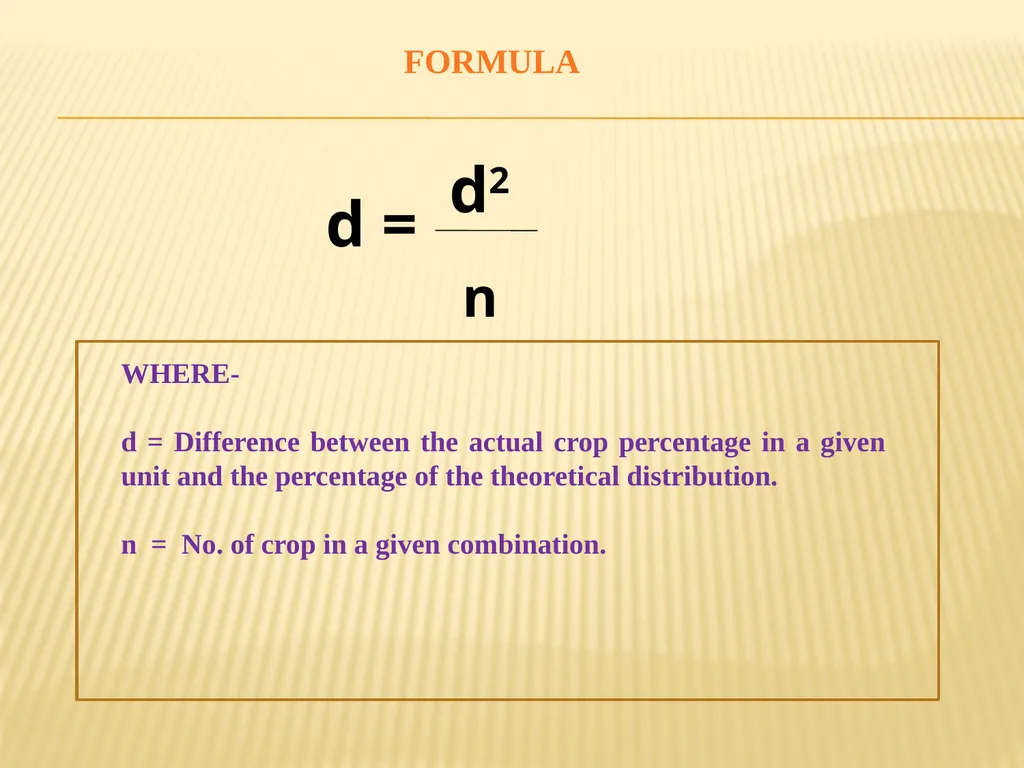
For the determination of the minimum deviation the standard deviation method was used: S.D. = d2 n As weaver pointed out, the relative, not absolute value being significant, square root were not exact so the actual formula used was as follows – √ FORMULA<br>
09
d = d2 n WHERE-
d = Difference between the actual crop percentage in a given unit and the percentage of the theoretical distribution.
n = No. of crop in a given combination. FORMULA<br>
d = Difference between the actual crop percentage in a given unit and the percentage of the theoretical distribution.
n = No. of crop in a given combination. FORMULA<br>
10
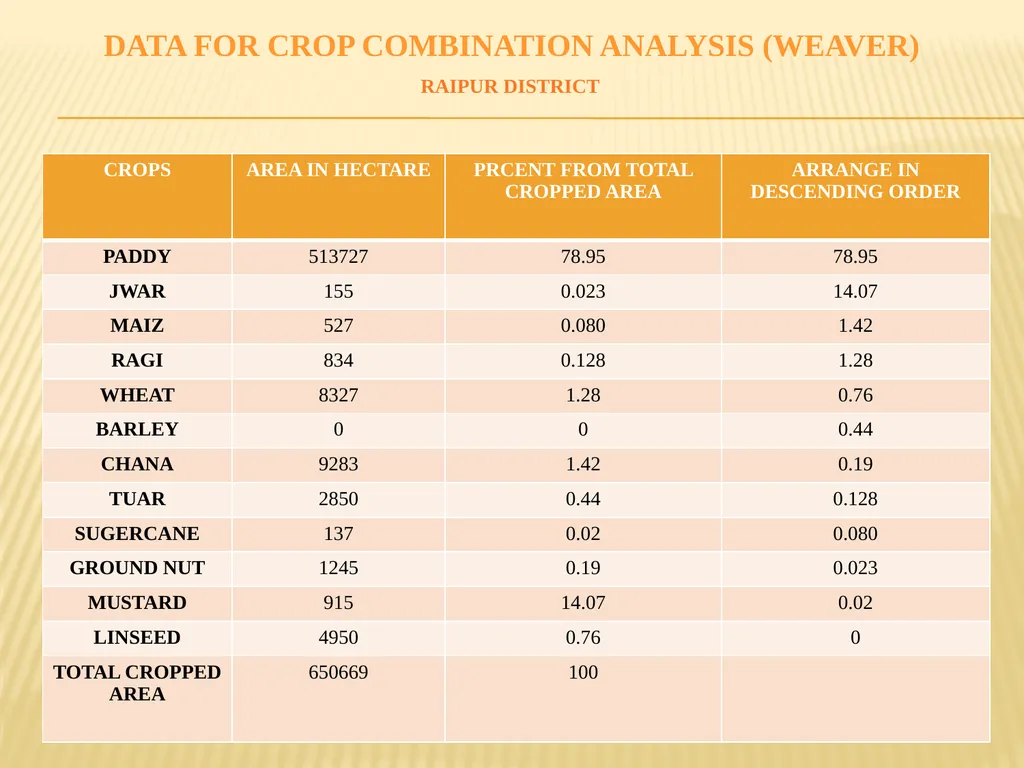
DATA FOR CROP COMBINATION ANALYSIS (WEAVER) RAIPUR DISTRICT<br>
11
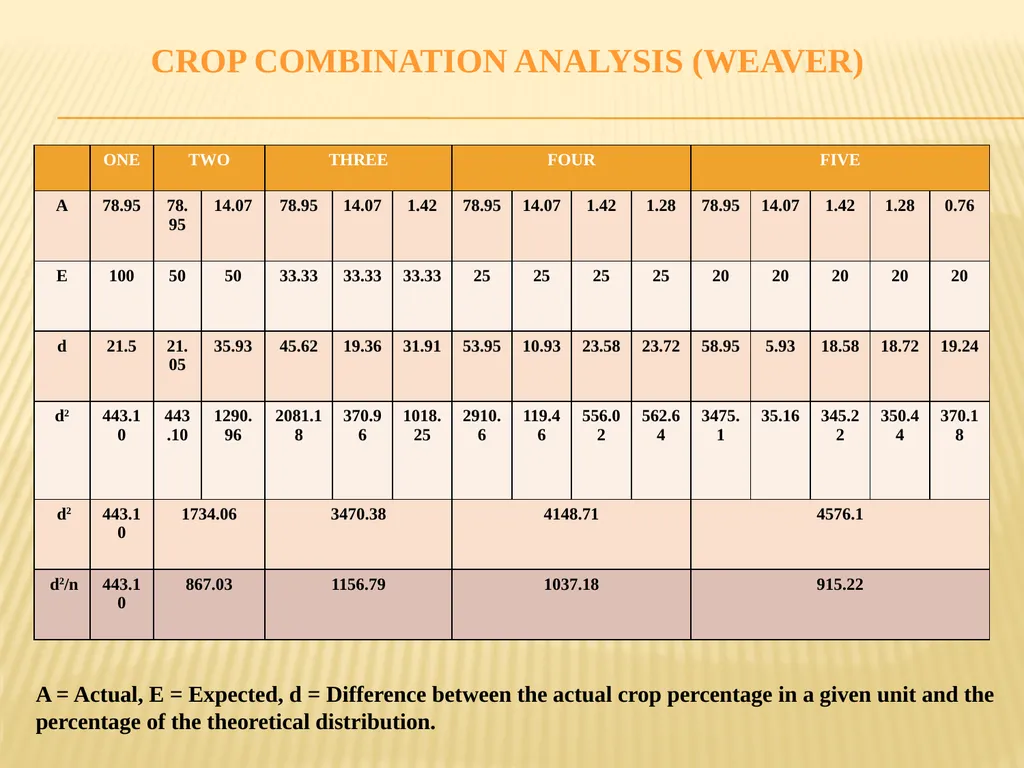
A = Actual, E = Expected, d = Difference between the actual crop percentage in a given unit and the percentage of the theoretical distribution. CROP COMBINATION ANALYSIS (WEAVER)<br>
12
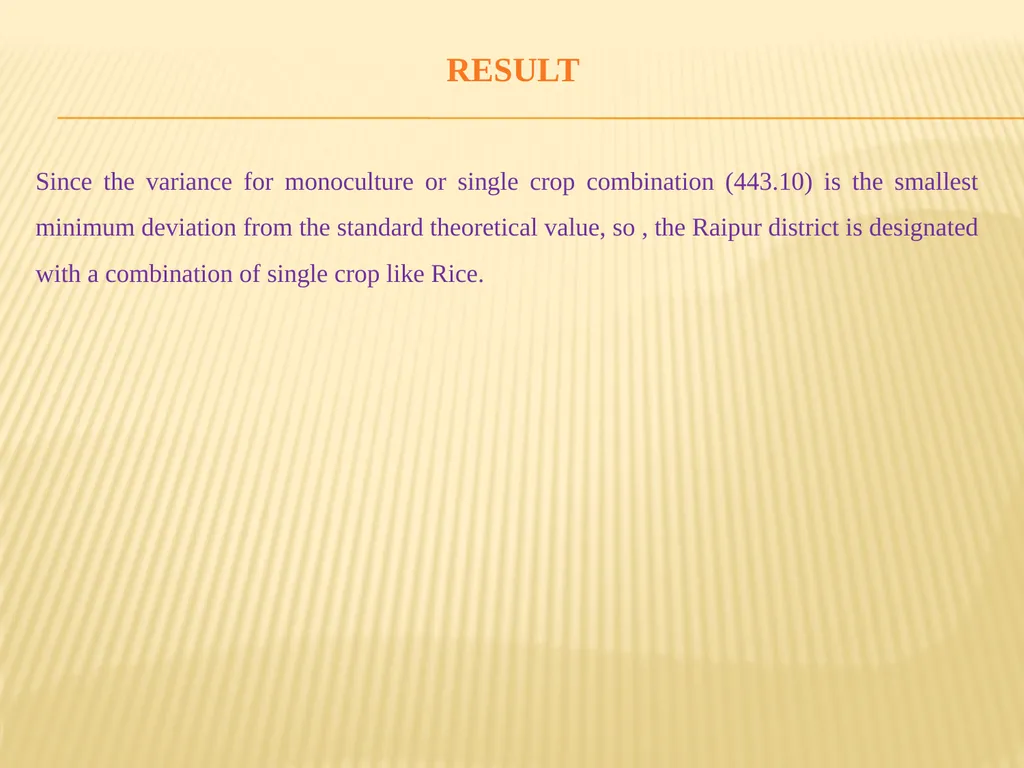
Since the variance for monoculture or single crop combination (443.10) is the smallest minimum deviation from the standard theoretical value, so , the Raipur district is designated with a combination of single crop like Rice. RESULT<br>
13
METHODOLOGY :
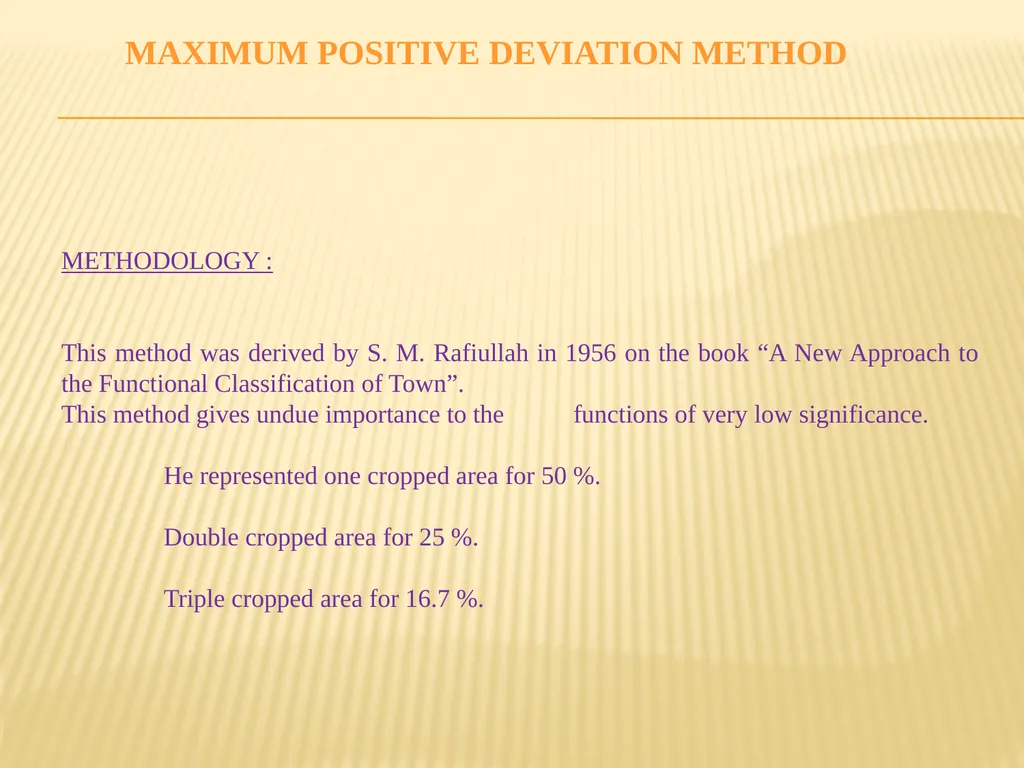
This method was derived by S. M. Rafiullah in 1956 on the book “A New Approach to the Functional Classification of Town”.
This method gives undue importance to the functions of very low significance.
He represented one cropped area for 50 %.
Double cropped area for 25 %.
Triple cropped area for 16.7 %. MAXIMUM POSITIVE DEVIATION METHOD<br>
14
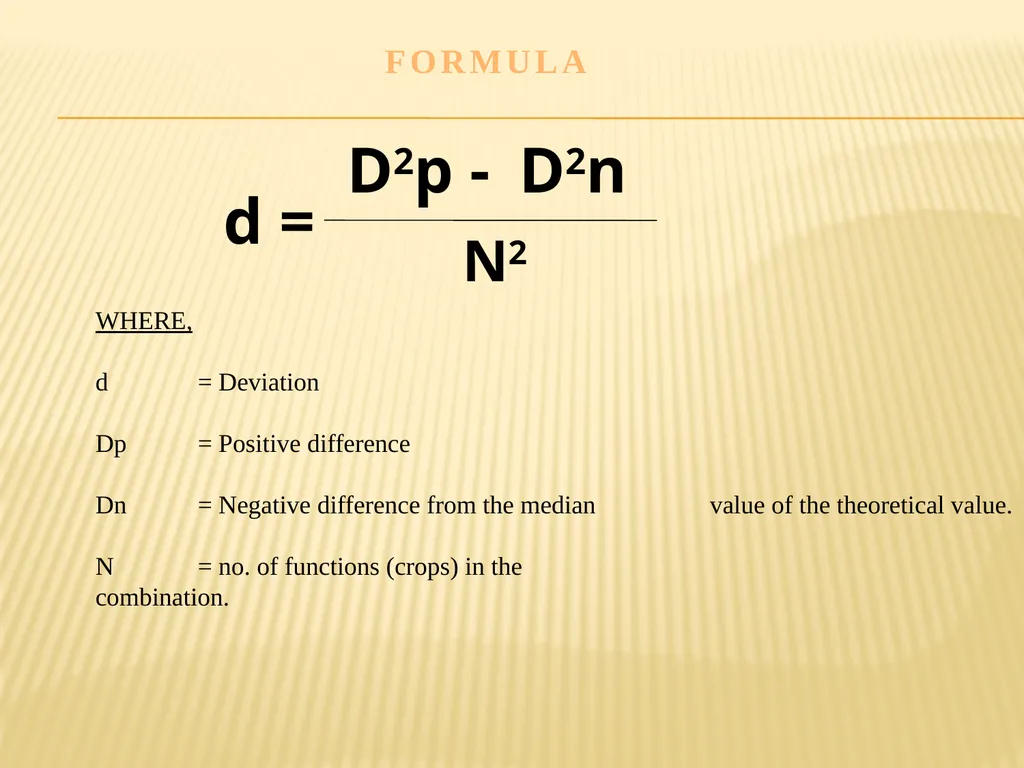
d = D2p - D2n N2 WHERE,
d = Deviation
Dp = Positive difference
Dn = Negative difference from the median value of the theoretical value.
N = no. of functions (crops) in the combination. FORMULA<br>
d = Deviation
Dp = Positive difference
Dn = Negative difference from the median value of the theoretical value.
N = no. of functions (crops) in the combination. FORMULA<br>
15
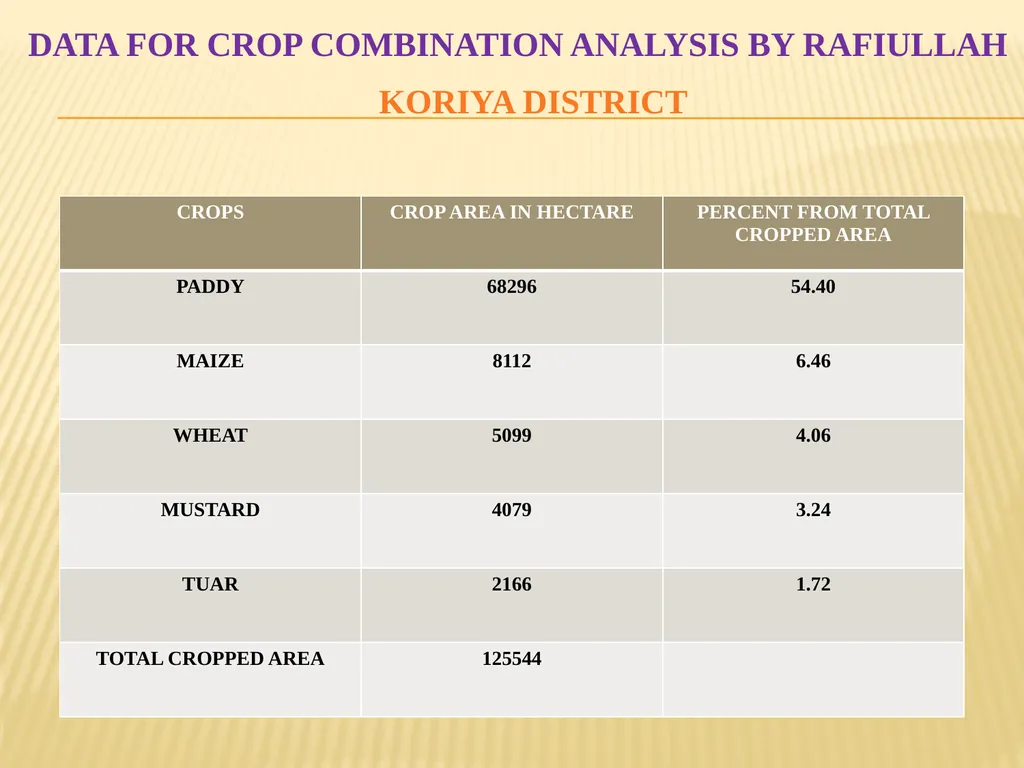
DATA FOR CROP COMBINATION ANALYSIS BY RAFIULLAH KORIYA DISTRICT<br>
16
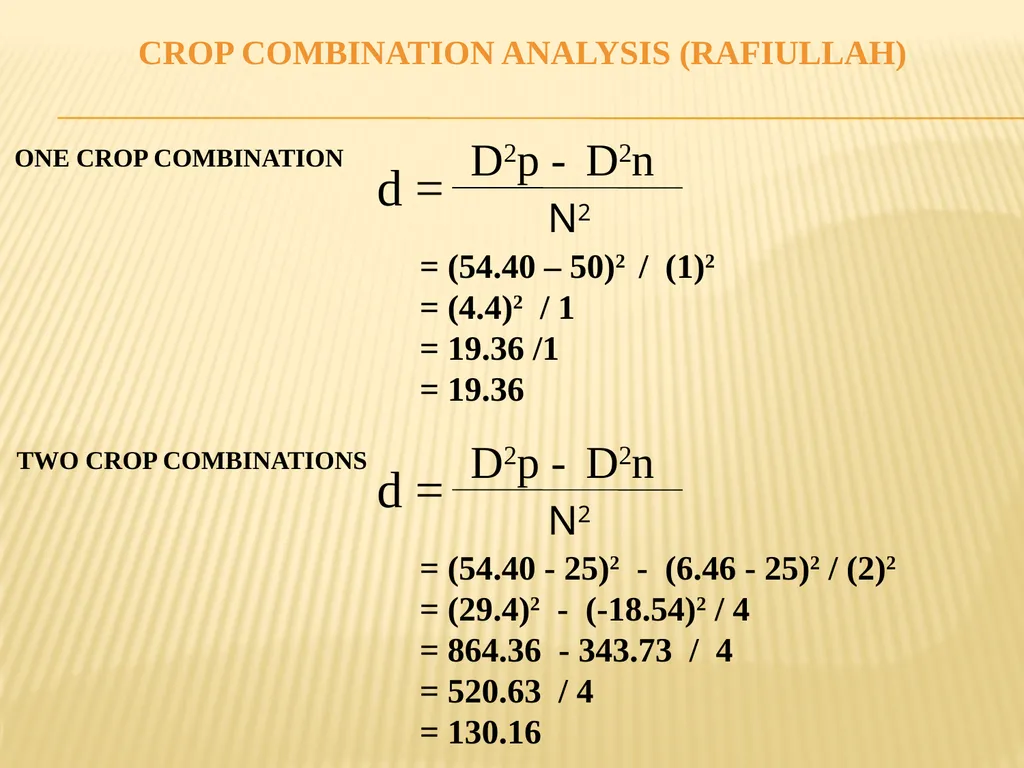
d = D2p - D2n N2 ONE CROP COMBINATION = (54.40 – 50)2 / (1)2
= (4.4)2 / 1
= 19.36 /1
= 19.36 d = D2p - D2n N2 TWO CROP COMBINATIONS = (54.40 - 25)2 - (6.46 - 25)2 / (2)2
= (29.4)2 - (-18.54)2 / 4
= 864.36 - 343.73 / 4
= 520.63 / 4
= 130.16 CROP COMBINATION ANALYSIS (RAFIULLAH)<br>
= (4.4)2 / 1
= 19.36 /1
= 19.36 d = D2p - D2n N2 TWO CROP COMBINATIONS = (54.40 - 25)2 - (6.46 - 25)2 / (2)2
= (29.4)2 - (-18.54)2 / 4
= 864.36 - 343.73 / 4
= 520.63 / 4
= 130.16 CROP COMBINATION ANALYSIS (RAFIULLAH)<br>
17
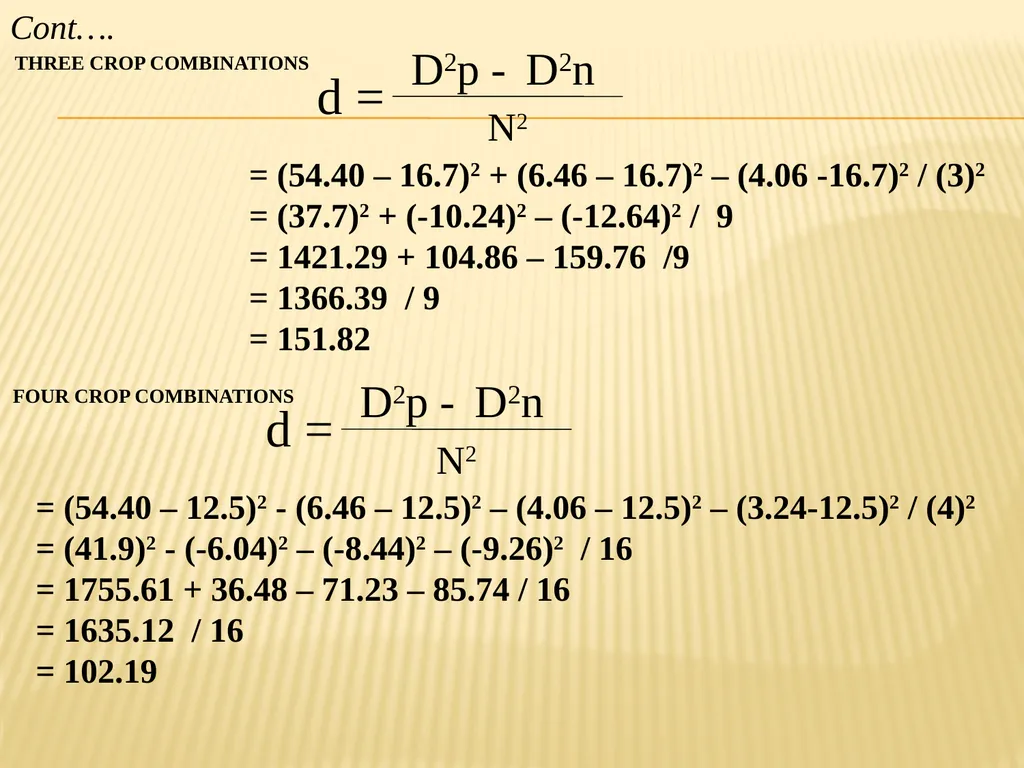
d = D2p - D2n N2 THREE CROP COMBINATIONS = (54.40 – 16.7)2 + (6.46 – 16.7)2 – (4.06 -16.7)2 / (3)2
= (37.7)2 + (-10.24)2 – (-12.64)2 / 9
= 1421.29 + 104.86 – 159.76 /9
= 1366.39 / 9
= 151.82 d = D2p - D2n N2 FOUR CROP COMBINATIONS = (54.40 – 12.5)2 - (6.46 – 12.5)2 – (4.06 – 12.5)2 – (3.24-12.5)2 / (4)2
= (41.9)2 - (-6.04)2 – (-8.44)2 – (-9.26)2 / 16
= 1755.61 + 36.48 – 71.23 – 85.74 / 16
= 1635.12 / 16
= 102.19 Cont….<br>
18
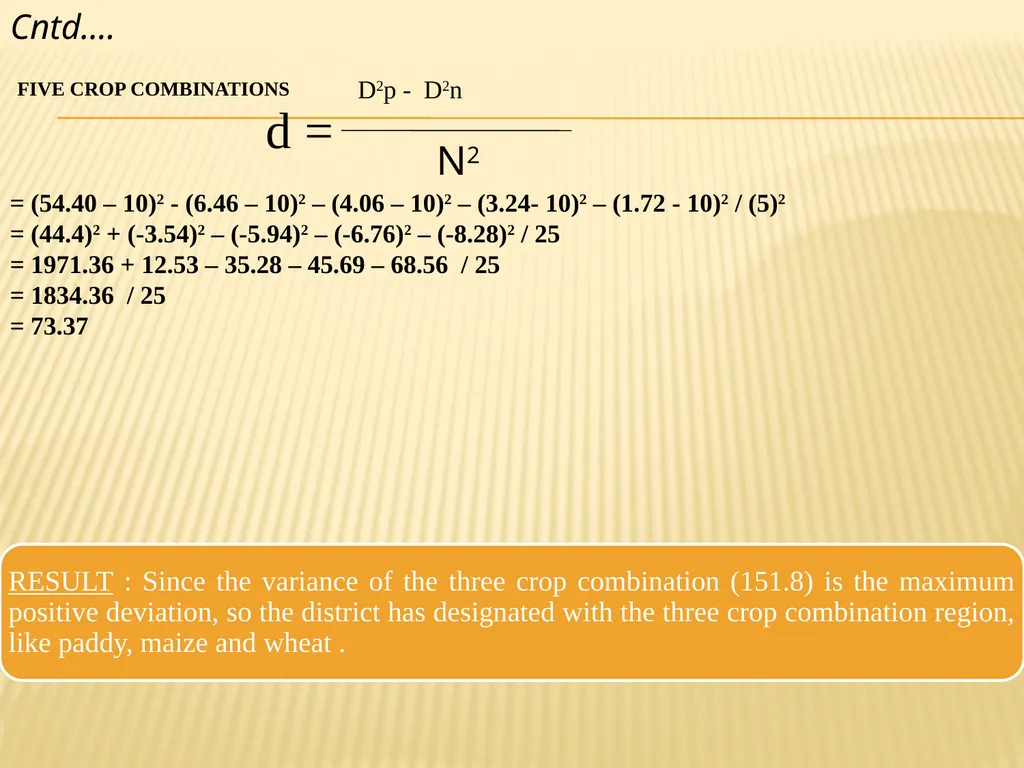
d = D2p - D2n N2 FIVE CROP COMBINATIONS = (54.40 – 10)2 - (6.46 – 10)2 – (4.06 – 10)2 – (3.24- 10)2 – (1.72 - 10)2 / (5)2
= (44.4)2 + (-3.54)2 – (-5.94)2 – (-6.76)2 – (-8.28)2 / 25
= 1971.36 + 12.53 – 35.28 – 45.69 – 68.56 / 25
= 1834.36 / 25
= 73.37 Cntd….<br>
= (44.4)2 + (-3.54)2 – (-5.94)2 – (-6.76)2 – (-8.28)2 / 25
= 1971.36 + 12.53 – 35.28 – 45.69 – 68.56 / 25
= 1834.36 / 25
= 73.37 Cntd….<br>
19
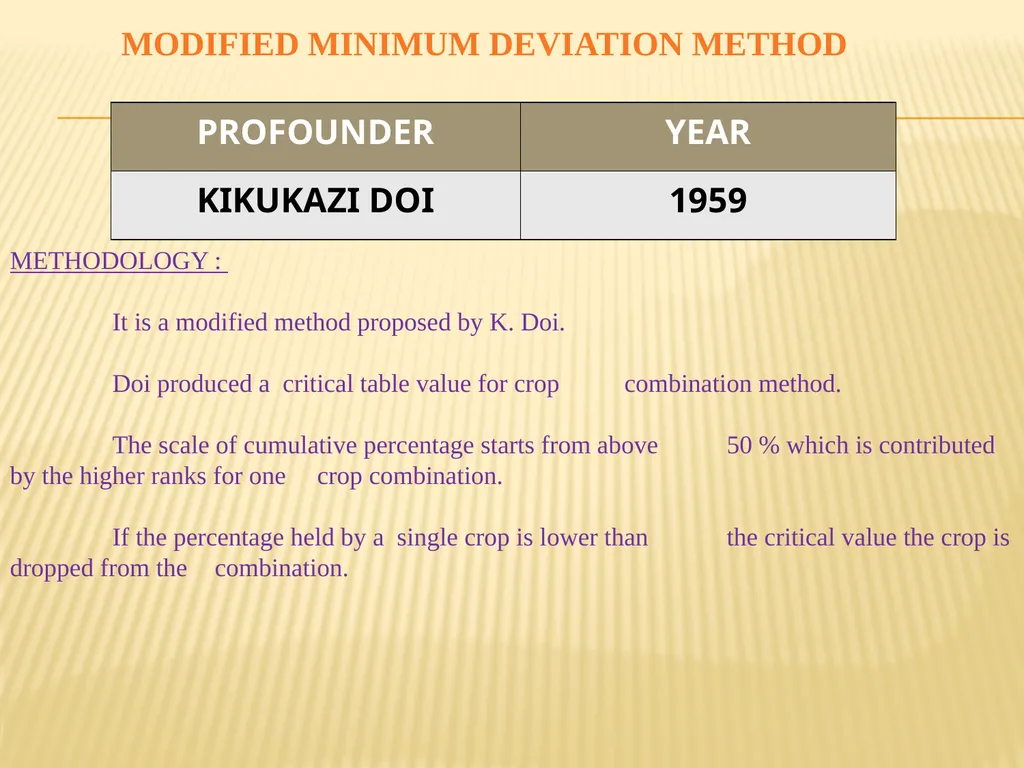
METHODOLOGY :
It is a modified method proposed by K. Doi.
Doi produced a critical table value for crop combination method.
The scale of cumulative percentage starts from above 50 % which is contributed by the higher ranks for one crop combination.
If the percentage held by a single crop is lower than the critical value the crop is dropped from the combination. MODIFIED MINIMUM DEVIATION METHOD<br>
20
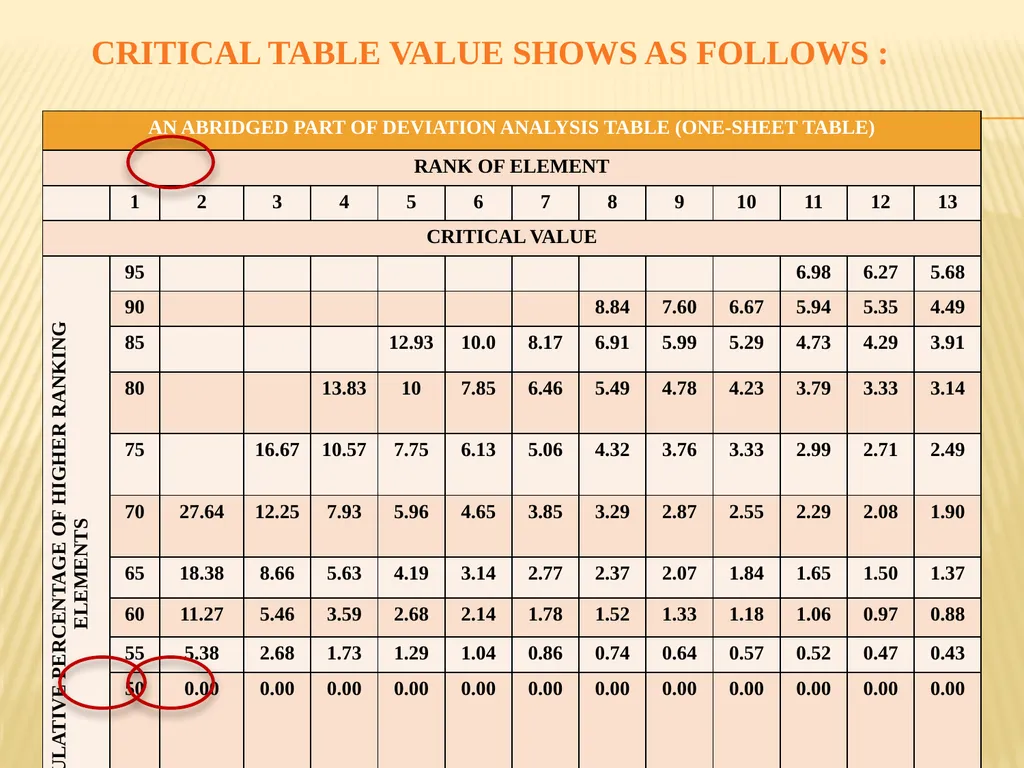
CRITICAL TABLE VALUE SHOWS AS FOLLOWS :<br>
21
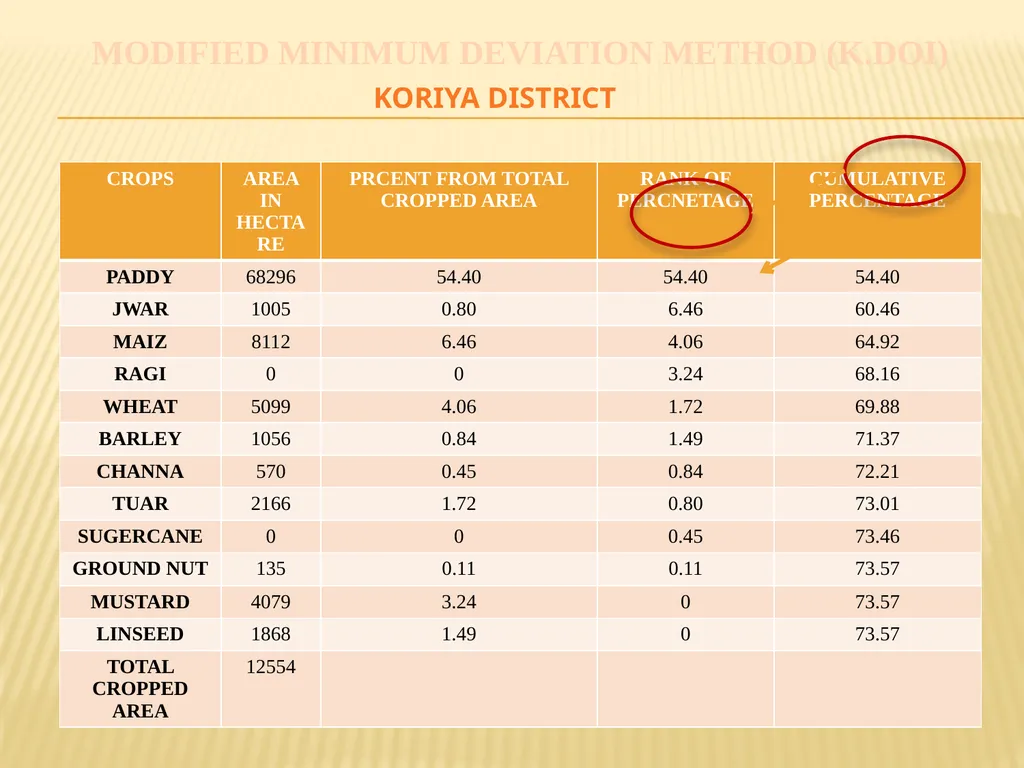
MODIFIED MINIMUM DEVIATION METHOD (K.DOI) KORIYA DISTRICT<br>
22
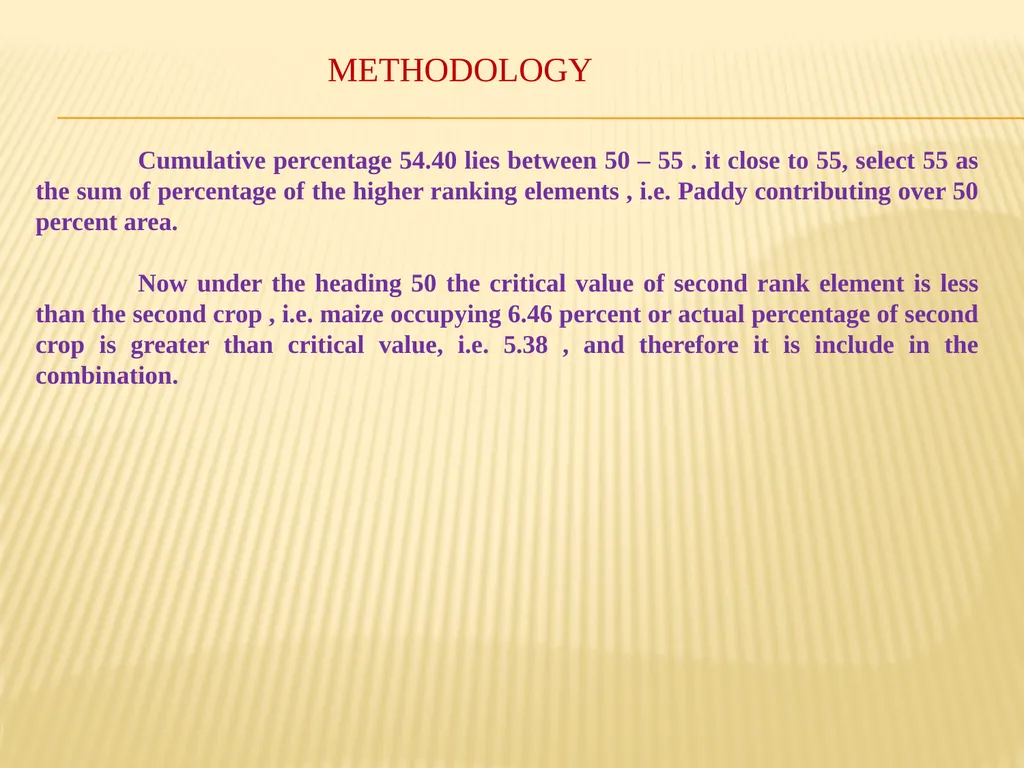
Cumulative percentage 54.40 lies between 50 – 55 . it close to 55, select 55 as the sum of percentage of the higher ranking elements , i.e. Paddy contributing over 50 percent area.
Now under the heading 50 the critical value of second rank element is less than the second crop , i.e. maize occupying 6.46 percent or actual percentage of second crop is greater than critical value, i.e. 5.38 , and therefore it is include in the combination. METHODOLOGY<br>
Now under the heading 50 the critical value of second rank element is less than the second crop , i.e. maize occupying 6.46 percent or actual percentage of second crop is greater than critical value, i.e. 5.38 , and therefore it is include in the combination. METHODOLOGY<br>
23
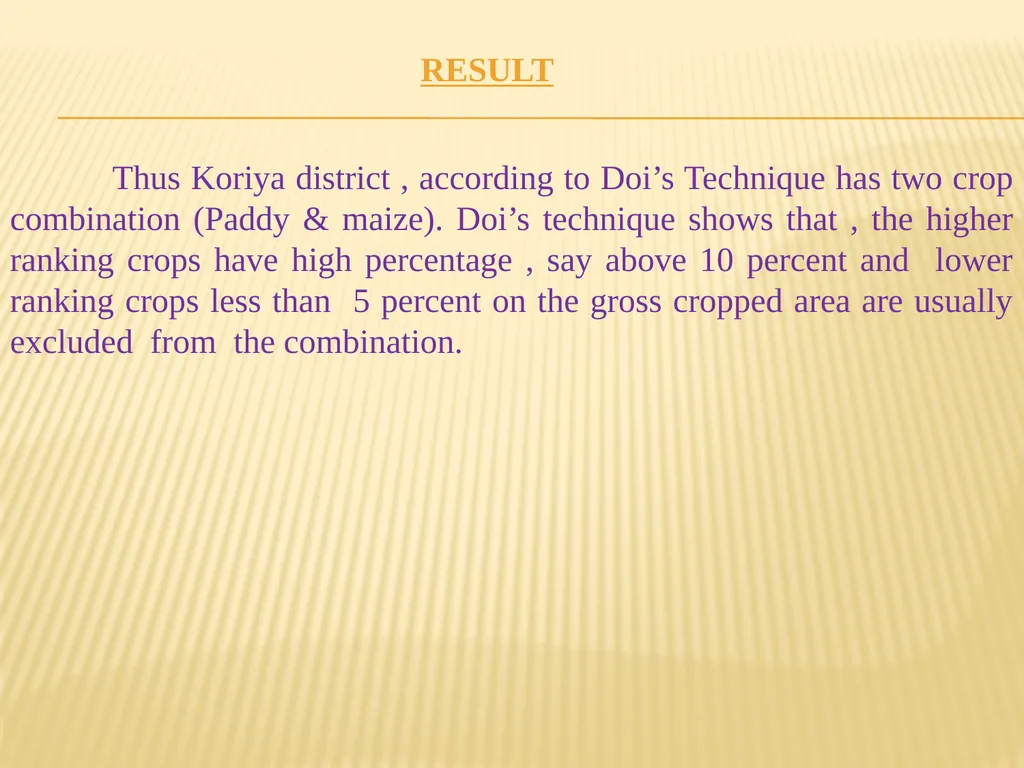
Thus Koriya district , according to Doi’s Technique has two crop combination (Paddy & maize). Doi’s technique shows that , the higher ranking crops have high percentage , say above 10 percent and lower ranking crops less than 5 percent on the gross cropped area are usually excluded from the combination. RESULT<br>
24
METHODOLOGY :
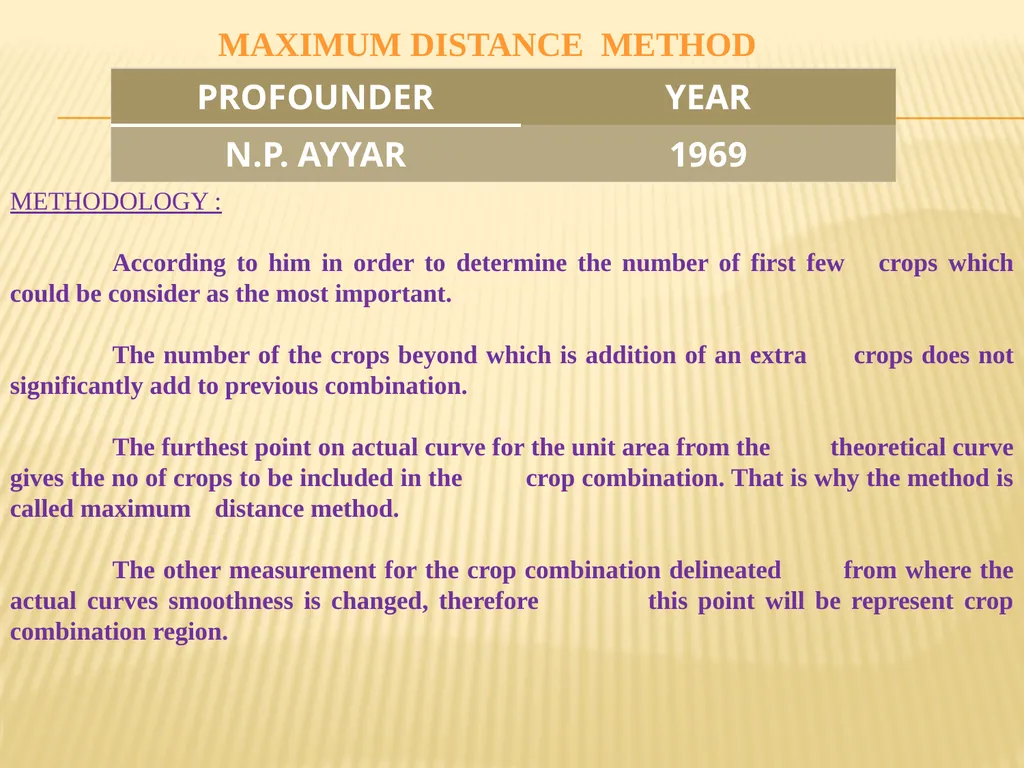
According to him in order to determine the number of first few crops which could be consider as the most important.
The number of the crops beyond which is addition of an extra crops does not significantly add to previous combination.
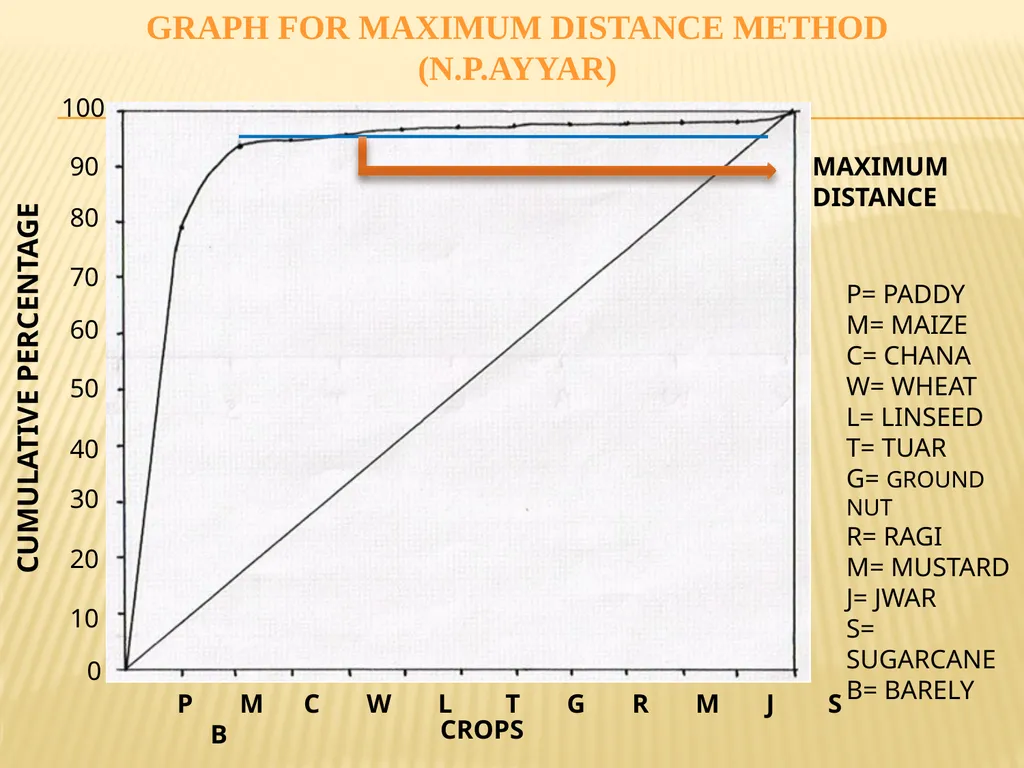
The furthest point on actual curve for the unit area from the theoretical curve gives the no of crops to be included in the crop combination. That is why the method is called maximum distance method.
The other measurement for the crop combination delineated from where the actual curves smoothness is changed, therefore this point will be represent crop combination region. MAXIMUM DISTANCE METHOD<br>
25
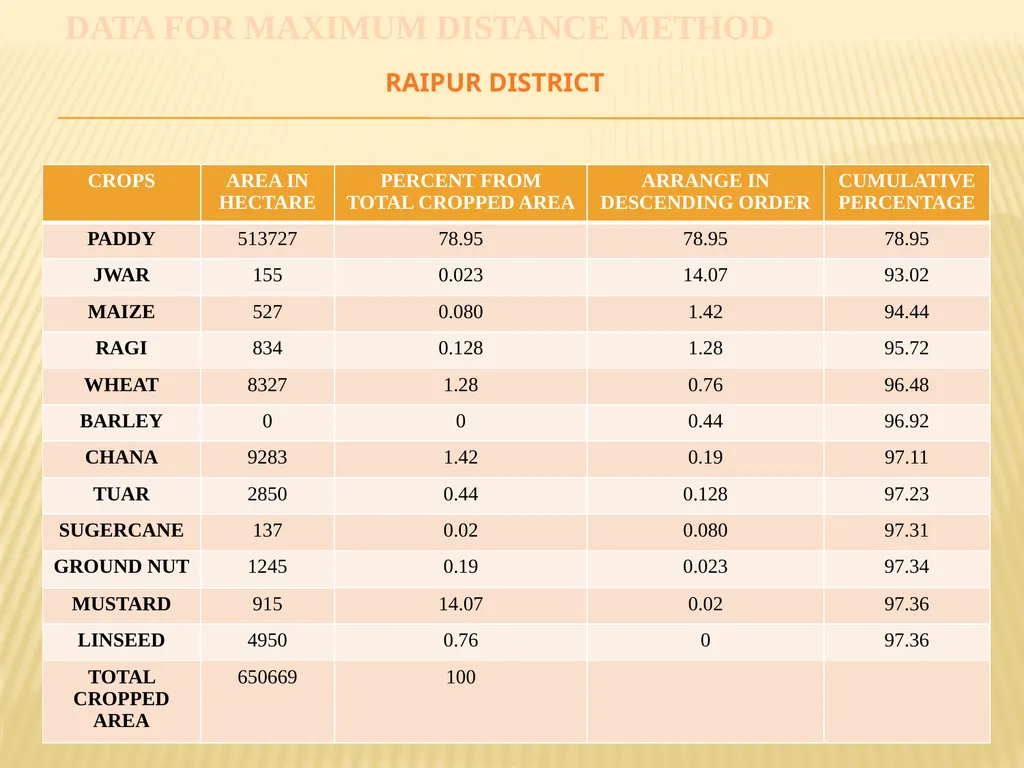
DATA FOR MAXIMUM DISTANCE METHOD RAIPUR DISTRICT<br>
26
10 20 30 40 50 60 70 80 90 100 0 CROPS CUMULATIVE PERCENTAGE P M C W L T G R M J S B MAXIMUM DISTANCE GRAPH FOR MAXIMUM DISTANCE METHOD
(N.P.AYYAR) P= PADDY
M= MAIZE
C= CHANA
W= WHEAT
L= LINSEED
T= TUAR
G= GROUND NUT
R= RAGI
M= MUSTARD
J= JWAR
S= SUGARCANE
B= BARELY<br>
(N.P.AYYAR) P= PADDY
M= MAIZE
C= CHANA
W= WHEAT
L= LINSEED
T= TUAR
G= GROUND NUT
R= RAGI
M= MUSTARD
J= JWAR
S= SUGARCANE
B= BARELY<br>
27
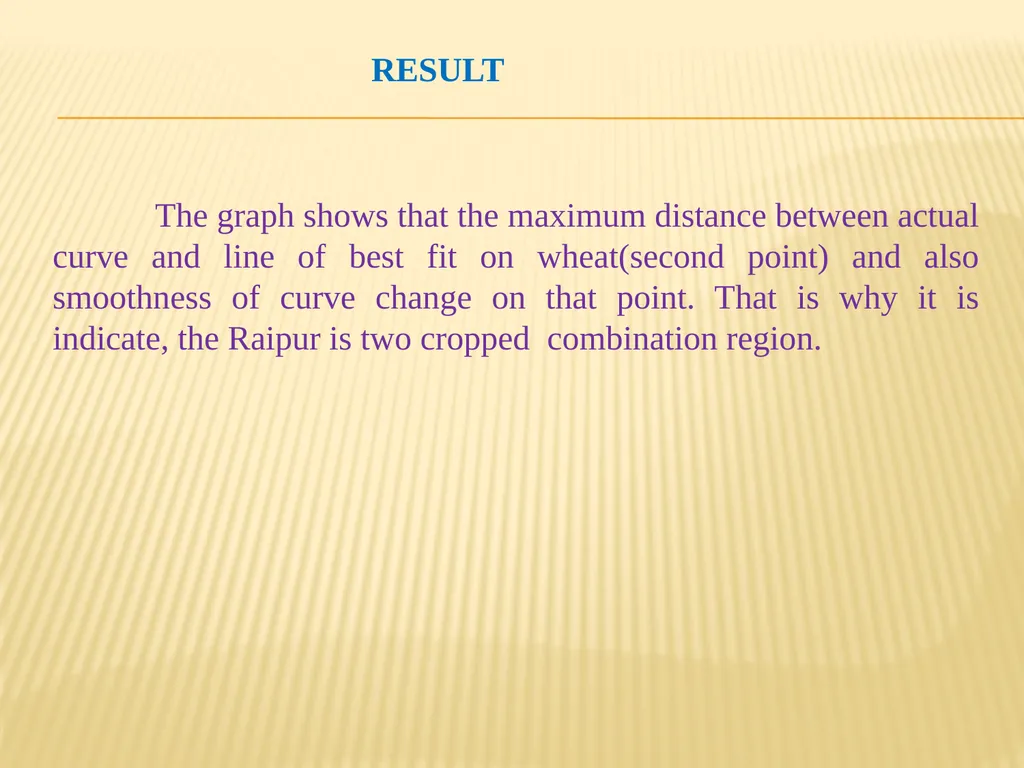
The graph shows that the maximum distance between actual curve and line of best fit on wheat(second point) and also smoothness of curve change on that point. That is why it is indicate, the Raipur is two cropped combination region. RESULT<br>
28
METHODOLOGY:
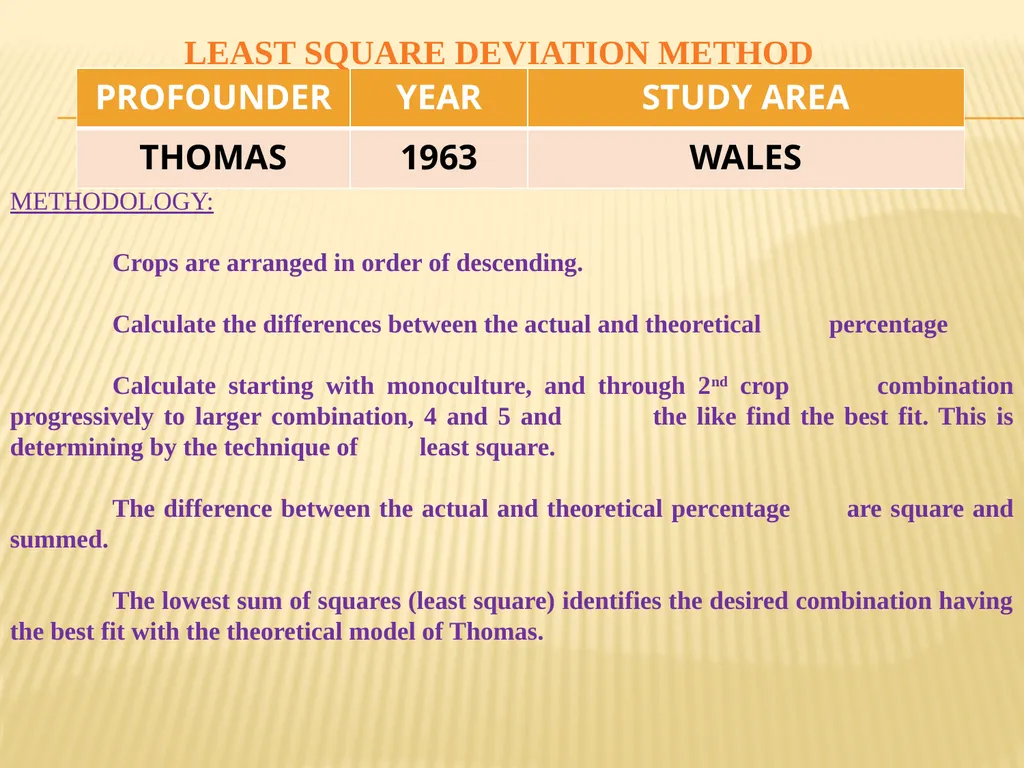
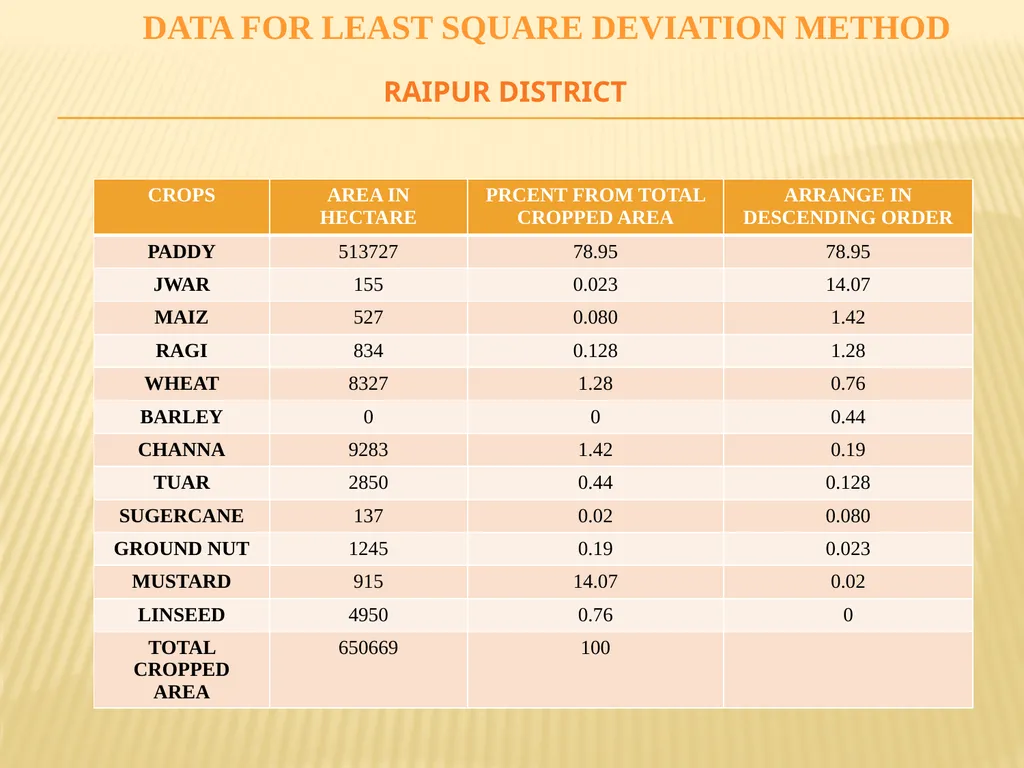
Crops are arranged in order of descending.
Calculate the differences between the actual and theoretical percentage
Calculate starting with monoculture, and through 2nd crop combination progressively to larger combination, 4 and 5 and the like find the best fit. This is determining by the technique of least square.
The difference between the actual and theoretical percentage are square and summed.
The lowest sum of squares (least square) identifies the desired combination having the best fit with the theoretical model of Thomas. LEAST SQUARE DEVIATION METHOD<br>
29
THEORITICAL VALUE TABLE<br>
30
DATA FOR LEAST SQUARE DEVIATION METHOD RAIPUR DISTRICT<br>
31
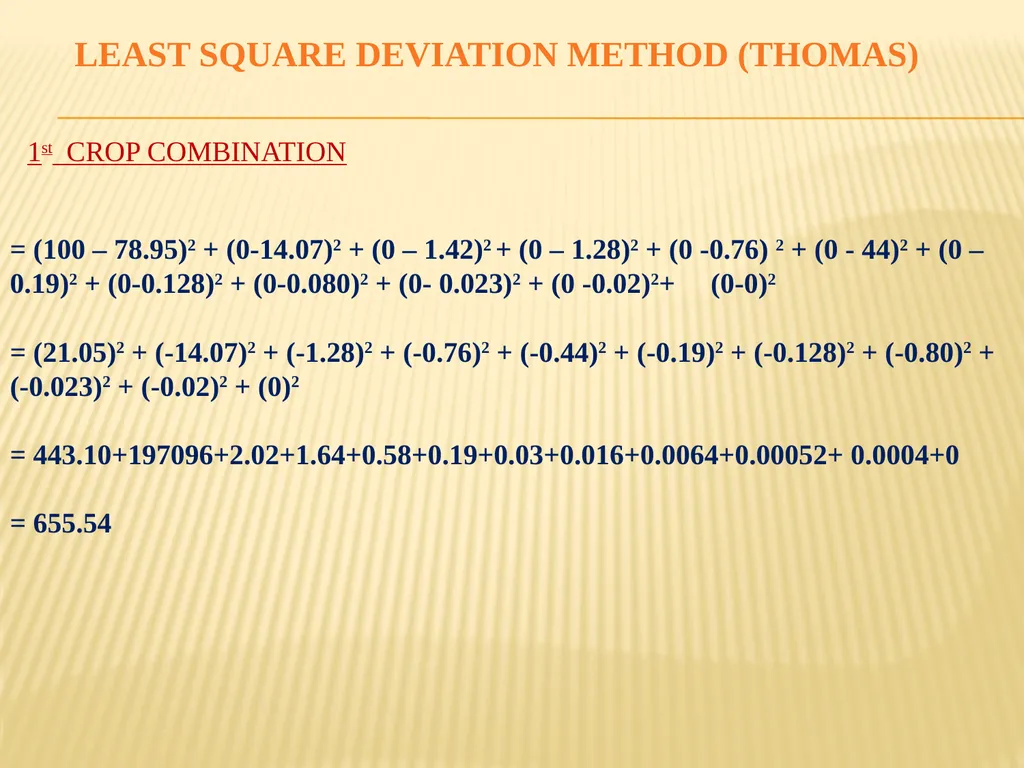
1st CROP COMBINATION = (100 – 78.95)2 + (0-14.07)2 + (0 – 1.42)2 + (0 – 1.28)2 + (0 -0.76) 2 + (0 - 44)2 + (0 – 0.19)2 + (0-0.128)2 + (0-0.080)2 + (0- 0.023)2 + (0 -0.02)2+ (0-0)2
= (21.05)2 + (-14.07)2 + (-1.28)2 + (-0.76)2 + (-0.44)2 + (-0.19)2 + (-0.128)2 + (-0.80)2 + (-0.023)2 + (-0.02)2 + (0)2
= 443.10+197096+2.02+1.64+0.58+0.19+0.03+0.016+0.0064+0.00052+ 0.0004+0
= 655.54 LEAST SQUARE DEVIATION METHOD (THOMAS)<br>
= (21.05)2 + (-14.07)2 + (-1.28)2 + (-0.76)2 + (-0.44)2 + (-0.19)2 + (-0.128)2 + (-0.80)2 + (-0.023)2 + (-0.02)2 + (0)2
= 443.10+197096+2.02+1.64+0.58+0.19+0.03+0.016+0.0064+0.00052+ 0.0004+0
= 655.54 LEAST SQUARE DEVIATION METHOD (THOMAS)<br>
32
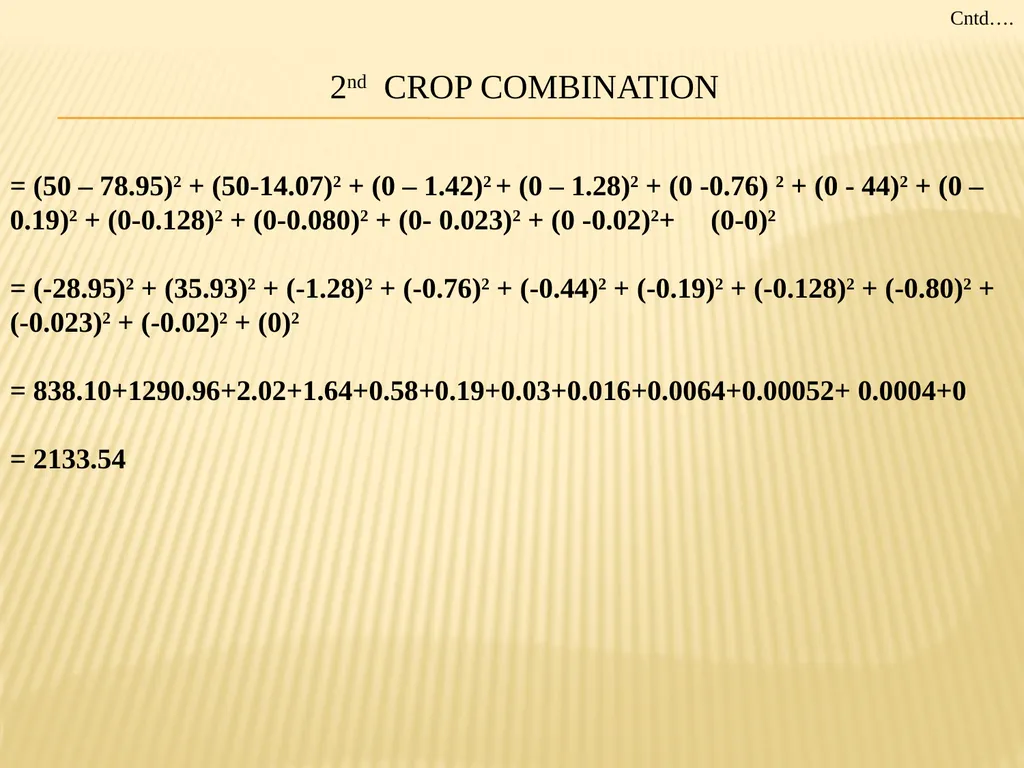
= (50 – 78.95)2 + (50-14.07)2 + (0 – 1.42)2 + (0 – 1.28)2 + (0 -0.76) 2 + (0 - 44)2 + (0 – 0.19)2 + (0-0.128)2 + (0-0.080)2 + (0- 0.023)2 + (0 -0.02)2+ (0-0)2
= (-28.95)2 + (35.93)2 + (-1.28)2 + (-0.76)2 + (-0.44)2 + (-0.19)2 + (-0.128)2 + (-0.80)2 + (-0.023)2 + (-0.02)2 + (0)2
= 838.10+1290.96+2.02+1.64+0.58+0.19+0.03+0.016+0.0064+0.00052+ 0.0004+0
= 2133.54 2nd CROP COMBINATION Cntd….<br>
= (-28.95)2 + (35.93)2 + (-1.28)2 + (-0.76)2 + (-0.44)2 + (-0.19)2 + (-0.128)2 + (-0.80)2 + (-0.023)2 + (-0.02)2 + (0)2
= 838.10+1290.96+2.02+1.64+0.58+0.19+0.03+0.016+0.0064+0.00052+ 0.0004+0
= 2133.54 2nd CROP COMBINATION Cntd….<br>
33
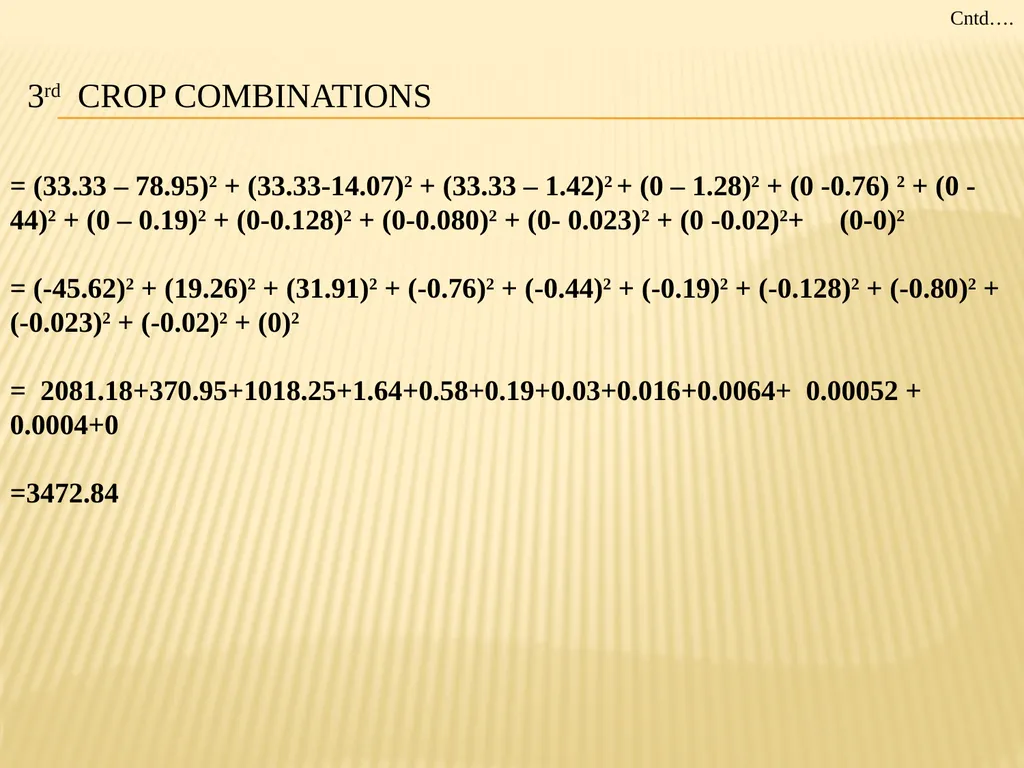
3rd CROP COMBINATIONS = (33.33 – 78.95)2 + (33.33-14.07)2 + (33.33 – 1.42)2 + (0 – 1.28)2 + (0 -0.76) 2 + (0 - 44)2 + (0 – 0.19)2 + (0-0.128)2 + (0-0.080)2 + (0- 0.023)2 + (0 -0.02)2+ (0-0)2
= (-45.62)2 + (19.26)2 + (31.91)2 + (-0.76)2 + (-0.44)2 + (-0.19)2 + (-0.128)2 + (-0.80)2 + (-0.023)2 + (-0.02)2 + (0)2
= 2081.18+370.95+1018.25+1.64+0.58+0.19+0.03+0.016+0.0064+ 0.00052 + 0.0004+0
=3472.84 Cntd….<br>
= (-45.62)2 + (19.26)2 + (31.91)2 + (-0.76)2 + (-0.44)2 + (-0.19)2 + (-0.128)2 + (-0.80)2 + (-0.023)2 + (-0.02)2 + (0)2
= 2081.18+370.95+1018.25+1.64+0.58+0.19+0.03+0.016+0.0064+ 0.00052 + 0.0004+0
=3472.84 Cntd….<br>
34
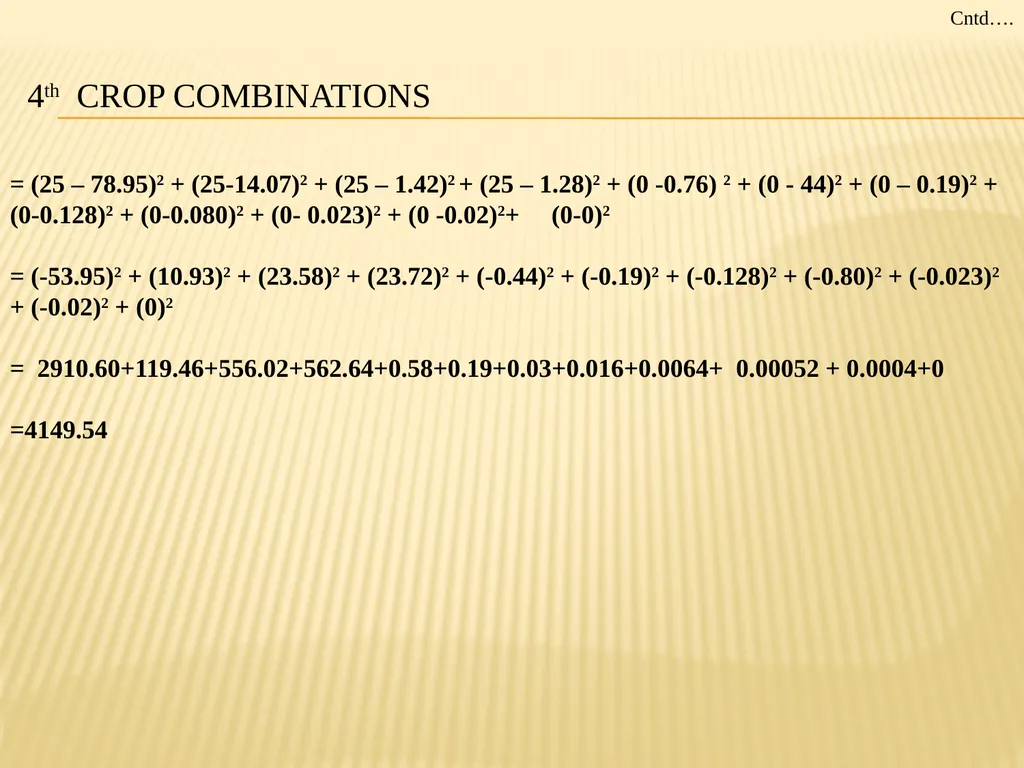
= (25 – 78.95)2 + (25-14.07)2 + (25 – 1.42)2 + (25 – 1.28)2 + (0 -0.76) 2 + (0 - 44)2 + (0 – 0.19)2 + (0-0.128)2 + (0-0.080)2 + (0- 0.023)2 + (0 -0.02)2+ (0-0)2
= (-53.95)2 + (10.93)2 + (23.58)2 + (23.72)2 + (-0.44)2 + (-0.19)2 + (-0.128)2 + (-0.80)2 + (-0.023)2 + (-0.02)2 + (0)2
= 2910.60+119.46+556.02+562.64+0.58+0.19+0.03+0.016+0.0064+ 0.00052 + 0.0004+0
=4149.54 4th CROP COMBINATIONS Cntd….<br>
= (-53.95)2 + (10.93)2 + (23.58)2 + (23.72)2 + (-0.44)2 + (-0.19)2 + (-0.128)2 + (-0.80)2 + (-0.023)2 + (-0.02)2 + (0)2
= 2910.60+119.46+556.02+562.64+0.58+0.19+0.03+0.016+0.0064+ 0.00052 + 0.0004+0
=4149.54 4th CROP COMBINATIONS Cntd….<br>
35
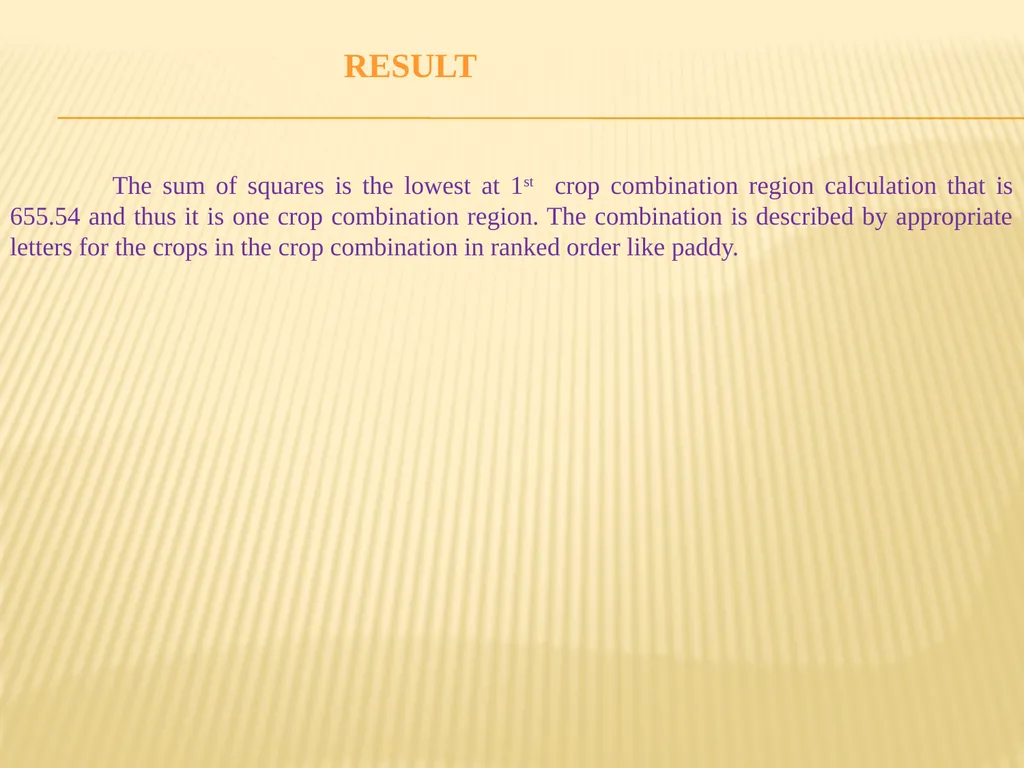
The sum of squares is the lowest at 1st crop combination region calculation that is 655.54 and thus it is one crop combination region. The combination is described by appropriate letters for the crops in the crop combination in ranked order like paddy. RESULT<br>
36
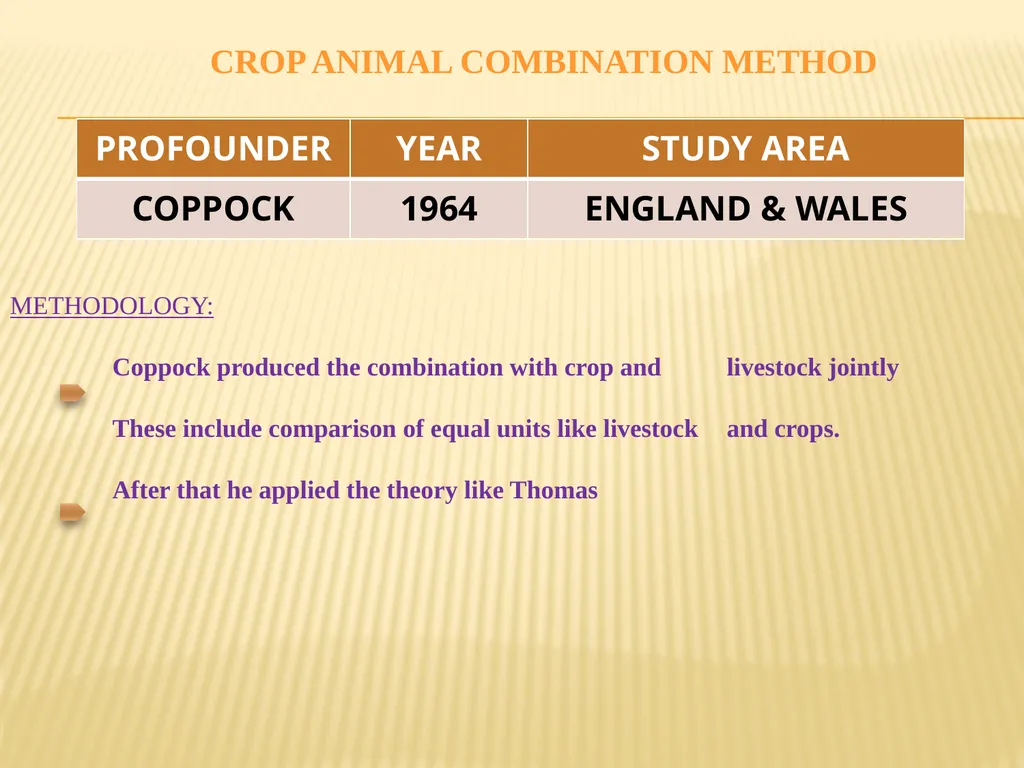
METHODOLOGY:
Coppock produced the combination with crop and livestock jointly
These include comparison of equal units like livestock and crops.
After that he applied the theory like Thomas CROP ANIMAL COMBINATION METHOD<br>
Coppock produced the combination with crop and livestock jointly
These include comparison of equal units like livestock and crops.
After that he applied the theory like Thomas CROP ANIMAL COMBINATION METHOD<br>