
Social Adult Day Services – 2017 New York State
CB
Published · 40 slides · 0 views

1 / 1
Description
Social Adult Day Services 2017 New York State Adult Day Services Association 2017 Annual Conference NYSOFA Mission The mission of the New York State Office for the Aging is to help older New Yorkers to be as independent as possible for
Related Topics
Share
Embed code
Download this presentation From Below
"Social Adult Day Services – 2017 New York State" is the property of its rightful owner. Permission is granted to download and print the materials on this website for personal, non-commercial use only, and to display it on your personal computer provided you do not modify the materials and that you retain all copyright notices contained in the materials. By downloading content from our website, you accept the terms of this agreement.
Presentation Transcript
01
Social Adult Day Services – 2017 New York State Adult Day Services Association –
2017 Annual Conference<br>
2017 Annual Conference<br>
02
NYSOFA Mission The mission of the New York State Office for the Aging is to help older New Yorkers to be as independent as possible for as long as possible through advocacy, the development and delivery of person-centered, consumer-oriented, and cost-effective policies, programs and services which support and empower older New Yorkers and their families, in partnership with the network of public and private organizations which serve
NYSOFA is an Executive Agency, authorized under the federal Older Americans Act and NYS Elder Law<br>
NYSOFA is an Executive Agency, authorized under the federal Older Americans Act and NYS Elder Law<br>
03
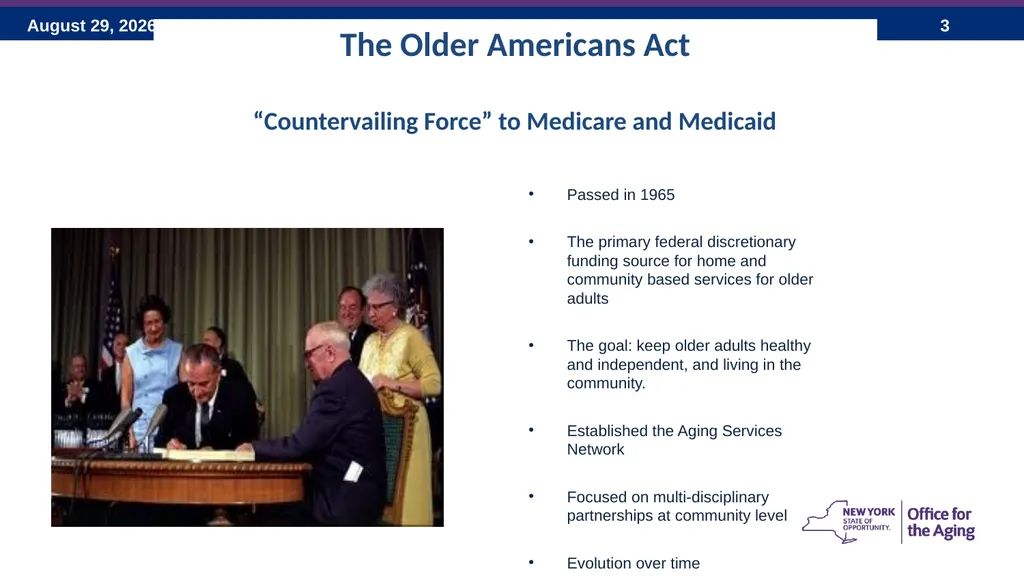
Passed in 1965
The primary federal discretionary funding source for home and community based services for older adults
The goal: keep older adults healthy and independent, and living in the community.
Established the Aging Services Network
Focused on multi-disciplinary partnerships at community level
Evolution over time The Older Americans Act
“Countervailing Force” to Medicare and Medicaid<br>
04
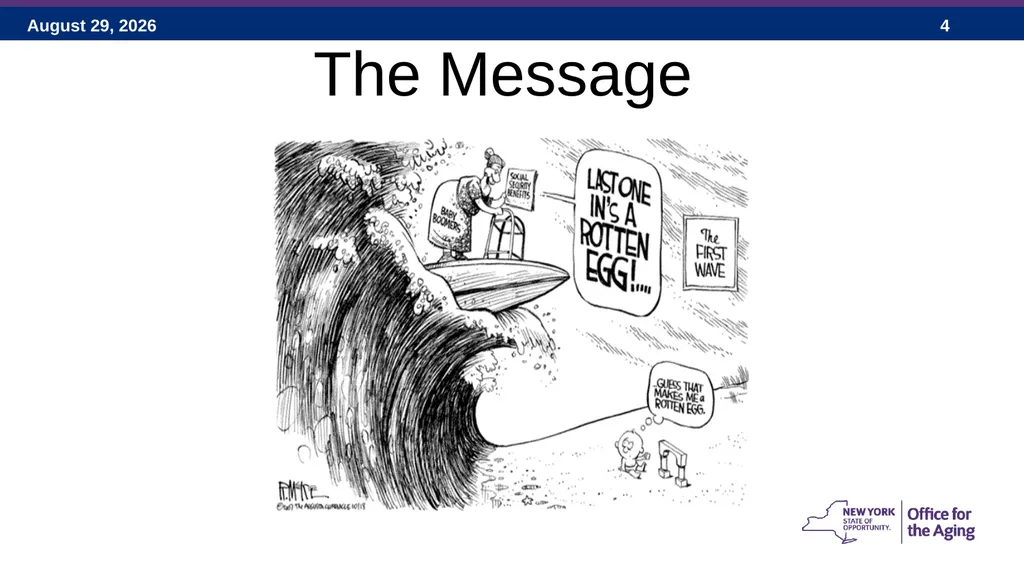
The Message<br>
05
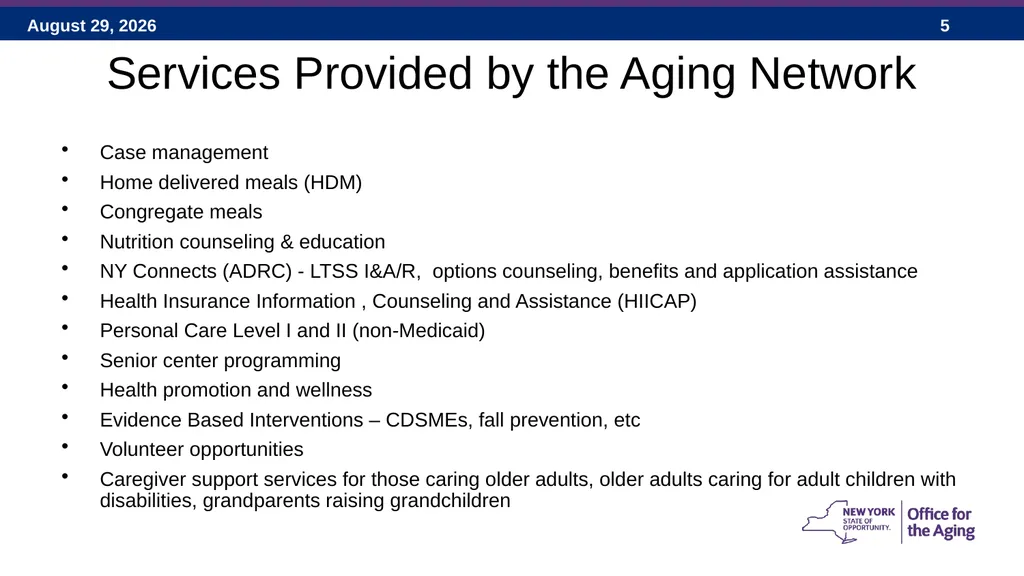
Services Provided by the Aging Network Case management
Home delivered meals (HDM)
Congregate meals
Nutrition counseling & education
NY Connects (ADRC) - LTSS I&A/R, options counseling, benefits and application assistance
Health Insurance Information , Counseling and Assistance (HIICAP)
Personal Care Level I and II (non-Medicaid)
Senior center programming
Health promotion and wellness
Evidence Based Interventions – CDSMEs, fall prevention, etc
Volunteer opportunities
Caregiver support services for those caring older adults, older adults caring for adult children with disabilities, grandparents raising grandchildren<br>
06
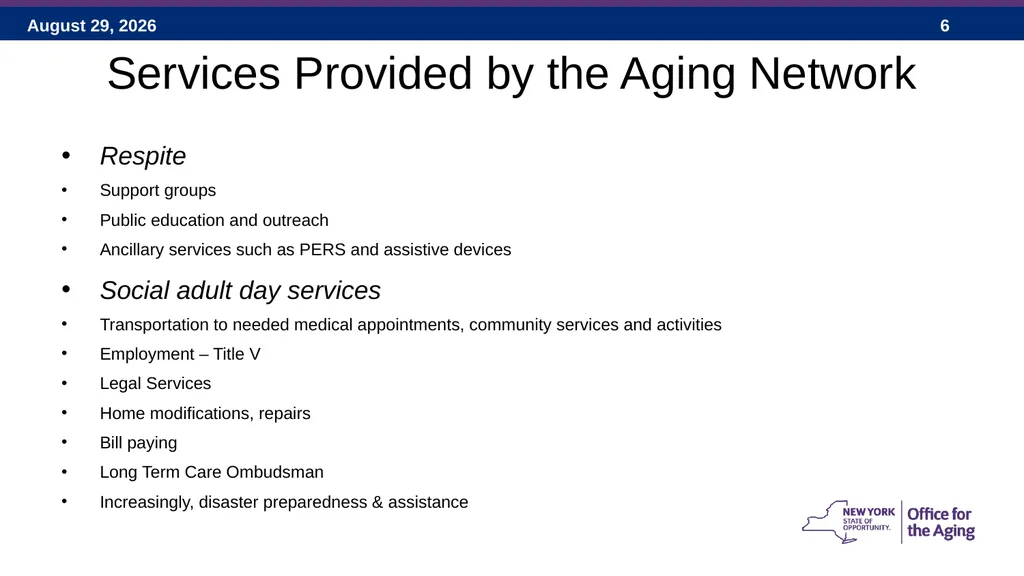
Services Provided by the Aging Network Respite
Support groups
Public education and outreach
Ancillary services such as PERS and assistive devices
Social adult day services
Transportation to needed medical appointments, community services and activities
Employment – Title V
Legal Services
Home modifications, repairs
Bill paying
Long Term Care Ombudsman
Increasingly, disaster preparedness & assistance<br>
07
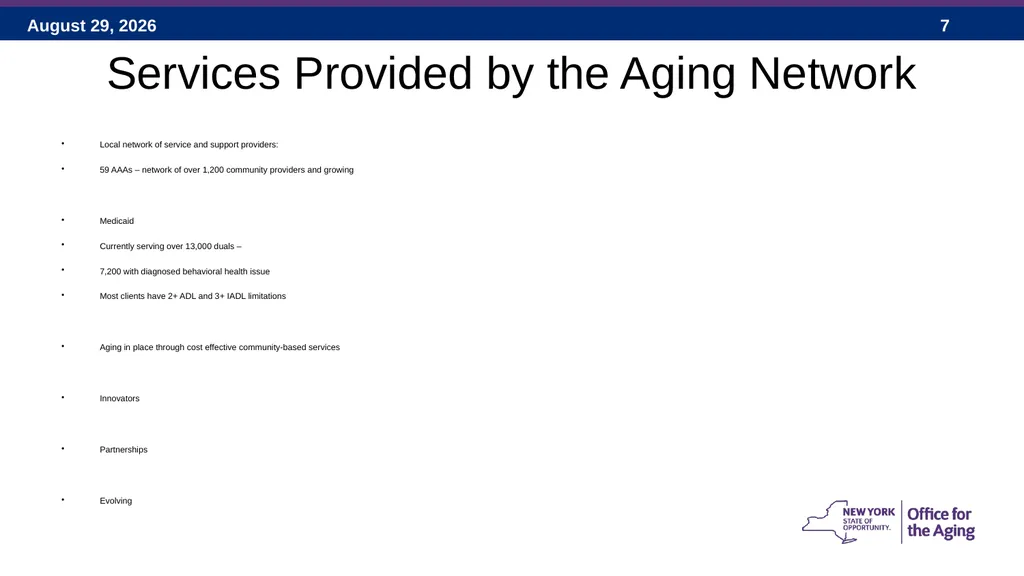
Services Provided by the Aging Network Local network of service and support providers:
59 AAAs – network of over 1,200 community providers and growing
Medicaid
Currently serving over 13,000 duals –
7,200 with diagnosed behavioral health issue
Most clients have 2+ ADL and 3+ IADL limitations
Aging in place through cost effective community-based services
Innovators
Partnerships
Evolving<br>
08
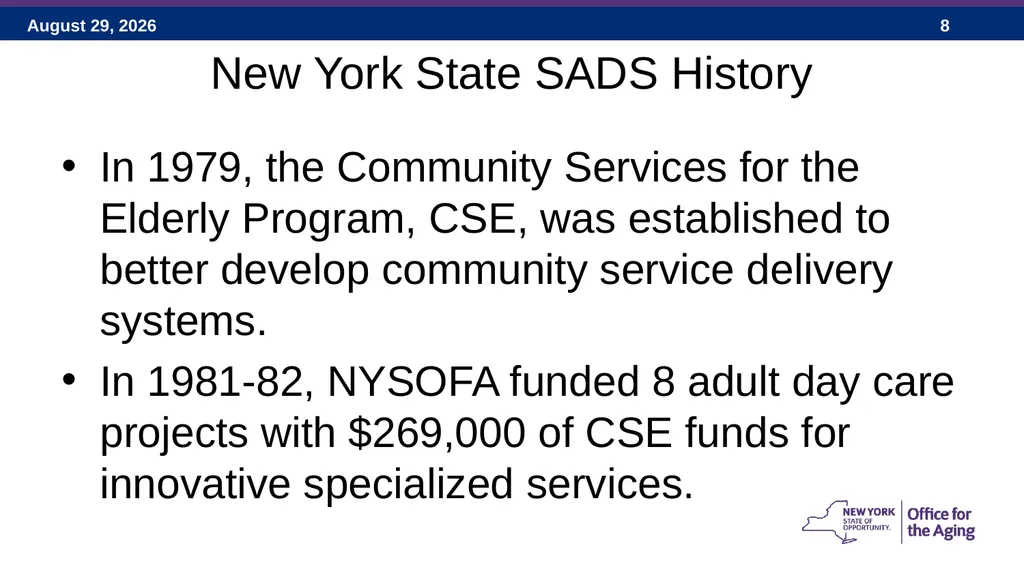
New York State SADS History In 1979, the Community Services for the Elderly Program, CSE, was established to better develop community service delivery systems.
In 1981-82, NYSOFA funded 8 adult day care projects with $269,000 of CSE funds for innovative specialized services.<br>
In 1981-82, NYSOFA funded 8 adult day care projects with $269,000 of CSE funds for innovative specialized services.<br>
09
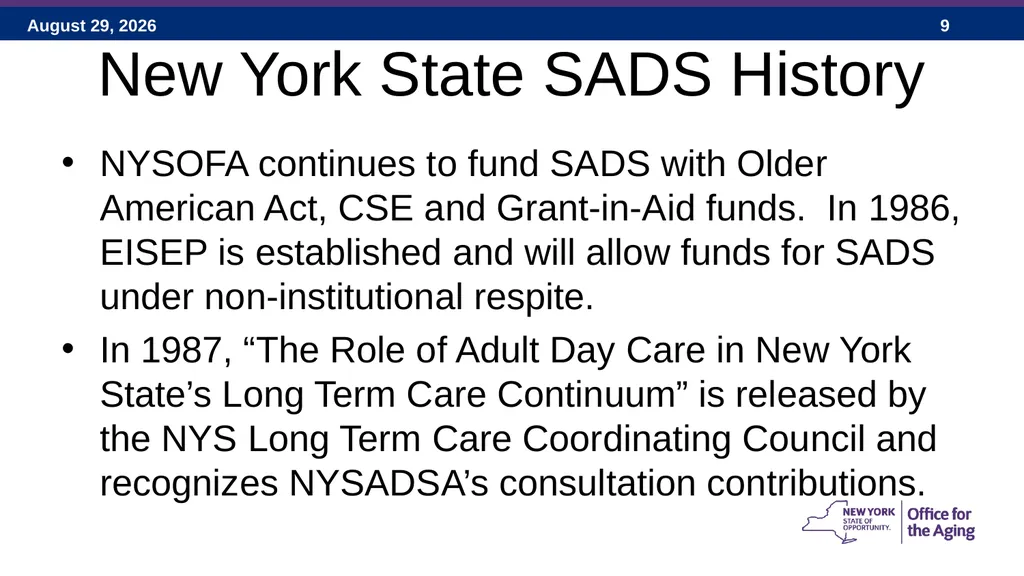
New York State SADS History NYSOFA continues to fund SADS with Older American Act, CSE and Grant-in-Aid funds. In 1986, EISEP is established and will allow funds for SADS under non-institutional respite.
In 1987, “The Role of Adult Day Care in New York State’s Long Term Care Continuum” is released by the NYS Long Term Care Coordinating Council and recognizes NYSADSA’s consultation contributions.<br>
In 1987, “The Role of Adult Day Care in New York State’s Long Term Care Continuum” is released by the NYS Long Term Care Coordinating Council and recognizes NYSADSA’s consultation contributions.<br>
10
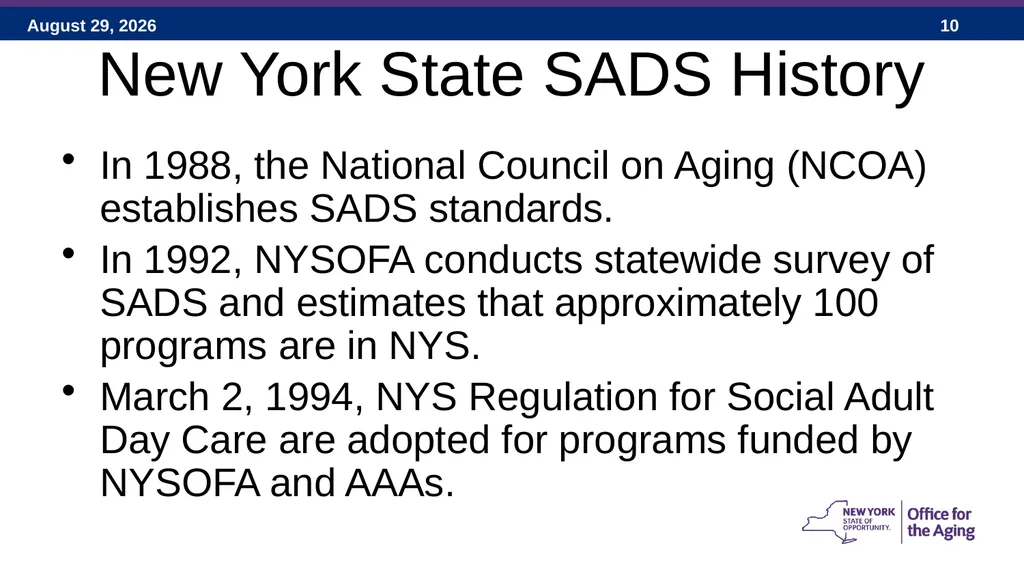
New York State SADS History In 1988, the National Council on Aging (NCOA) establishes SADS standards.
In 1992, NYSOFA conducts statewide survey of SADS and estimates that approximately 100 programs are in NYS.
March 2, 1994, NYS Regulation for Social Adult Day Care are adopted for programs funded by NYSOFA and AAAs.<br>
In 1992, NYSOFA conducts statewide survey of SADS and estimates that approximately 100 programs are in NYS.
March 2, 1994, NYS Regulation for Social Adult Day Care are adopted for programs funded by NYSOFA and AAAs.<br>
11
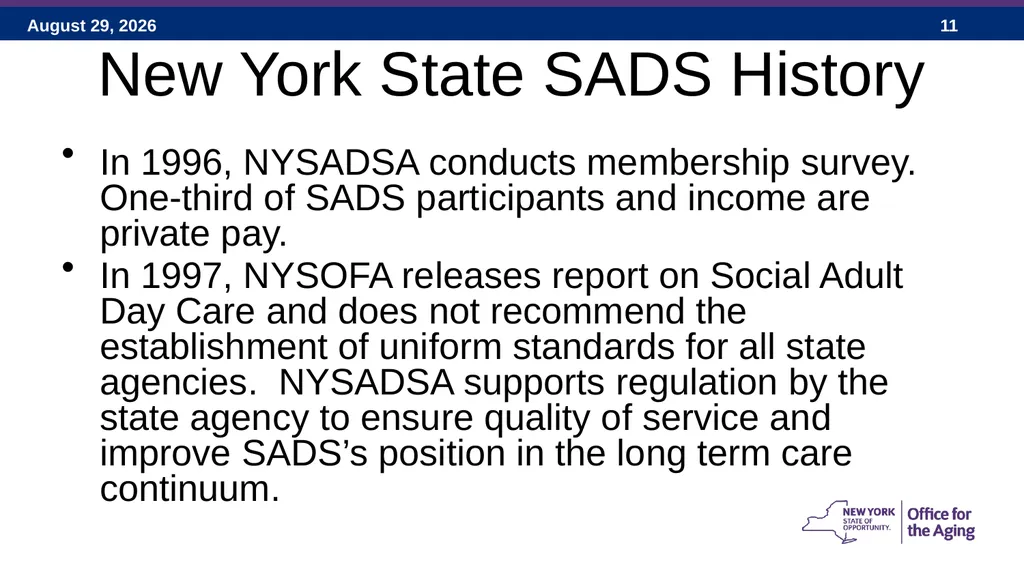
New York State SADS History In 1996, NYSADSA conducts membership survey. One-third of SADS participants and income are private pay.
In 1997, NYSOFA releases report on Social Adult Day Care and does not recommend the establishment of uniform standards for all state agencies. NYSADSA supports regulation by the state agency to ensure quality of service and improve SADS’s position in the long term care continuum.<br>
In 1997, NYSOFA releases report on Social Adult Day Care and does not recommend the establishment of uniform standards for all state agencies. NYSADSA supports regulation by the state agency to ensure quality of service and improve SADS’s position in the long term care continuum.<br>
12
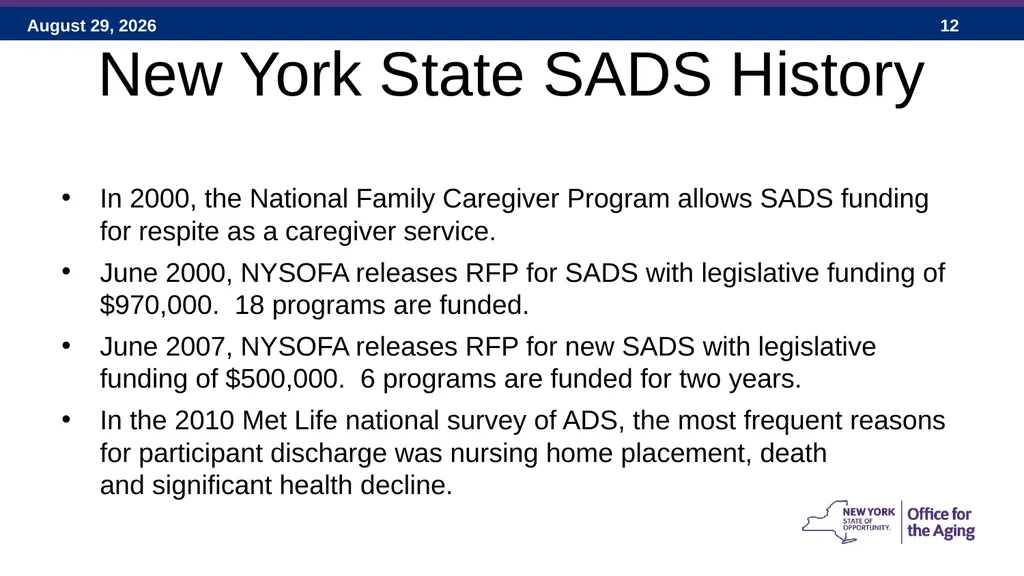
New York State SADS History In 2000, the National Family Caregiver Program allows SADS funding for respite as a caregiver service.
June 2000, NYSOFA releases RFP for SADS with legislative funding of $970,000. 18 programs are funded.
June 2007, NYSOFA releases RFP for new SADS with legislative funding of $500,000. 6 programs are funded for two years.
In the 2010 Met Life national survey of ADS, the most frequent reasons for participant discharge was nursing home placement, death and significant health decline.<br>
13
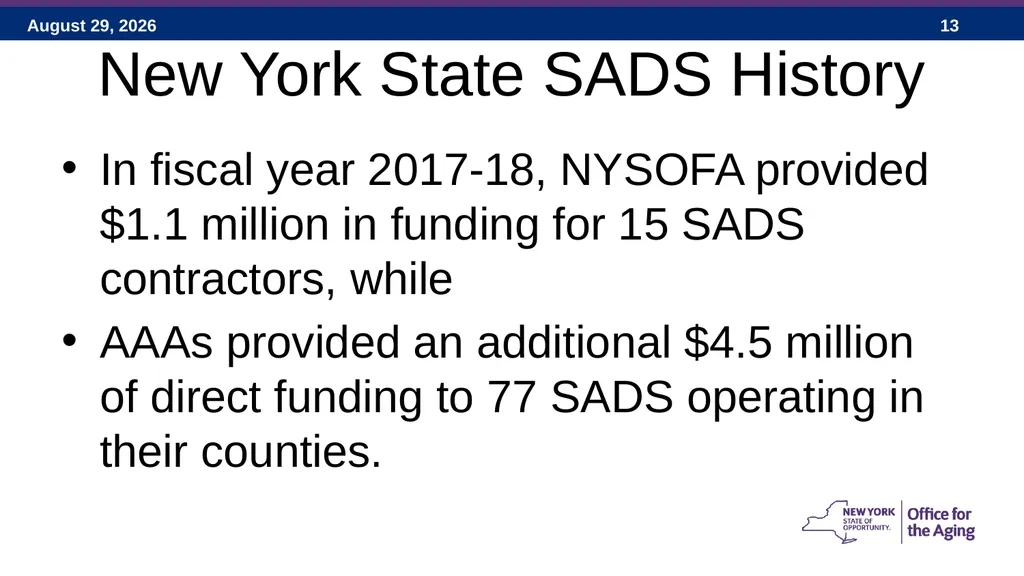
New York State SADS History In fiscal year 2017-18, NYSOFA provided $1.1 million in funding for 15 SADS contractors, while
AAAs provided an additional $4.5 million of direct funding to 77 SADS operating in their counties.<br>
AAAs provided an additional $4.5 million of direct funding to 77 SADS operating in their counties.<br>
14
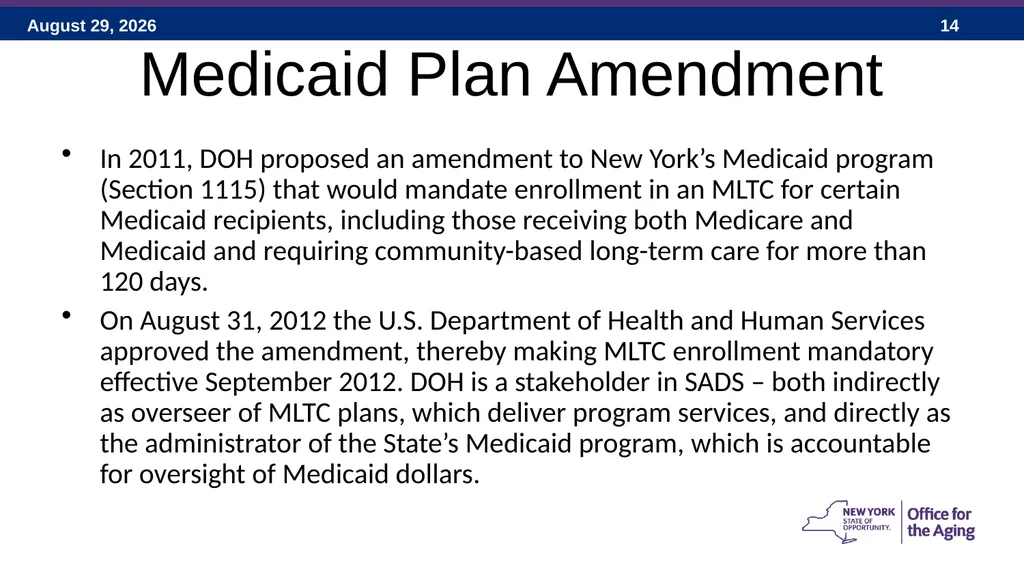
Medicaid Plan Amendment In 2011, DOH proposed an amendment to New York’s Medicaid program (Section 1115) that would mandate enrollment in an MLTC for certain Medicaid recipients, including those receiving both Medicare and Medicaid and requiring community-based long-term care for more than 120 days.
On August 31, 2012 the U.S. Department of Health and Human Services approved the amendment, thereby making MLTC enrollment mandatory effective September 2012. DOH is a stakeholder in SADS – both indirectly as overseer of MLTC plans, which deliver program services, and directly as the administrator of the State’s Medicaid program, which is accountable for oversight of Medicaid dollars.<br>
On August 31, 2012 the U.S. Department of Health and Human Services approved the amendment, thereby making MLTC enrollment mandatory effective September 2012. DOH is a stakeholder in SADS – both indirectly as overseer of MLTC plans, which deliver program services, and directly as the administrator of the State’s Medicaid program, which is accountable for oversight of Medicaid dollars.<br>
15
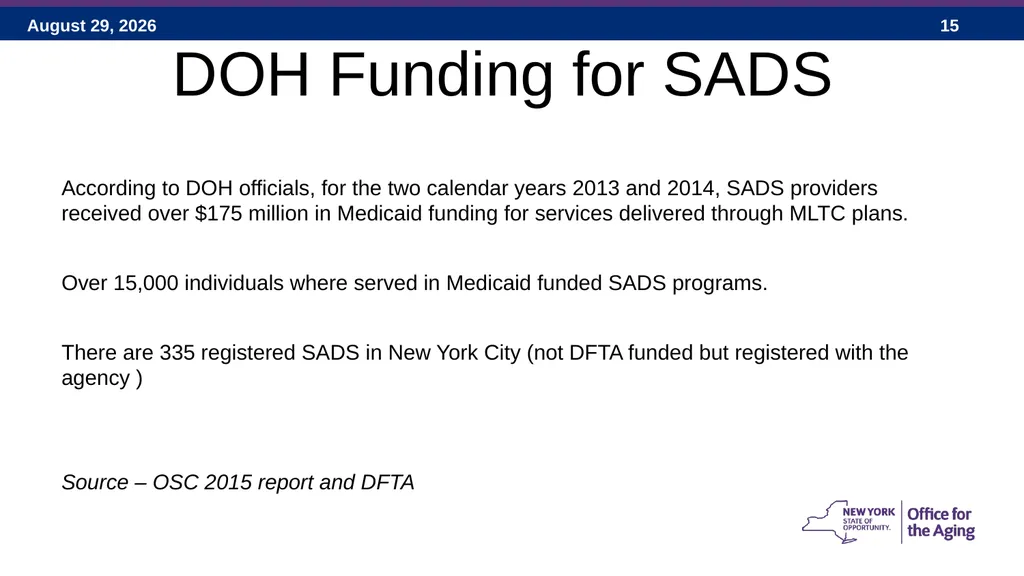
DOH Funding for SADS According to DOH officials, for the two calendar years 2013 and 2014, SADS providers received over $175 million in Medicaid funding for services delivered through MLTC plans.
Over 15,000 individuals where served in Medicaid funded SADS programs.
There are 335 registered SADS in New York City (not DFTA funded but registered with the agency )
Source – OSC 2015 report and DFTA<br>
Over 15,000 individuals where served in Medicaid funded SADS programs.
There are 335 registered SADS in New York City (not DFTA funded but registered with the agency )
Source – OSC 2015 report and DFTA<br>
16
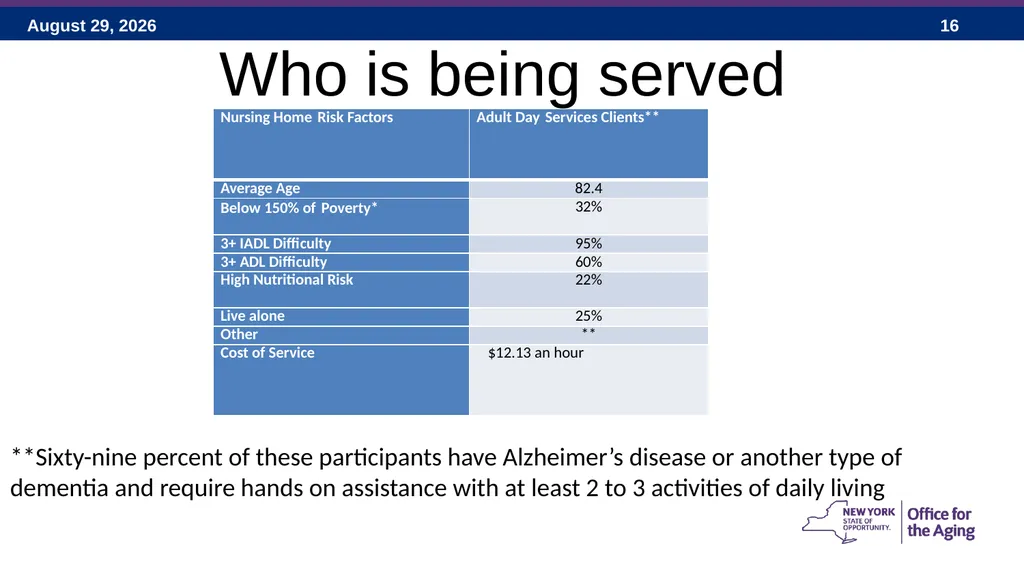
Who is being served **Sixty-nine percent of these participants have Alzheimer’s disease or another type of dementia and require hands on assistance with at least 2 to 3 activities of daily living<br>
17
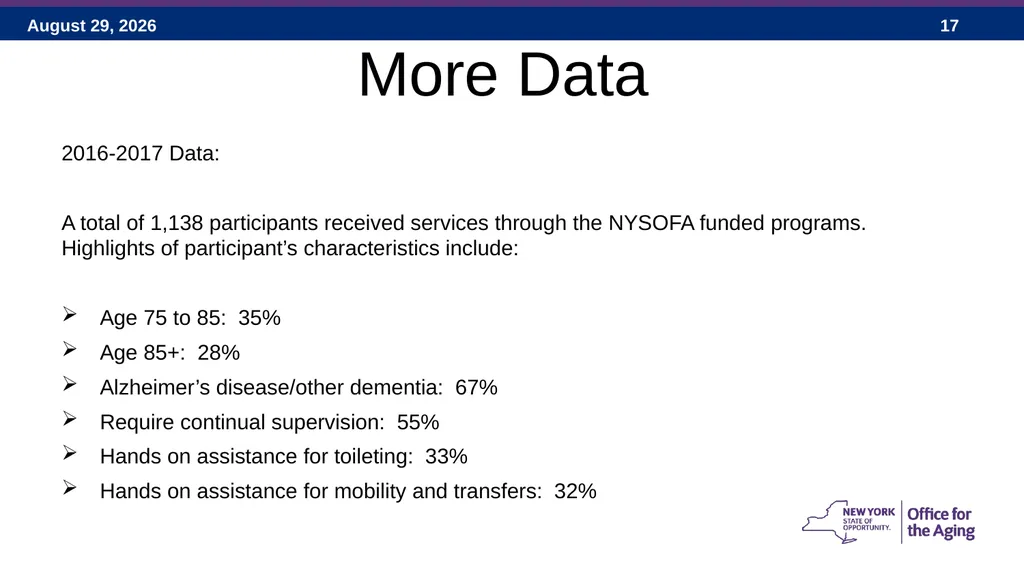
More Data 2016-2017 Data:
A total of 1,138 participants received services through the NYSOFA funded programs. Highlights of participant’s characteristics include:
Age 75 to 85: 35%
Age 85+: 28%
Alzheimer’s disease/other dementia: 67%
Require continual supervision: 55%
Hands on assistance for toileting: 33%
Hands on assistance for mobility and transfers: 32%<br>
18
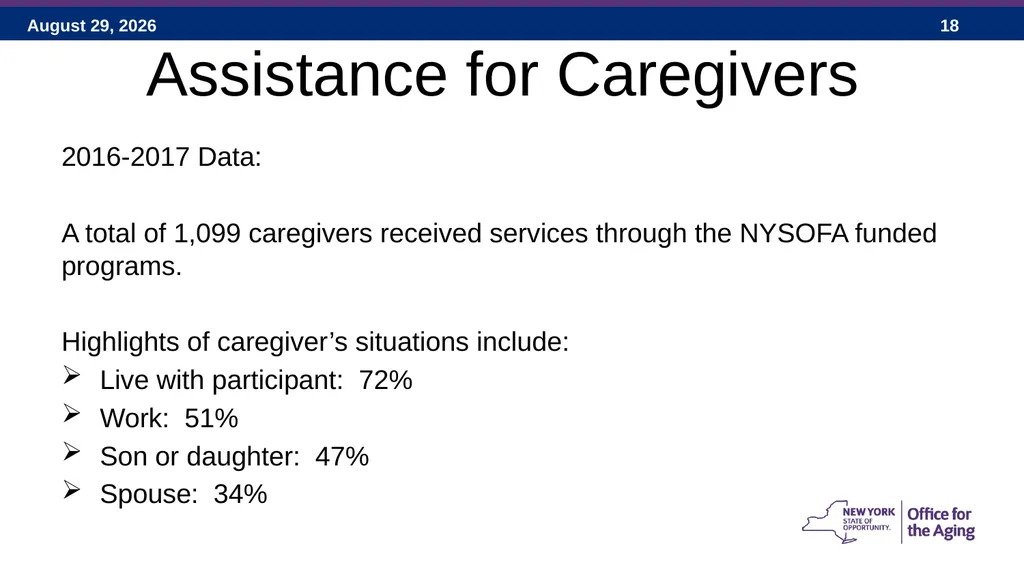
Assistance for Caregivers 2016-2017 Data:
A total of 1,099 caregivers received services through the NYSOFA funded programs.
Highlights of caregiver’s situations include:
Live with participant: 72%
Work: 51%
Son or daughter: 47%
Spouse: 34%<br>
A total of 1,099 caregivers received services through the NYSOFA funded programs.
Highlights of caregiver’s situations include:
Live with participant: 72%
Work: 51%
Son or daughter: 47%
Spouse: 34%<br>
19
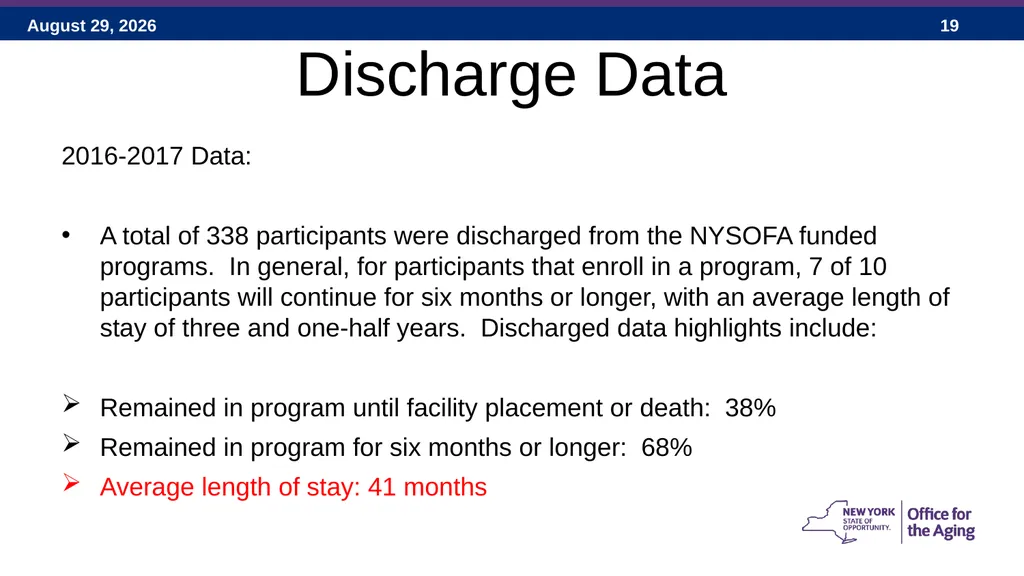
Discharge Data 2016-2017 Data:
A total of 338 participants were discharged from the NYSOFA funded programs. In general, for participants that enroll in a program, 7 of 10 participants will continue for six months or longer, with an average length of stay of three and one-half years. Discharged data highlights include:
Remained in program until facility placement or death: 38%
Remained in program for six months or longer: 68%
Average length of stay: 41 months<br>
20
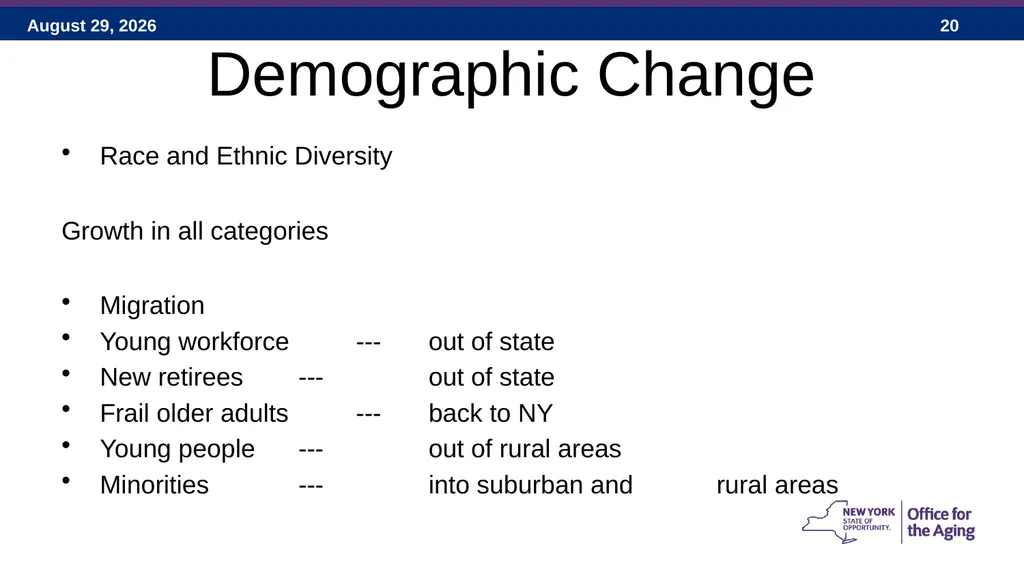
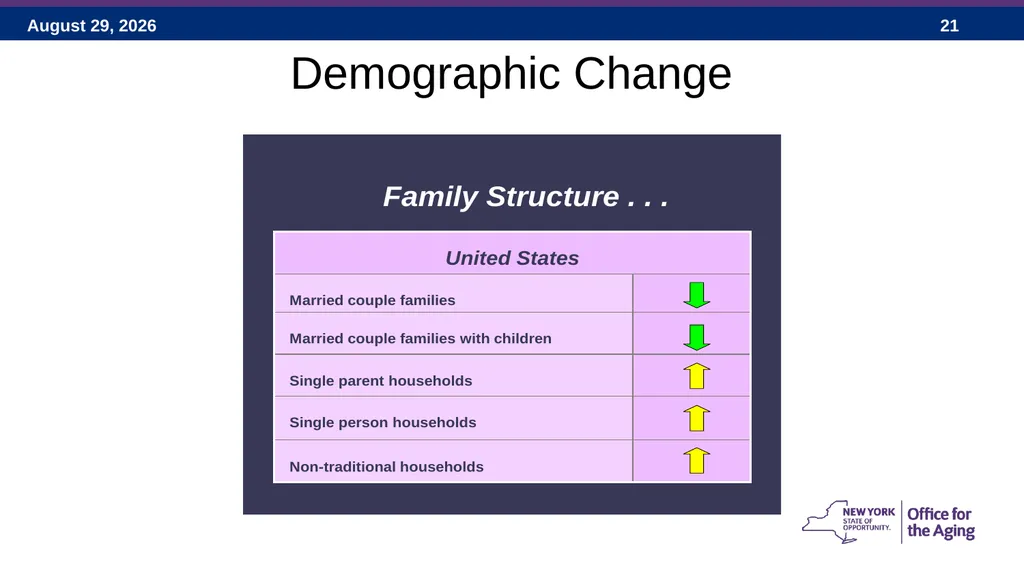
Demographic Change Race and Ethnic Diversity
Growth in all categories
Migration
Young workforce --- out of state
New retirees --- out of state
Frail older adults --- back to NY
Young people --- out of rural areas
Minorities --- into suburban and rural areas<br>
Growth in all categories
Migration
Young workforce --- out of state
New retirees --- out of state
Frail older adults --- back to NY
Young people --- out of rural areas
Minorities --- into suburban and rural areas<br>
21
Demographic Change<br>
22
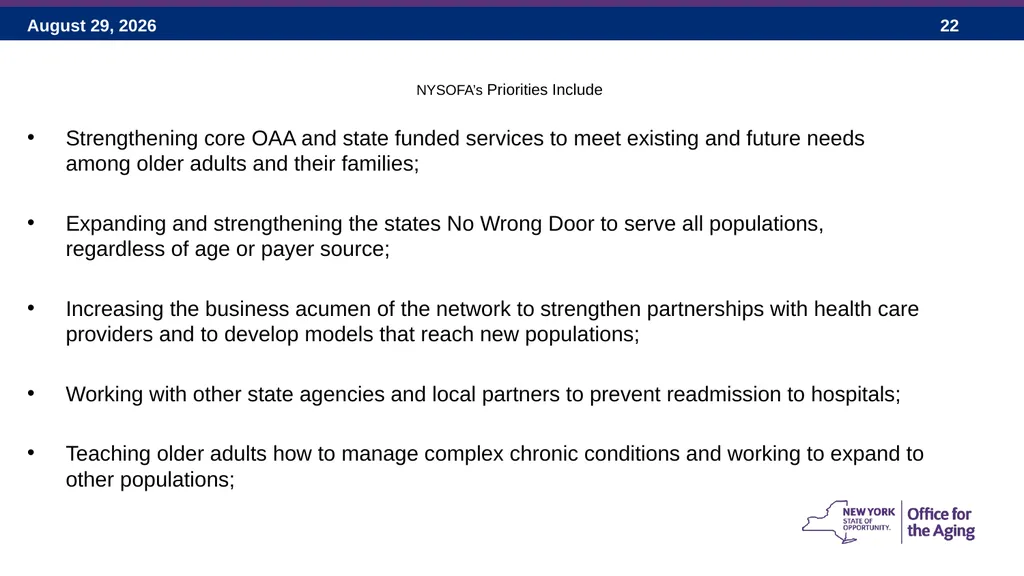
NYSOFA’s Priorities Include Strengthening core OAA and state funded services to meet existing and future needs among older adults and their families;
Expanding and strengthening the states No Wrong Door to serve all populations, regardless of age or payer source;
Increasing the business acumen of the network to strengthen partnerships with health care providers and to develop models that reach new populations;
Working with other state agencies and local partners to prevent readmission to hospitals;
Teaching older adults how to manage complex chronic conditions and working to expand to other populations;<br>
23
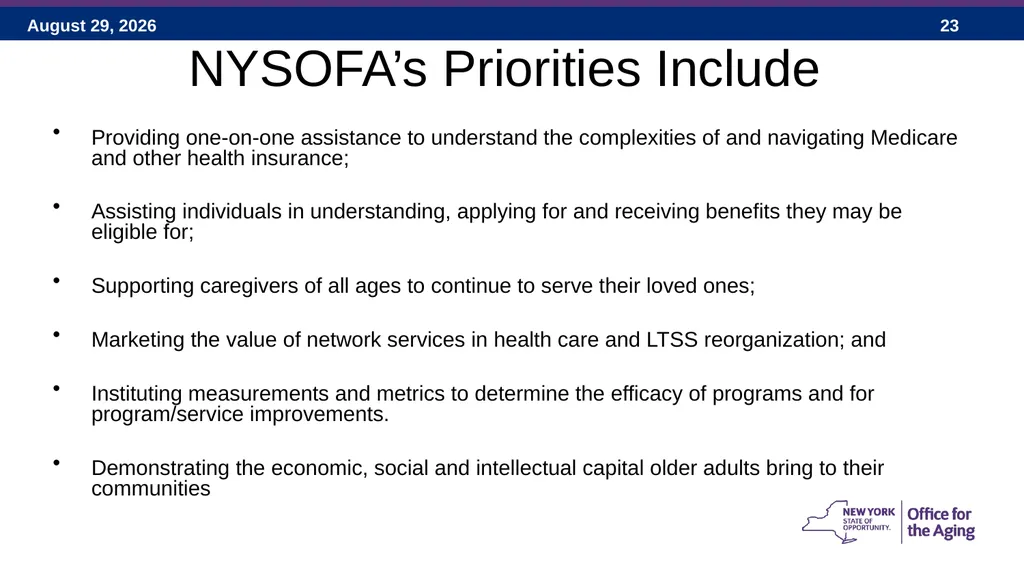
Providing one-on-one assistance to understand the complexities of and navigating Medicare and other health insurance;
Assisting individuals in understanding, applying for and receiving benefits they may be eligible for;
Supporting caregivers of all ages to continue to serve their loved ones;
Marketing the value of network services in health care and LTSS reorganization; and
Instituting measurements and metrics to determine the efficacy of programs and for program/service improvements.
Demonstrating the economic, social and intellectual capital older adults bring to their communities NYSOFA’s Priorities Include<br>
24
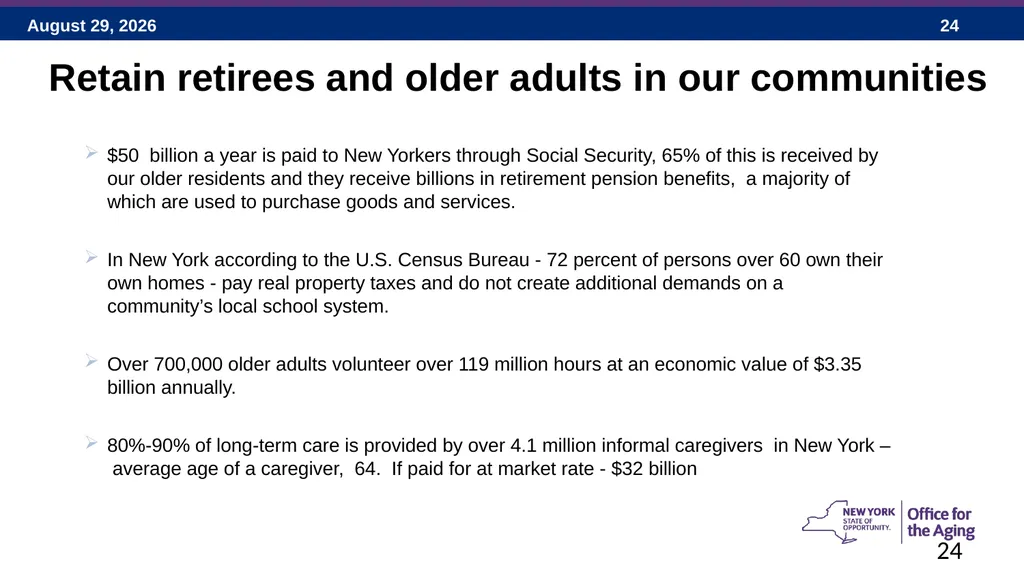
Retain retirees and older adults in our communities 24 $50 billion a year is paid to New Yorkers through Social Security, 65% of this is received by our older residents and they receive billions in retirement pension benefits, a majority of which are used to purchase goods and services.
In New York according to the U.S. Census Bureau - 72 percent of persons over 60 own their own homes - pay real property taxes and do not create additional demands on a community’s local school system.
Over 700,000 older adults volunteer over 119 million hours at an economic value of $3.35 billion annually.
80%-90% of long-term care is provided by over 4.1 million informal caregivers in New York – average age of a caregiver, 64. If paid for at market rate - $32 billion<br>
25
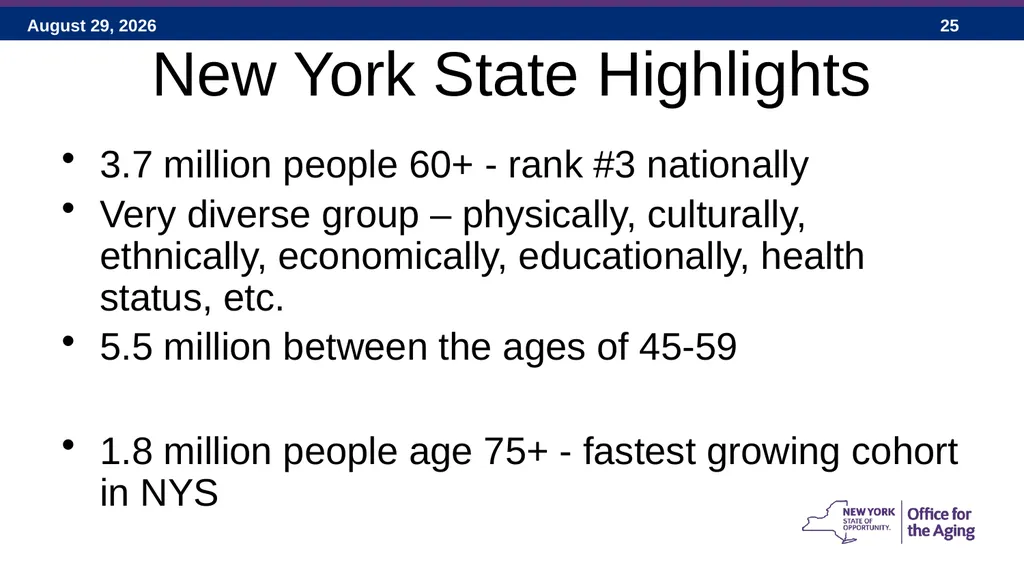
New York State Highlights 3.7 million people 60+ - rank #3 nationally
Very diverse group – physically, culturally, ethnically, economically, educationally, health status, etc.
5.5 million between the ages of 45-59
1.8 million people age 75+ - fastest growing cohort in NYS<br>
Very diverse group – physically, culturally, ethnically, economically, educationally, health status, etc.
5.5 million between the ages of 45-59
1.8 million people age 75+ - fastest growing cohort in NYS<br>
26
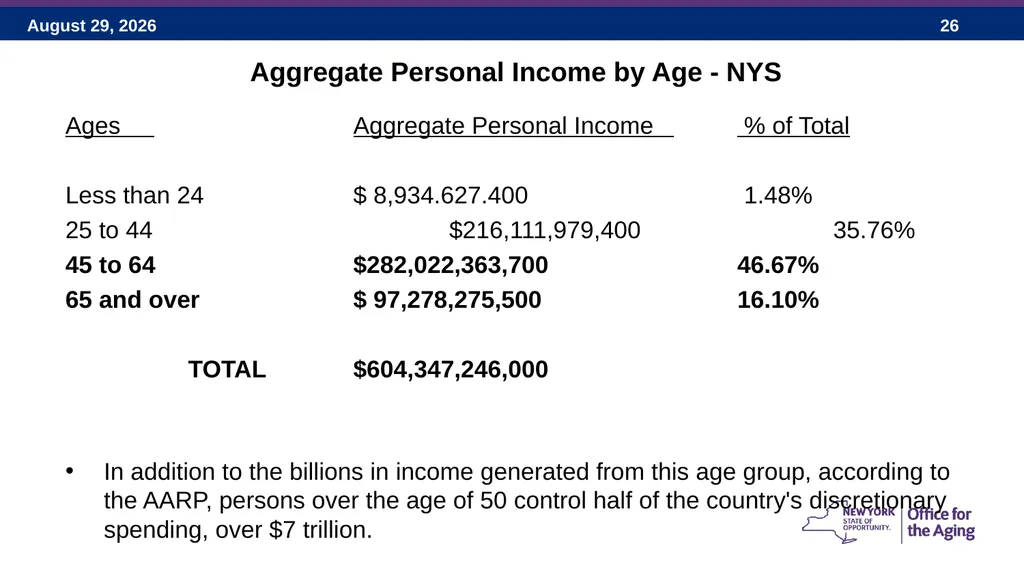
Aggregate Personal Income by Age - NYS Ages Aggregate Personal Income % of Total
Less than 24 $ 8,934.627.400 1.48% 25 to 44 $216,111,979,400 35.76% 45 to 64 $282,022,363,700 46.67%
65 and over $ 97,278,275,500 16.10% TOTAL $604,347,246,000
In addition to the billions in income generated from this age group, according to the AARP, persons over the age of 50 control half of the country's discretionary spending, over $7 trillion.<br>
27
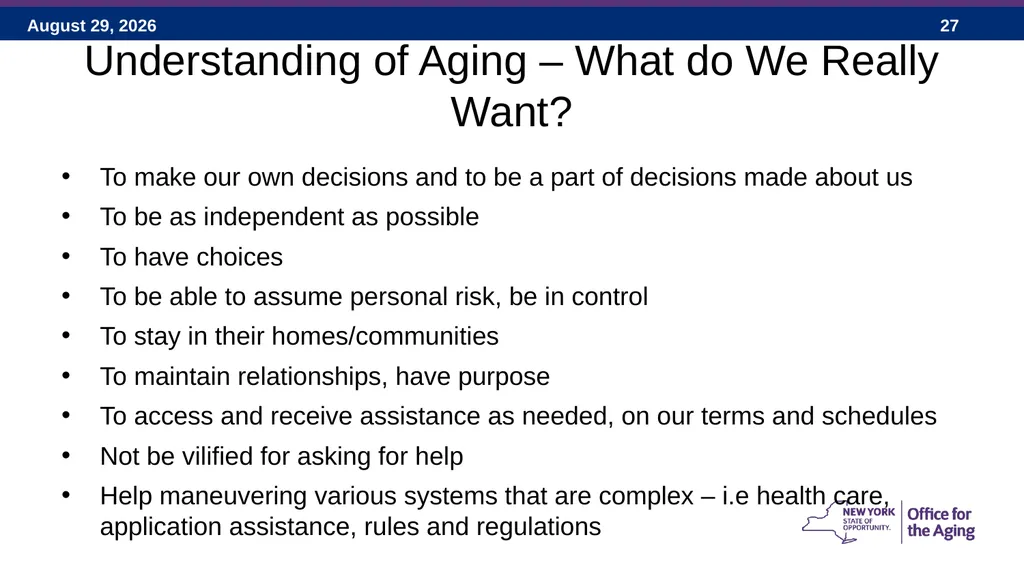
Understanding of Aging – What do We Really Want? To make our own decisions and to be a part of decisions made about us
To be as independent as possible
To have choices
To be able to assume personal risk, be in control
To stay in their homes/communities
To maintain relationships, have purpose
To access and receive assistance as needed, on our terms and schedules
Not be vilified for asking for help
Help maneuvering various systems that are complex – i.e health care, application assistance, rules and regulations<br>
28
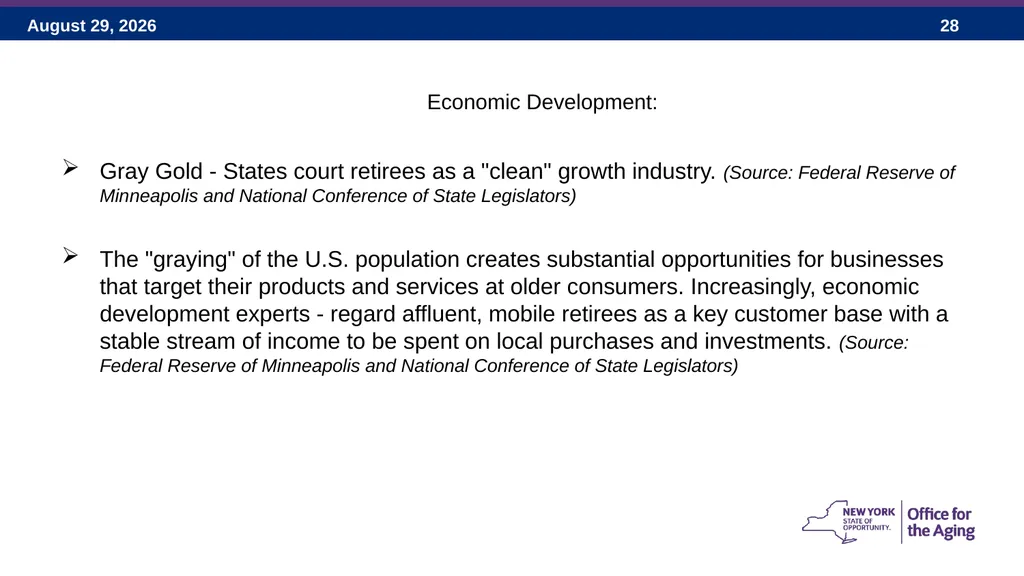
Economic Development: Gray Gold - States court retirees as a "clean" growth industry. (Source: Federal Reserve of Minneapolis and National Conference of State Legislators)
The "graying" of the U.S. population creates substantial opportunities for businesses that target their products and services at older consumers. Increasingly, economic development experts - regard affluent, mobile retirees as a key customer base with a stable stream of income to be spent on local purchases and investments. (Source: Federal Reserve of Minneapolis and National Conference of State Legislators)<br>
The "graying" of the U.S. population creates substantial opportunities for businesses that target their products and services at older consumers. Increasingly, economic development experts - regard affluent, mobile retirees as a key customer base with a stable stream of income to be spent on local purchases and investments. (Source: Federal Reserve of Minneapolis and National Conference of State Legislators)<br>
29
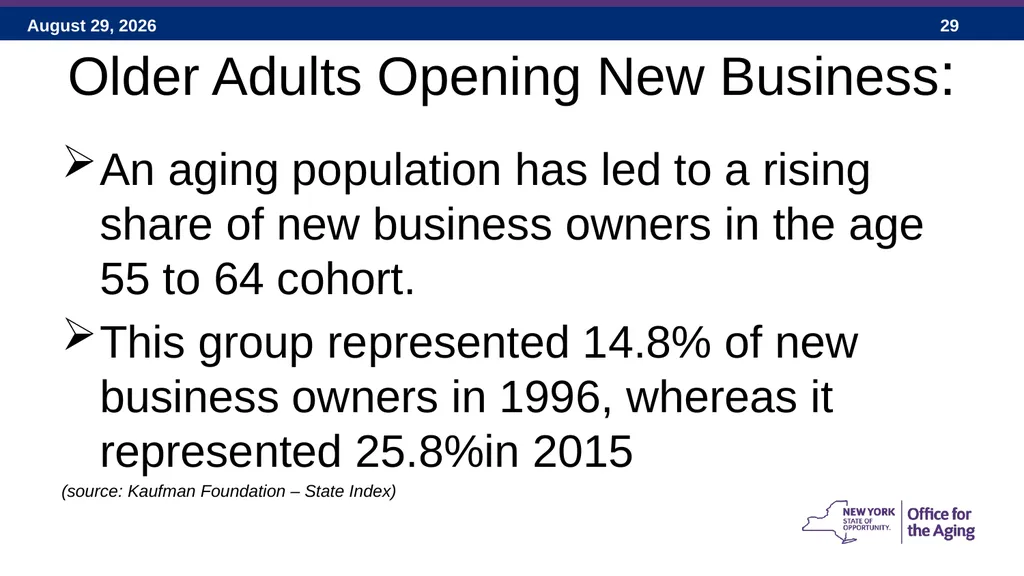
Older Adults Opening New Business: An aging population has led to a rising share of new business owners in the age 55 to 64 cohort.
This group represented 14.8% of new business owners in 1996, whereas it represented 25.8%in 2015
(source: Kaufman Foundation – State Index)<br>
This group represented 14.8% of new business owners in 1996, whereas it represented 25.8%in 2015
(source: Kaufman Foundation – State Index)<br>
30
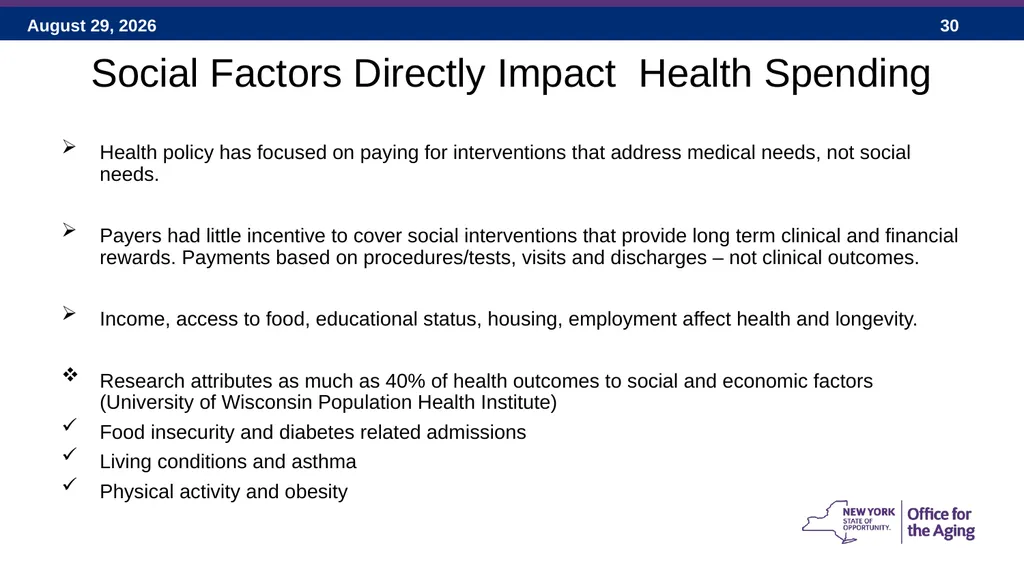
Social Factors Directly Impact Health Spending Health policy has focused on paying for interventions that address medical needs, not social needs.
Payers had little incentive to cover social interventions that provide long term clinical and financial rewards. Payments based on procedures/tests, visits and discharges – not clinical outcomes.
Income, access to food, educational status, housing, employment affect health and longevity.
Research attributes as much as 40% of health outcomes to social and economic factors (University of Wisconsin Population Health Institute)
Food insecurity and diabetes related admissions
Living conditions and asthma
Physical activity and obesity<br>
31
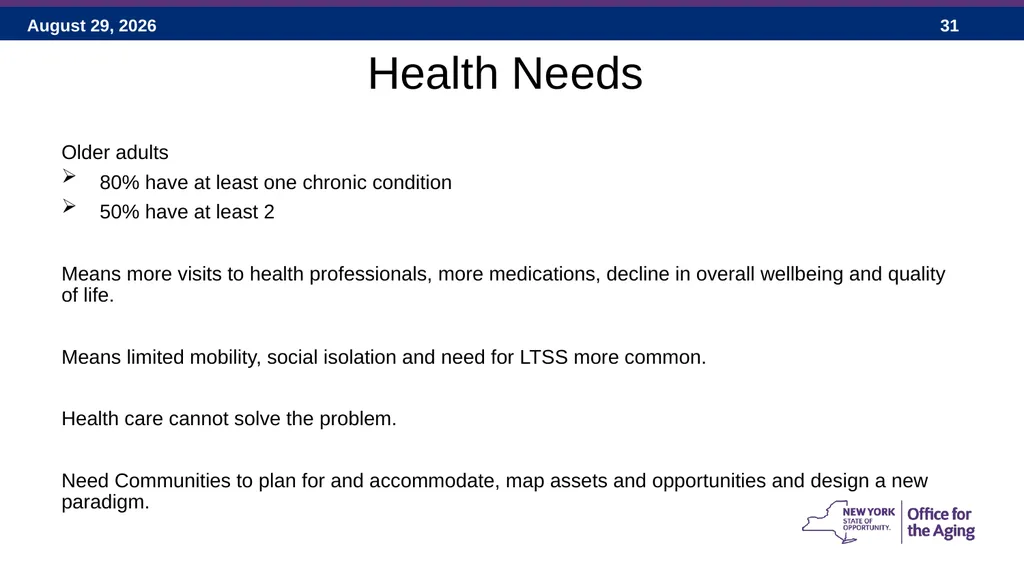
Health Needs Older adults
80% have at least one chronic condition
50% have at least 2
Means more visits to health professionals, more medications, decline in overall wellbeing and quality of life.
Means limited mobility, social isolation and need for LTSS more common.
Health care cannot solve the problem.
Need Communities to plan for and accommodate, map assets and opportunities and design a new paradigm.<br>
32
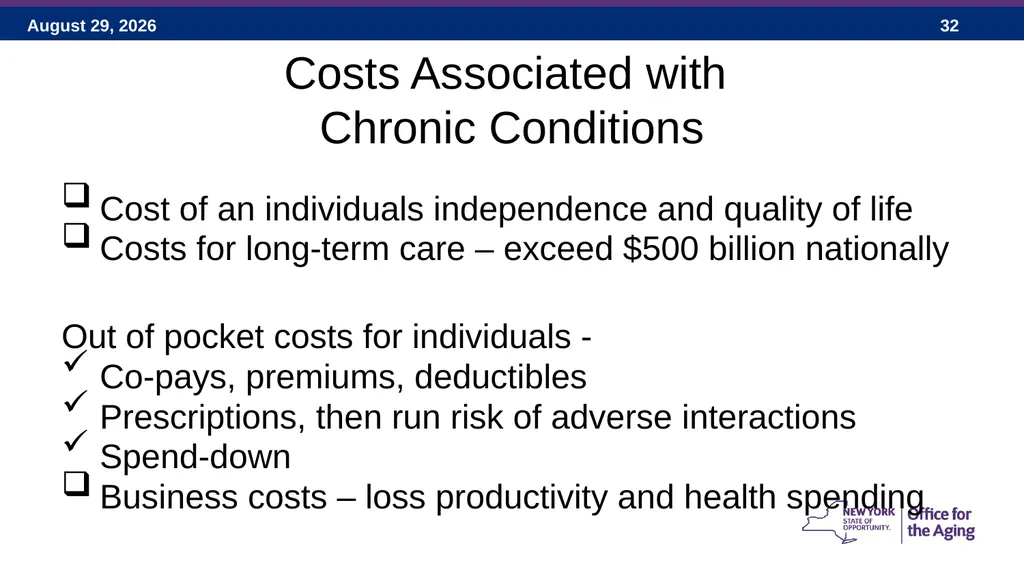
Costs Associated with
Chronic Conditions Cost of an individuals independence and quality of life
Costs for long-term care – exceed $500 billion nationally
Out of pocket costs for individuals -
Co-pays, premiums, deductibles
Prescriptions, then run risk of adverse interactions
Spend-down
Business costs – loss productivity and health spending<br>
Costs for long-term care – exceed $500 billion nationally
Out of pocket costs for individuals -
Co-pays, premiums, deductibles
Prescriptions, then run risk of adverse interactions
Spend-down
Business costs – loss productivity and health spending<br>
33
Changes Are Occurring - Federal and State Direction – Rebalance LTSS Olmstead Plan
Medicaid Redesign Team (MRT)
Health Homes
Fully Integrated Dual Advantage (FIDA)
Managed Long Term Care (MLTC)
Balanced Incentive Program (BIP)
Community First Choice Option (CFCO)
Money Follows the Person (MFP)
Center for Medicare and Medicaid Innovation (CMMI)
Delivery System Reform Incentive Payment Program (DSRIP)
Accountable Care Organizations, etc.<br>
34
Governor Cuomo - 2017 Health Across All Policies Approach
A collaborative approach to improving health and wellness by incorporating health considerations into decision making across sectors and policy areas.
It includes seeking designation from the World Health Organization of New York as the First Age Friendly State.
(Source: 2017 – State of the Address-New York State Excelsior/ Ever Upward)<br>
35
Age Friendly Communities = Healthy Communities Makes healthy lifestyle choices easy and accessible for all community members.
Age Friendly community design links the traditional concepts of planning (such as land use, transportation, community facilities, parks, and open space) with health themes (such as physical activity, public safety, healthy food access, mental health, air and water quality, and social equity issues).<br>
Age Friendly community design links the traditional concepts of planning (such as land use, transportation, community facilities, parks, and open space) with health themes (such as physical activity, public safety, healthy food access, mental health, air and water quality, and social equity issues).<br>
36
Why Age Friendly/Livable Communities?<br>
37
Bicycling:
Half of all trips taken in the United States are three miles or less, yet most Americans drive. Only 3 percent of commuting trips in the U.S. are by bicycle,
Building bike infrastructure creates an average of 11.4 jobs for every $1 million spent. Road-only projects create 7.8 jobs per $1 million.
Density:
The Federal Reserve Bank of New York found that a doubling of an area’s density increases worker productivity by up to 4 percent. When the housing market imploded in the late 2000s, the neighborhoods that held their property values the best were high density communities that featured a mix of uses (housing, retail, restaurants and office space) located within a walkable core.
Economic Development:
For many years, public transit, bicycle lanes, trails and sidewalks have suffered from a lack of investment resulting in congestion, inactivity and obesity, as well as more air pollution and traffic crashes and a loss of economic vitality.
Houses with above-average levels of walkability command a premium of about $4,000 to $34,000 more than homes with average levels of walkability. A 1999 study by the Urban Land Institute of four new walkable communities determined that home buyers were willing to pay $20,000 more for the houses than they would for similar homes in less walkable areas.<br>
38
Form- Based Code:
Traditional zoning rules often promote low-density development and limited “one-size fits-all” housing choices encouraging excessive land consumption and automobile dependency. Such zoning can stand in the way of communities seeking to create vibrant, walkable neighborhoods that give residents the option of walking to a store, park or work.
Sidewalks:
Eight in 10 Americans prefer being in a community that offers sidewalks and good places to walk. Six in 10 prefer a neighborhood that features a mix of houses, shops and services within an easy walk versus a neighborhood that requires a car for every errand.
*People who live in neighborhoods with sidewalks are 47 percent more likely than residents of areas without sidewalks to be active at least 39 minutes a day.
Trees:
The National Main Street Center reports that a good tree canopy can increase retail sales by 12 cents on the dollar in large cities and 9 cents on the dollar in small ones.
Trees are also good for our health. Vehicle exhaust increases ozone and causes asthma and other medical problems. A single urban street tree converts enough carbon monoxide and carbon dioxide into oxygen to meet the oxygen needs of two people for a full year.<br>
39
NYS – Building on A Foundation Project 2015 – NYSOFA and all Executive Agencies
Community Empowerment Grants/Conferences
Locally Borne Projects/Planning
Long Island Livability Summit/Conference
Downtown Revitalization Program – Livability Elements
Model Zoning Laws
DOS – Smart growth, Sustainable Planning Conferences<br>
Community Empowerment Grants/Conferences
Locally Borne Projects/Planning
Long Island Livability Summit/Conference
Downtown Revitalization Program – Livability Elements
Model Zoning Laws
DOS – Smart growth, Sustainable Planning Conferences<br>
40
The End<br>