Sudden ionospheric disturbance monitoring using a lightning detection network and machine learning Mike Protts, Edmund Henley, Andy Horseman, Laura Dreyer, Sam Adams, Stephen Prust, Ed Stone, Sue Twelves, Graeme Marlton, Debbie OSullivan
"Sudden ionospheric disturbance monitoring using a" is the property of its rightful owner. Permission is granted to
download and print the materials on this website for personal, non-commercial use only, and to display it
on your personal computer provided you do not modify the materials and that you retain all copyright
notices contained in the materials. By downloading content from our website, you accept the terms of this
agreement.
Presentation Transcript
01
Sudden ionospheric disturbance monitoring using a lightning detection network and machine learning Mike Protts, Edmund Henley, Andy Horseman, Laura Dreyer, Sam Adams, Stephen Prust, Ed Stone, Sue Twelves, Graeme Marlton, Debbie O'Sullivan See slide notes for script & extra information<br>
02
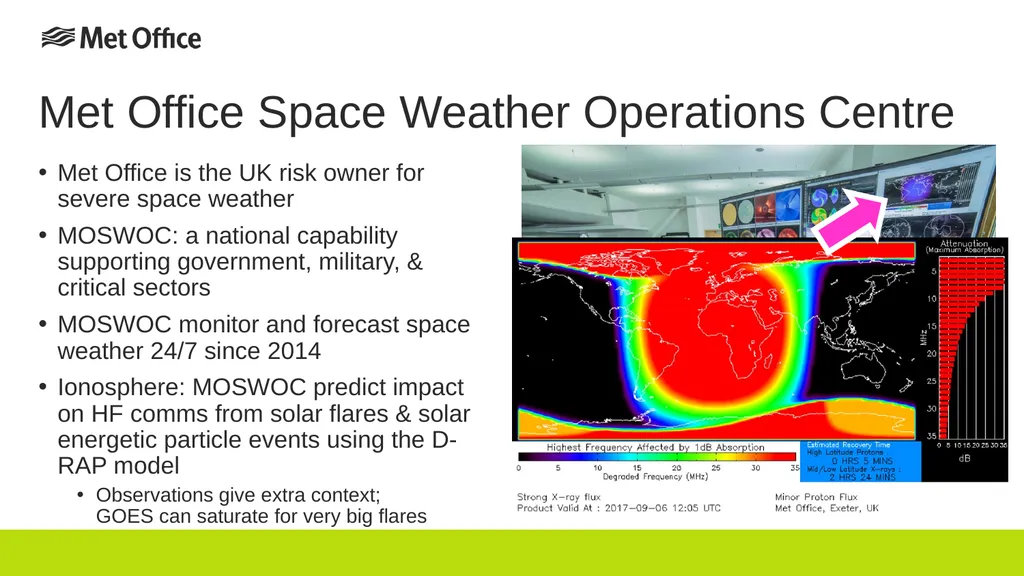
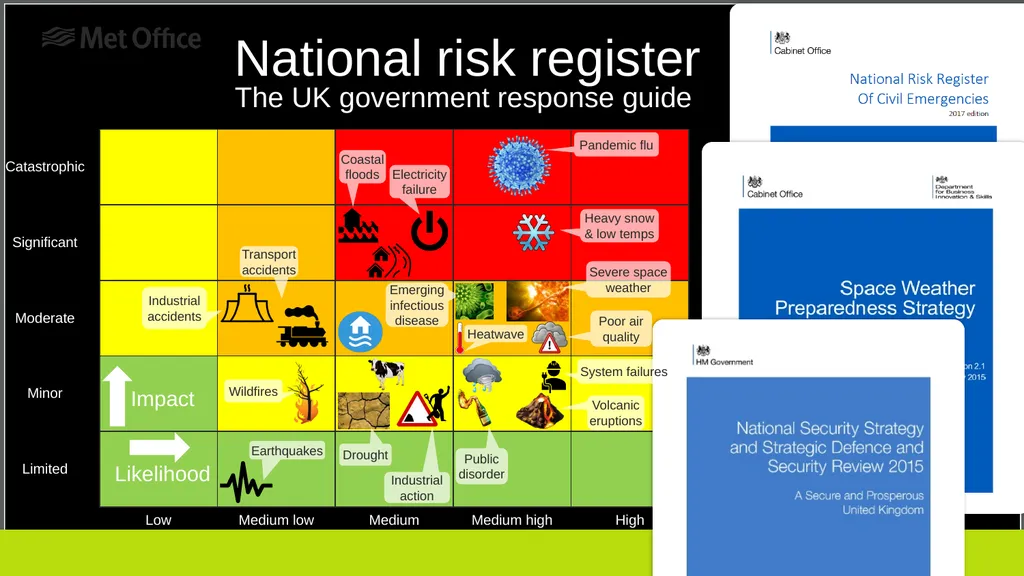
Met Office Space Weather Operations Centre Met Office is the UK risk owner for severe space weather
MOSWOC: a national capability supporting government, military, & critical sectors
MOSWOC monitor and forecast space weather 24/7 since 2014
Ionosphere: MOSWOC predict impact on HF comms from solar flares & solar energetic particle events using the D-RAP model
Observations give extra context; GOES can saturate for very big flares<br>
03
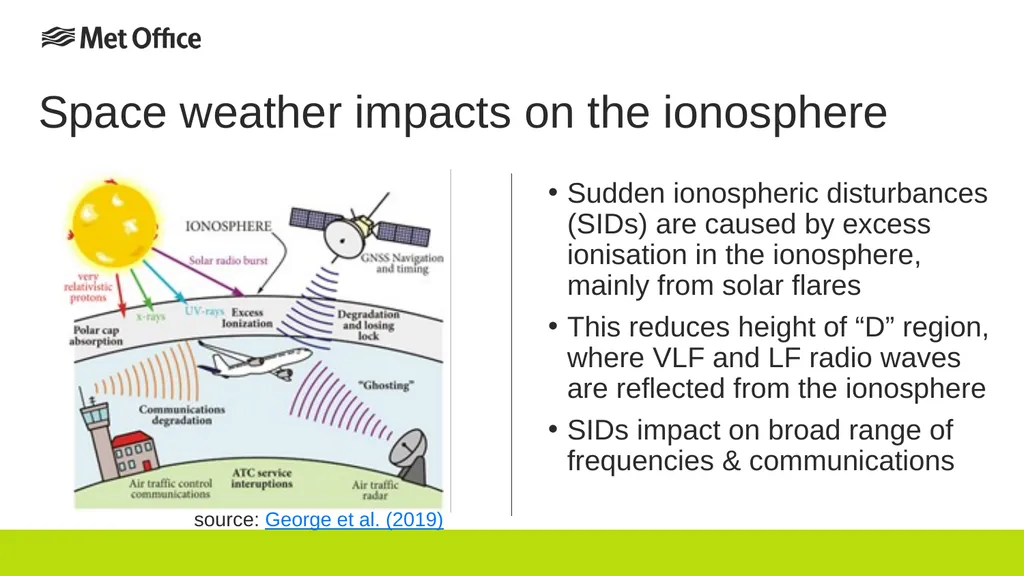
Space weather impacts on the ionosphere Sudden ionospheric disturbances (SIDs) are caused by excess ionisation in the ionosphere, mainly from solar flares
This reduces height of “D” region, where VLF and LF radio waves are reflected from the ionosphere
SIDs impact on broad range of frequencies & communications source: George et al. (2019)<br>
04
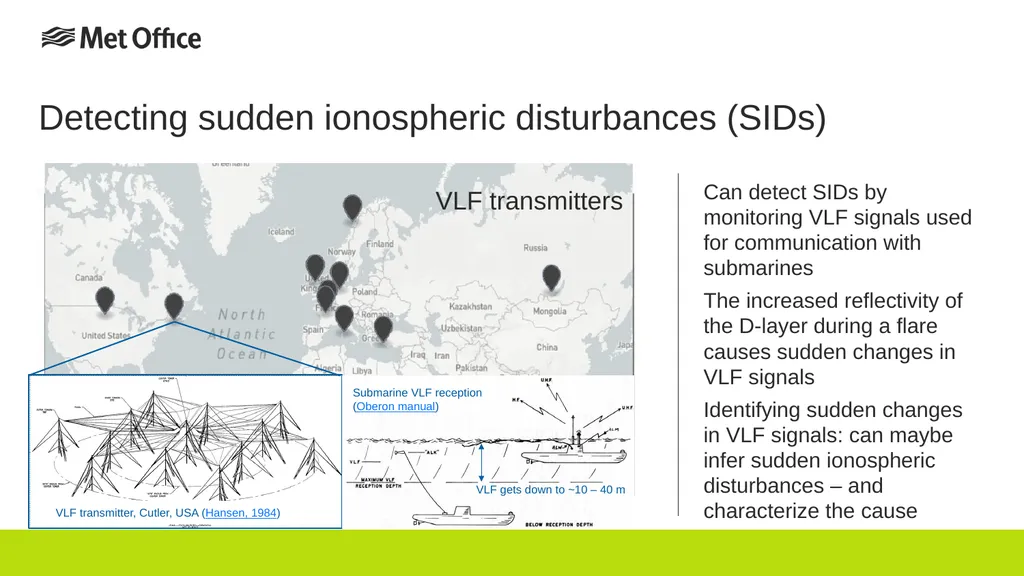
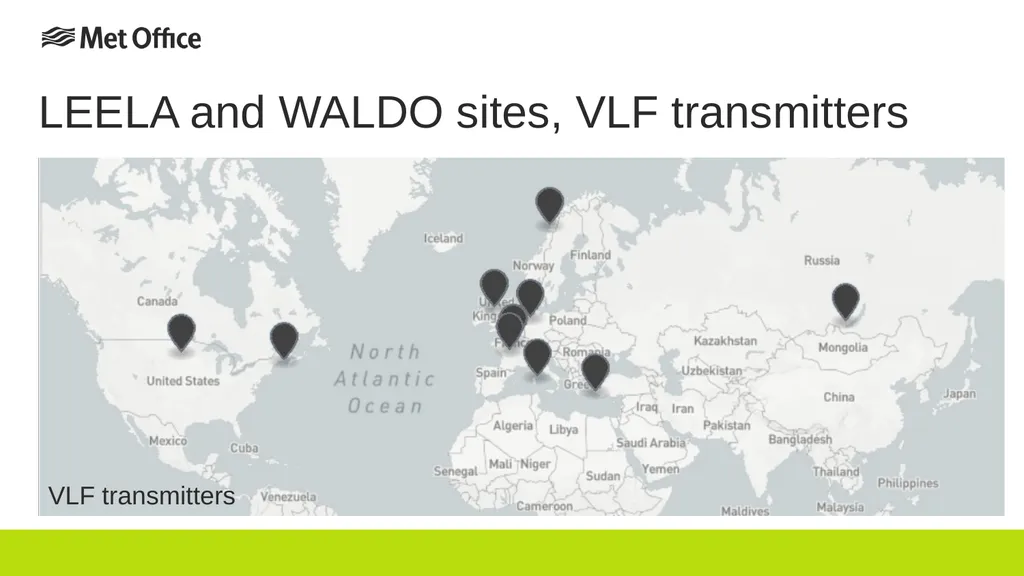
Detecting sudden ionospheric disturbances (SIDs) Can detect SIDs by monitoring VLF signals used for communication with submarines
The increased reflectivity of the D-layer during a flare causes sudden changes in VLF signals
Identifying sudden changes in VLF signals: can maybe infer sudden ionospheric disturbances – and characterize the cause Day / night variation of the ionosphere and VLF propagation (source: U.Stanford)<br>
05
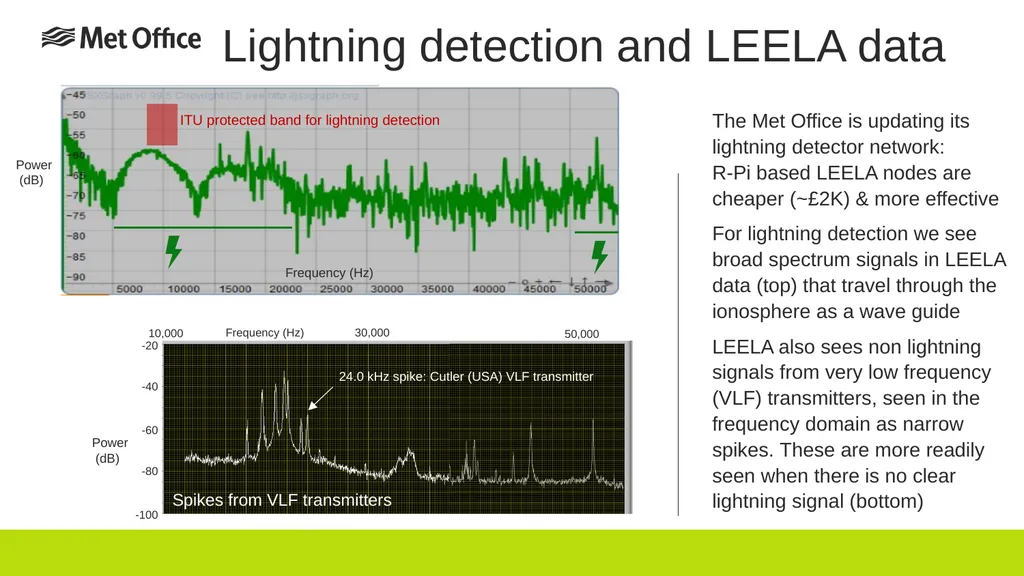
The Met Office is updating its lightning detector network: R-Pi based LEELA nodes are cheaper (~£2K) & more effective
For lightning detection we see broad spectrum signals in LEELA data (top) that travel through the ionosphere as a wave guide
LEELA also sees non lightning signals from very low frequency (VLF) transmitters, seen in the frequency domain as narrow spikes. These are more readily seen when there is no clear lightning signal (bottom) Lightning detection and LEELA data<br>
06
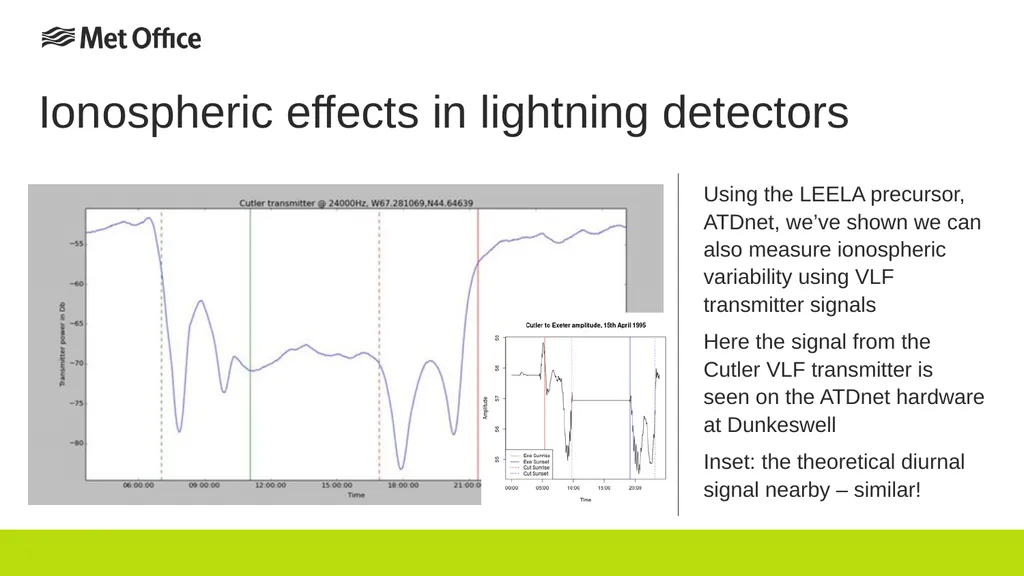
Ionospheric effects in lightning detectors Using the LEELA precursor, ATDnet, we’ve shown we can also measure ionospheric variability using VLF transmitter signals
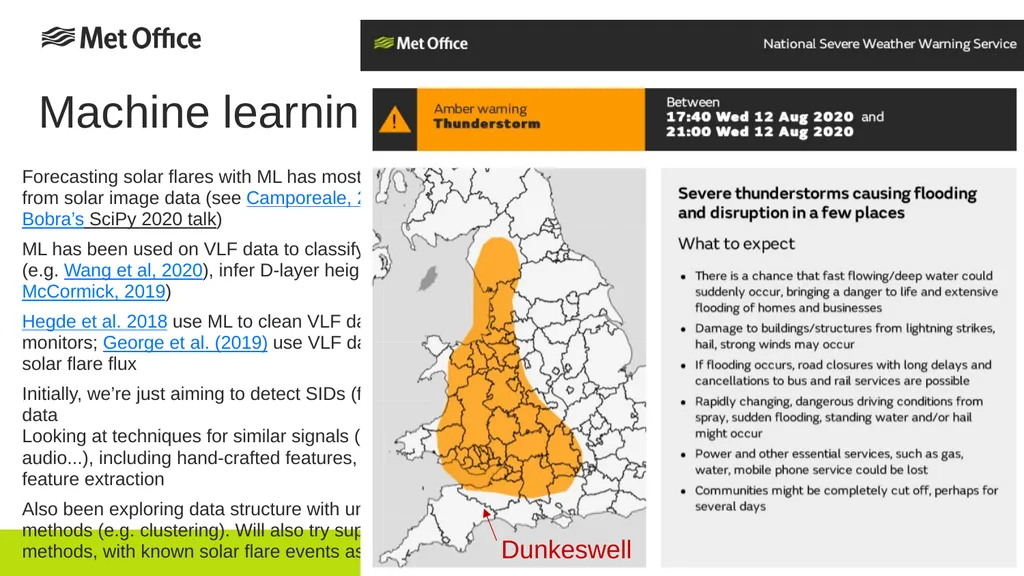
Here the signal from the Cutler VLF transmitter is seen on the ATDnet hardware at Dunkeswell
Inset: the theoretical diurnal signal nearby – similar!<br>
07
LEELA data and machine learning Each LEELA node generates over 100,000 data points every second
Analysing this data volume is challenging with traditional methods, but machine learning (ML) has potential
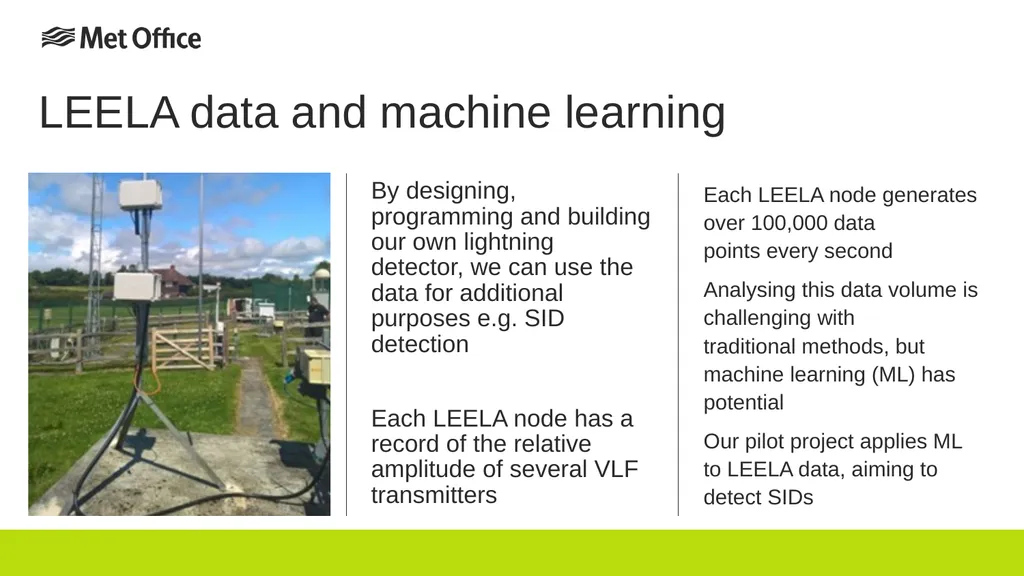
Our pilot project applies ML to LEELA data, aiming to detect SIDs By designing, programming and building our own lightning detector, we can use the data for additional purposes e.g. SID detection
Each LEELA node has a record of the relative amplitude of several VLF transmitters<br>
08
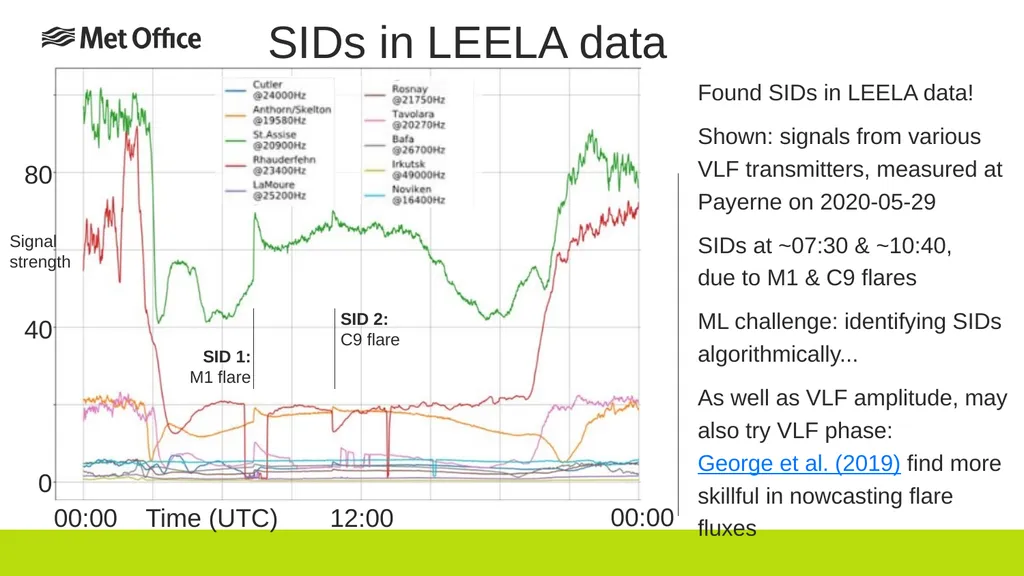
SIDs in LEELA data Found SIDs in LEELA data!
Shown: signals from various VLF transmitters, measured at Payerne on 2020-05-29
SIDs at ~07:30 & ~10:40, due to M1 & C9 flares
ML challenge: identifying SIDs algorithmically...
As well as VLF amplitude, may also try VLF phase: George et al. (2019) find more skillful in nowcasting flare fluxes Signal
strength<br>
09
Machine learning and SIDs Forecasting solar flares with ML has mostly used features from solar image data (see Camporeale, 2019; Monica Bobra’s SciPy 2020 talk)
ML has been used on VLF data to classify lightning signals (e.g. Wang et al, 2020), infer D-layer height (McCormick, 2019)
Hegde et al. 2018 use ML to clean VLF data from SID monitors; George et al. (2019) use VLF data to nowcast solar flare flux
Initially, we’re just aiming to detect SIDs (flares) in our VLF data Looking at techniques for similar signals (ECG, EEG, audio...), including hand-crafted features, automated feature extraction
Also been exploring data structure with unsupervised methods (e.g. clustering). Will also try supervised methods, with known solar flare events as labels Filter signal, get mean & variance of 60s packets, standardise. Cluster via t-SNE…<br>
10
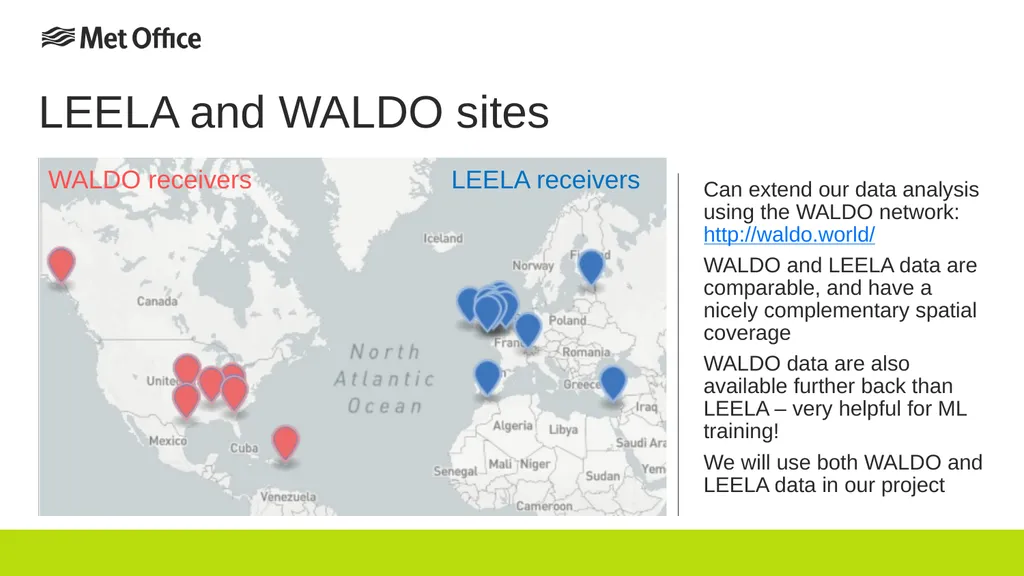
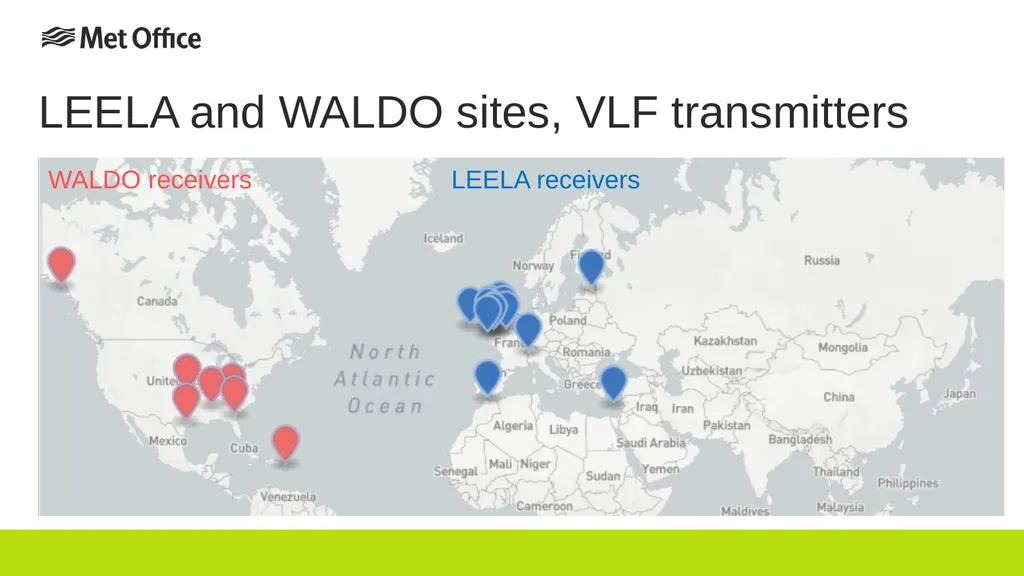
LEELA and WALDO sites Can extend our data analysis using the WALDO network: http://waldo.world/
WALDO and LEELA data are comparable, and have a nicely complementary spatial coverage
WALDO data are also available further back than LEELA – very helpful for ML training!
We will use both WALDO and LEELA data in our project WALDO receivers LEELA receivers<br>
11
This project has been enabled by funding from the Met Office Data Science Strategic Action (Machine Learning Pilot Projects package)
This cross-office project was initiated by Observations R&D, also involving the Space Weather team and the Informatics Lab
We are grateful to the LEELA project for providing the data streams and archive
We thank the WALDO project for providing their data, and prioritising availability for days where there has been significant solar activity Thanks<br>
12
Any questions? Extra slides available after this slide<br>
13
National risk register The UK government response guide 2017
version<br>
14
LEELA receivers WALDO receivers LEELA and WALDO sites, VLF transmitters<br>
15
LEELA receivers WALDO receivers LEELA and WALDO sites, VLF transmitters<br>