
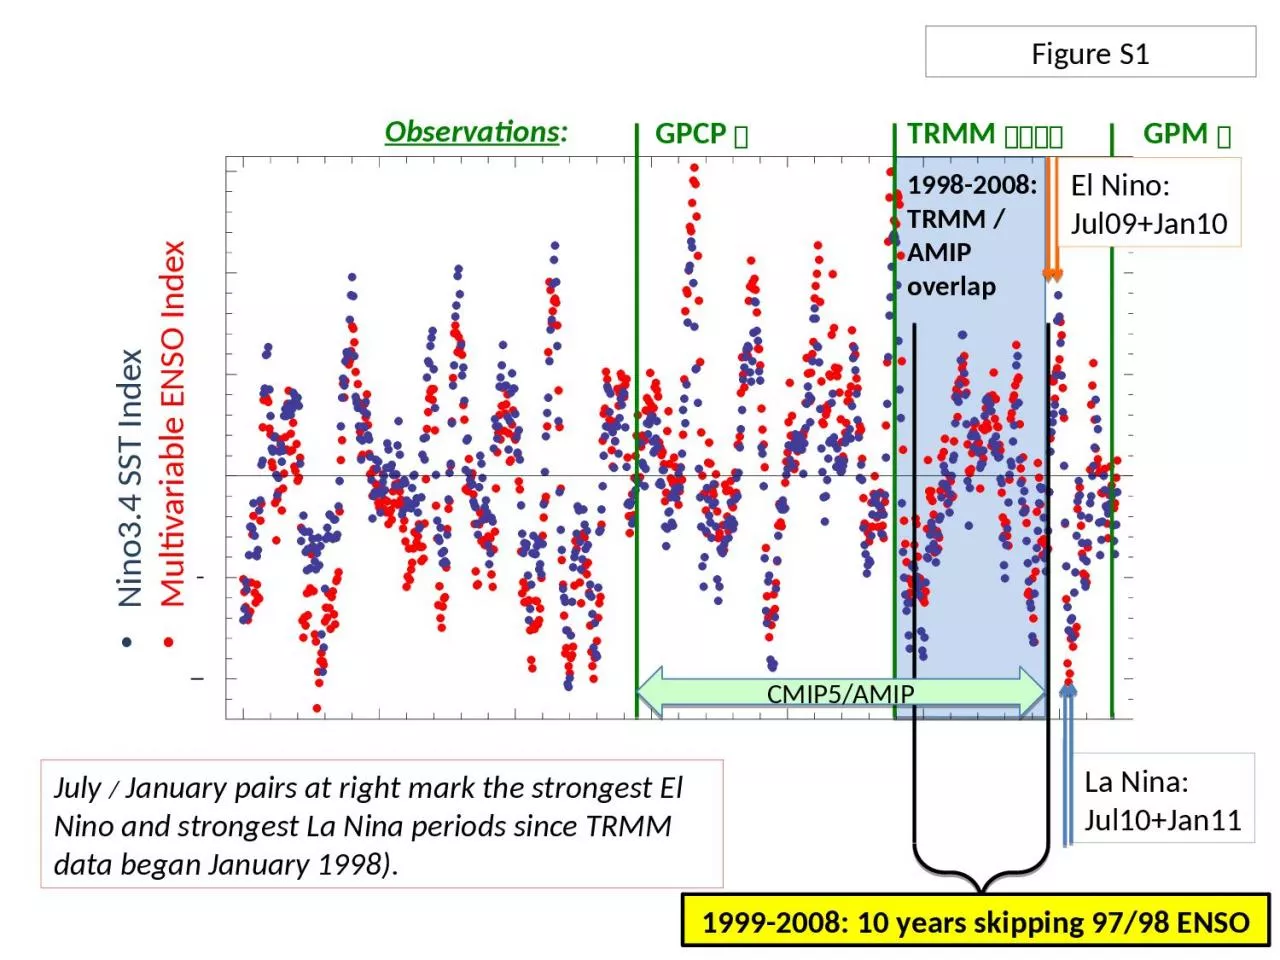
La Nina Jul10Jan11 July January pairs at right mark the strongest El Nino and strongest La Nina periods since TRMM data began January 1998 19982008 TRMM AMIP overlap El Nino Jul09Jan10 ID: 932008
Download Presentation The PPT/PDF document "GPCP TRMM " is the property of its rightful owner. Permission is granted to download and print the materials on this web site for personal, non-commercial use only, and to display it on your personal computer provided you do not modify the materials and that you retain all copyright notices contained in the materials. By downloading content from our website, you accept the terms of this agreement.


Slide1
GPCP
TRMM
La Nina:Jul10+Jan11
July
/
January pairs at right mark the strongest El Nino and strongest La Nina periods since TRMM data began January 1998).
1998-2008:
TRMM / AMIP overlap
El Nino:
Jul09+Jan10
GPM
1999-2008: 10 years skipping 97/98 ENSO
Observations
:
Nino3.4 SST Index
Multivariable ENSO Index
Figure S1
CMIP5/AMIP
Slide2TRMM 3B42 from Obs4MIPs
MRI-AGCM3-2S
GFDL-HIRAM-C360
GFDL-HIRAM-C180
MRI-AGCM3-2H
Figure S2
Diurnal harmonic
amplitude
Composite summer: July in Northern Hemisphere
January in Southern Hemisphere
Slide3TRMM 3B42 from Obs4MIPs
MRI-AGCM3-2S
GFDL-HIRAM-C180
MRI-AGCM3-2H
GFDL-HIRAM-
C360
Figure S3
Diurnal harmonic phase
Composite summer
Slide4TRMM 3B42 fromObs4MIPs
GFDL-HIRAM-C360
MRI-AGCM3-2S
MRI-AGCM3-2H
GFDL-HIRAM-C180
Figure S4
Diurnal harmonic
a
mplitudeComposite winter:
January in Northern Hemisphere July in Southern Hemisphere
Slide5TRMM 3B42 fromObs4MIPs
MRI-AGCM3-2S
GFDL-HIRAM-C360
GFDL-HIRAM-C180
MRI-AGCM3-2H
Figure S5
Diurnal harmonic phase
Composite winter
Slide6TRMM 3B42 from Obs4MIPs
MRI-AGCM3-2S
GFDL-HIRAM-C180
MRI-AGCM3-2H
GFDL-HIRAM-
C360
Figure S6
Semidiurnal harmonic
amplitude
Composite summer: July in Northern Hemisphere
January in Southern Hemisphere
Slide7TRMM 3B42 from Obs4MIPs
MRI-AGCM3-2S
GFDL-HIRAM-C180
MRI-AGCM3-2H
GFDL-HIRAM-
C360
Figure S7
Semidiurnal harmonic phaseComposite summer
Slide8TRMM 3B42 fromObs4MIPs
GFDL-HIRAM-C360
MRI-AGCM3-2S
MRI-AGCM3-2H
GFDL-HIRAM-C180
Figure S8
Semidiurnal harmonic
a
mplitudeComposite winter:
January in Northern Hemisphere July in Southern Hemisphere
Slide9TRMM 3B42 fromObs4MIPs
GFDL-HIRAM-C360
MRI-AGCM3-2S
GFDL-HIRAM-C180
MRI-AGCM3-2S
Figure S9
Semidiurnal harmonic phase
Composite winter
Slide10Figure S10
Slide11July
2008
ARM SGP Site
Timeseries: Obs4MIPs/TRMM3B42 Data
Concatenating
all Julys for 1999-2008, the 21:00 UTC mean = 1.39 mm/d and the
21:00 UTC standard deviation = 7.70 mm/d, still >> the mean value.
21:00 UTC
timepoints
This subset of timepoints includes nonzero values from each of the storms occurring in July 2008. The histogram of rainfall values at this time of day is highly skewed, more like Poisson than Gaussian:
All 3-hourly
timepoints
MEAN
=
3.4 mm
/d STD = 13.5 mm/d
MAX = 73.8 mm/d
Figure S11
Slide12Figure S12