
Although genome profiling studies have demonstrated heterogeneity in subclonal architecture that may ultimately lead to relapse a geneexpression based prediction program that can identify distinguish and quantify drug response in subpopulations within a bulk population of myeloma cells is lacki ID: 933485
Download Presentation The PPT/PDF document "Subhead Multiple myeloma (MM) is charact..." is the property of its rightful owner. Permission is granted to download and print the materials on this web site for personal, non-commercial use only, and to display it on your personal computer provided you do not modify the materials and that you retain all copyright notices contained in the materials. By downloading content from our website, you accept the terms of this agreement.


Slide1
Subhead
Multiple myeloma (MM) is characterized by significant genetic diversity at subclonal levels that play a defining role in the heterogeneity of tumor progression, clinical aggressiveness and drug sensitivity.
Although
genome profiling studies have demonstrated heterogeneity in subclonal architecture that may ultimately lead to relapse, a gene-expression based prediction program that can identify, distinguish and quantify drug response in subpopulations within a bulk population of myeloma cells is lacking.
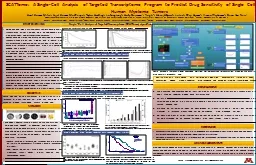
In this study, we performed targeted transcriptome analysis for prediction of proteasome inhibitor (PI)-on 528 pre-treatment single-cells from 11 myeloma cell lines and 418 single-cells from 8 drug-naïve newly diagnosed MM patients.Probability of resistance for each individual cell was predicted using a pipeline that employed a combination of the machine learning methods LASSO, Random Forest, Support Vector Machine (radial and sigmoidal) to make single-cell GEP data-driven response predictions/ decisions. We developed an R Statistical analysis package, SCATTome (Single Cell Analysis of Targeted Transcriptome), that restructures the data obtained from Fluidigm single-cell qRT-PCR analysis run, filters missing data, performs scaling of filtered data, builds classification models using an assortment of machine learning methods, and predicts drug response of individual cells based on the targeted transcriptome. Application of SCATT should contribute to clinically relevant analysis of intra-tumor heterogeneity, and better inform drug choices based on sub-clonal cellular responses.
Using Random Forest, Least Absolute Shrinkage and Selection Operator (LASSO) methods.
Automated single-cell capture, processing and cDNA synthesis was performed using Fluidigm’s C1 Single-Cell Auto Prep System.Single-cell targeted gene expression profiling of HMCLs was done using automated, high-throughput on-chip qRT-PCR analysis using 96.96 Dynamic Array IFCs on the BioMark HD System.Gene panel (96) included:Genes of baseline PI response: Our 23-gene signature (Stessman et al 2013) and Shaughnessy’s 17-gene signature (Shaughnessy et al 2007).Other relevant genes: cell cycle genes, anti-apoptotic genes, proteasome subunit genes, internal negative controls, housekeeping genes.Machine learning approaches were used to build classification models, generate GEP signature and predict drug response of individual cells based on the targeted transcriptome.
U266 Parental vs U266 PI-resistant cells (TRAINING DATASET)
To use machine learning approaches to predict probability of PI resistance for each individual cell within bulk myeloma tumors based on targeted transcriptome analysis of single cells.
Figure: Variable/ Feature selection using Random Forest and LASSO machine learning algorithms on U266 Parental vs U266 PI-resistant cells (training dataset).
Mean
accuracy plot for
Random Forest model
with the 95 percent confidence band of the mean of the out-of-sample prediction against the number of top genes included in the model; Gene importance plot for Random Forest model. MeanDecreaseGini is the measure of gene importance for training dataset.c) Variable selection using LASSO showing list of important genes. Genes in BOLD indicate top important genes selected using Random Forest.
Figure: Scatter dot plot for test probabilities [probability of Status=100 (resistance)] of single cells from training set (U266P vs U266VR) and human myeloma cell line (HMCL) panel (test set).
Figure: Plot shows differential sensitivity of the panel of HMCLs to Bz treatment representing wide inter-individual variation in PI
response.
Figure: Scatter dot plot of predicted test probabilities of single cells from patients. Patient RNASeq data was pre-processed before being considered for predictions.
Using Random
Forest, Support Vector Machine (SVM) with Gaussian radial basis function (RBF) kernel and Support Vector Machine (SVM) with Hyperbolic Tangent (Sigmoid) Kernel with Ensemble forecasting algorithm.
Step 1: Build classification model & select important genes (GEP signature)
Step 2: Drug response prediction in single-cell data from HMCL panel
Figure: Clonally-derived Bz-resistant cells (U266R) were generated from Bz-sensitive U266 parental (U266.P) cell lines using Bz dose escalation.
Human myeloma cell lines /HMCLs (TEST DATASET)
Step 3: Validation using patient single-cell data and APEX clinical trial data
Figure:
Kaplan–Meier curves showing significant differences in OS in patients (Top vs Bottom 20% survivors) from the Bz arm of APEX trial clustered on the basis of the expression of the genes that most distinguished Bz-Sensitive and Bz-Resistant cell lines
Figure: Correlation
between SCATT35 with drug area under survival curve (AUSC) values in HMCLs (test samples). SCATT score of >35 was used as cut-off to identify residual single cells resistant to PIs.
a)
b)
c)
We gratefully acknowledge the expert technical support from the University of Minnesota Genomics Center and Mayo Clinic Center for Individualized Medicine and the members of the Genome Analysis Core for support with the Single Cell RNAseq. We thank Takeda Pharmaceuticals and Amgen for the drugs. AKM is funded by a generous Junior fellowship award from the International Myeloma Foundation.
Shaughnessy JD,Jr, Zhan F, Burington BE, et al. A validated gene expression model of high-risk multiple myeloma is defined by deregulated expression of genes mapping to chromosome 1. Blood. 2007;109(6):2276-2284. Stessman HA, Baughn LB, Sarver A, et al. Profiling bortezomib resistance identifies secondary therapies in a mouse myeloma model. Mol Cancer Ther. 2013;12(6):1140-1150.
Figure: Schematic representation of SCATTome workflow: software package for classification, prediction and quantitation of drug sensitivity of individual cells.
Restructures data; Filters
missing data,; Performs data imputation; Scale-centers filtered data,; Builds classification models; Predicts single-cell drug response cells based on targeted transcriptome analysis.
The R package SCATTome computes, classifies, predicts and quantifies drug-resistant subpopulations within MM tumors using the single-cell targeted gene expression data.Our results demonstrate the presence of distinct populations of pre-existing drug-resistant subclones of cells within untreated myeloma cells, with a characteristic genetic signature profile distinct from the pre-treatment profile of PI-sensitive myeloma cells. We could find correlation between the mean/median test probability values of the cell lines derived from the probabilities of resistance of each single cell with the cytotoxicity profile of myeloma cell lines. Our mean predictions for patient samples derived from the single cell test probability value for each patient single-cell were associated with the outcome parameters of the clinical samples using PI therapy.When extrapolated, SCATTome can be used in other cancer models to predict single-cell drug response, to identify minimal residual disease and to design subclone-targeted secondary strategies .
Emails
: vanne001@umn.edu; mitra008@umn.edu
SCATTome: A Single-Cell Analysis of Targeted Transcriptome Program to Predict Drug Sensitivity of Single Cells within Human Myeloma Tumors
Amit Kumar Mitra1, Ujjal Kumar Mukherjee2, Taylor Harding1, JinSung Jang3, Holly Stessman1, Ying Li4, Alexej Abyzov4, Jin Jen3, Shaji Kumar5, Vincent Rajkumar5, Brian Van Ness1
1Department of Genetics, Cell Biology & Development, University of Minnesota, Minneapolis, MN; 2School of Statistics, University of Minnesota, Minneapolis, MN; 3Medical Genome Facility Genome Analysis Core, Mayo Clinic, Rochester, MN; 4Department of Health Science Research, Mayo Clinic, Rochester, MN; 5Division of Hematology, Department of Internal Medicine, Mayo Clinic, Rochester, MN
BRIEF OVERVIEW
OBJECTIVE
METHODS
CONCLUSIONS
REFERENCES
ACKNOWLEDGEMENTS
Single-Cell Analysis of Targeted Transcriptome (SCATTome) algorithm