
Cody Aylward Dr James D Murdoch Dr C William Kilpatrick Dr Therese M Donovan American Marten Class Mammalia Order Carnivora Family Mustelidea Martes americana Late Successional Forest ID: 931450
Download Presentation The PPT/PDF document "Estimating the source of American marten..." is the property of its rightful owner. Permission is granted to download and print the materials on this web site for personal, non-commercial use only, and to display it on your personal computer provided you do not modify the materials and that you retain all copyright notices contained in the materials. By downloading content from our website, you accept the terms of this agreement.


Slide1
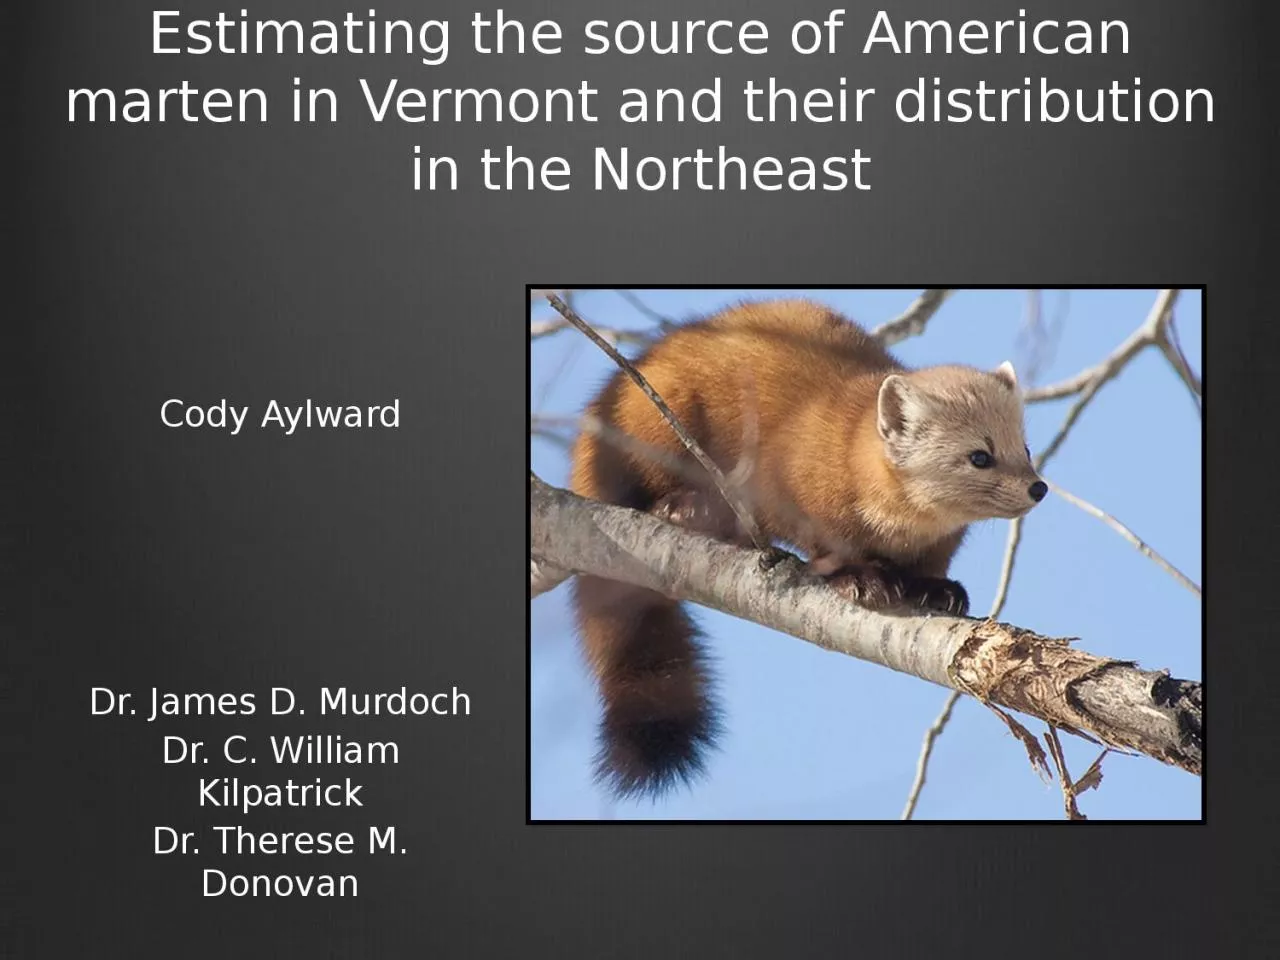
Estimating the source of American marten in Vermont and their distribution in the Northeast
Cody AylwardDr. James D. MurdochDr. C. William KilpatrickDr. Therese M. Donovan
Slide2American Marten
Class Mammalia; Order Carnivora; Family Mustelidea; Martes americanaLate Successional ForestIndicator SpeciesSnow
Vulnerable to Climate
Change
Endangered species in Vermont
High priority Species of Greatest Conservation Need
Slide3American Martens in Vermont
Early 1800s – Population was plentiful and ranged throughout the state (Thompson 1853)Late 1800s – Population decline due to habitat conversion and overharvest Last known record from Hogback Mountain in 1954 (Fuller 1987).
Slide4Reintroduction
United States Forest Service and Vermont Fish and Wildlife Department released 115 individuals from Maine (n=104) and New York (n=11) in the southern Green Mountain National Forest from 1989-1991By 1998, monitoring efforts did not detect any individuals in Vermont
Slide5Current Status
We are currently aware of two populations in Vermont:Northeast Kingdom - 1998Southern GMNF - 2010
Questions
Source?
C
onnectivity?
Other areas of suitable habitat?
Slide6Goals
Determine the potential distribution of martens in VermontIdentify dispersal corridors between two current populationsIdentify high quality habitat parcels where populations may be re-established and persist long-termRefine an expert elicitation method for modeling wildlife habitat
Determine the source to current populations of martens in Vermont using genetic markers
Slide7Methods – Population Genetics
Tissue samples collected from state biologists Chris Bernier (VT), Jill Kilborn (NH), Paul Jensen (NY) and Cory Mosby (ME)DNA ExtractionPCR mtDNA (d-loop)11 microsatellitesSequencing and SizingStatistical tests to determine source of VT populations
Fst
– population differentiation
Population Assignment/Exclusion
Slide8Source of Vermont Marten Populations - Hypotheses
The population in the Northern VT derives from migrants out of northern New Hampshire (Kelly 2005)
The population in Southern VT consists of descendants of the reintroduced individuals - primarily from Maine
Primary hypothesis
Alternative hypothesis
Slide9Results - mtDNA
87 individuals sequenced12 Haplotypes identified 26 polymorphic sites
Population
Haplotype
VT-N
VT-S
NH
ME
NY
All Populations
A
6
6
3
1
10
26
B
4
0
12
2
0
18
C
3
1
3
5
0
12
D
2
0
0
1
1
4
E
0
0
3
0
0
3
F
0
0
0
5
0
5
G
0
0
0
1
0
1
H
0
0
0
2
0
2
I
0
0
0
0
9
9
J
0
0
0
0
3
3
K
0
0
0
0
3
3
L
0
0
0
0
1
1
n=15
n=7
n=21
n=
17
n=
27
n=
87
Slide10Results - mtDNA
NH
VT-N
ME
NY
VT-S
Slide11Results - mtDNA
ME
NY
VT-S
Translocation
Dispersal
No significant gene flow
Fst
= 0.44037**
NH
VT-N
Slide12Results - mtDNA
ME
NY
VT-S
Translocation
Dispersal
No significant gene flow
Fst
= 0.20398**
NH
VT-N
Slide13Results - mtDNA
ME
NY
VT-S
Translocation
Dispersal
No significant gene flow
Fst
= 0.20398**
NH
VT-N
Slide14What is next?
Increase microsatellite dataPopulation Assignment/ExclusionIdentify and map genetic clusters – barriers to gene flow
Hapeman
et al.
2011
(
http://jhered.oxfordjournals.org/content/102/3/251.full)
Slide15Marten Distribution
Develop an Occupancy ModelEstimates the probability that a parcel of land is occupied based on the habitat characteristics of the land parcel
Historically, occupancy models have been built using field survey data
Expert opinion can tap into local knowledge of species distribution and habitat selection where field data are scarce
Slide16Methods – Expert Elicitation
Identify local experts and habitat variables associated with marten occupancyCompile habitat layers in ArcGIS and develop sampling schemeDevelop survey platform for expert elicitation and distribute survey to experts
Experts predict occupancy at a suite of sites
D
evelop multiple models using logistic regression
Create suite of occupancy maps
Identify high-occupancy habitat patches and corridors
Slide17Expert Elicitation
Slide18Regression
% Forest
Road Density
Winter Precipitation
Temperature
Prob.
10
1.8
31
22
0.4
65
0.02
23
39
0.2
24
0.9
55
25
0.7
98
0
109
29
0.6
44
2.56
66
24
0.8
7
8.4
12
41
0.1
56
1.2
43
33
0.4
P(Occupancy) = 0.43 + 0.023*(%Forest) – 0.35*(
RoadDensity
)
Slide19Expert Elicitation
The “Cody” Model
Slide20Slide21CircuitScape
Dispersal corridorsPinchpoints and Barriers
Sorenson and Osborne 2014
(
http://
www.vtfishandwildlife.com
/common/pages/DisplayFile.aspx?itemId=111635)
Slide22Conclusions
Reintroduction in Southern Vermont appears to have been successfulmtDNADispersers from New Hampshire likely contributed to colonization of Northern VermontRole of Southern Vermont and Maine in colonization of Northern Vermont unclearLevel of contemporary gene flow between VT-S and VT-N unclear
Slide23Planning/Products
Better understanding of the functional/genetic connectivity of the landscapeMaps of potential occupancy and corridors will be published on NSRC website (http://nsrcforest.org/)High-occupancy parcels and corridors should be key targets for future recovery planning
Map and model can be used for future research applications:
Climate change scenarios
Forest management scenarios
Slide24Acknowledgements
Jed MurdochBill
Kilpatrick
Terri Donovan
Jonathan Katz
APLE Fund
Pittman-Robertson Federal AidNortheastern States Research CooperativeMcIntyre-StennisRubenstein School of Environment and Natural ResourcesVermont Cooperative Fish and Wildlife Research UnitUniversity of Vermont Department of BiologyVermont Fish and Wildlife Department
Chris
Bernier
Jill
Kilborn
Alexij
Siren
Cory Mosby
John
DePue
Adam Vashon
Paul
Jensen
Kim
Royar
Craig Nolan
Expert Trappers
Katy
Crumley
Paul
Hapeman
Rachel
Cliche
Katie O’Shea