
LabView Diane Kim 1 Peixing Liu 2 Farragut High School 1 University of Tennessee Knoxville 2 Acknowledgements This work was supported in part by the Engineering Research Center Program of the National Science Foundation and the Department of Energy under NSF Award Number EEC10 ID: 636979
Download Presentation The PPT/PDF document "Monitoring Blood Glucose Concentration L..." is the property of its rightful owner. Permission is granted to download and print the materials on this web site for personal, non-commercial use only, and to display it on your personal computer provided you do not modify the materials and that you retain all copyright notices contained in the materials. By downloading content from our website, you accept the terms of this agreement.


Slide1
Monitoring Blood Glucose Concentration Levels for Diabetes Using LabView
Diane Kim1, Peixing Liu2Farragut High School1, University of Tennessee Knoxville2
Acknowledgements
:
This work was supported in part by the Engineering Research Center Program of the National Science Foundation and the Department of Energy under NSF Award Number EEC-1041877 and the CURENT Industry Partnership Program.
What is diabetes?
Diabetes: group of metabolic disorders where
there are
bodily malfunctions
in the pancreas, disrupting insulin production.
Causes are still
unknown – researchers are unable to distinguish the fine line between hereditary and environmental factors.If the glucose levels are not managed properly, severe consequences can arise.Unfortunately, there is no known cure for diabetes right now. However, technology can be utilized to ease lives of those diagnosed.
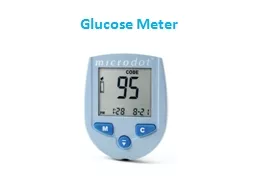
MethodologyLabview: a visual programming platform It consists of a “front panel”, which allows patients to easily view their biological information, and a “block diagram”, where the programming is actually edited and executed. For this assignment, a “simulate signal” function was utilized in lieu of a diabetic patient, which simulated the signals necessary for the system to operate. The program also calculated slopes between a given pair of figures – the glucose concentration and its correlating signal frequency.
ConclusionThis program and sensor will easily allow patients to monitor their glucose levels, especially compared to today’s methods, such as finger pricking or urine checks. The alert system is a significant utilitarian aspect of this newer device, as it will warn patients if their glucose levels are threateningly fluctuating. By using the slope formula for each pair, it ensures accuracy unattainable by other monitors that would use lines of best fit.This device is also cost effective as well as less invasive, and its straightforward use enables patients to live a diabetic life without complications and stress.
y1- y2 x1 - x2
Slope
Formula:
M=
M=CorrelationX=FrequencyY=Glucose Concentration